
Key Insights
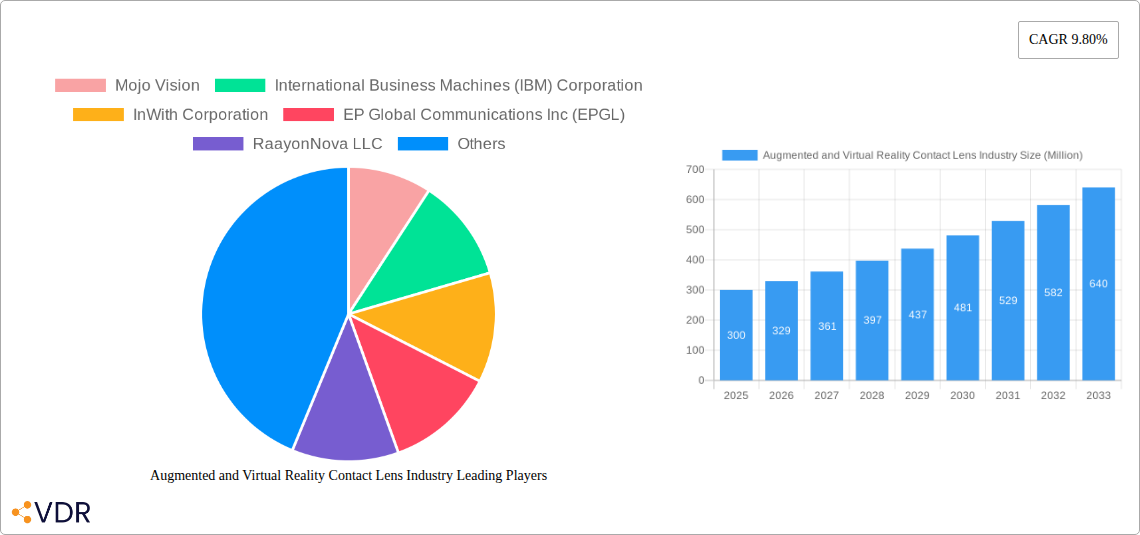
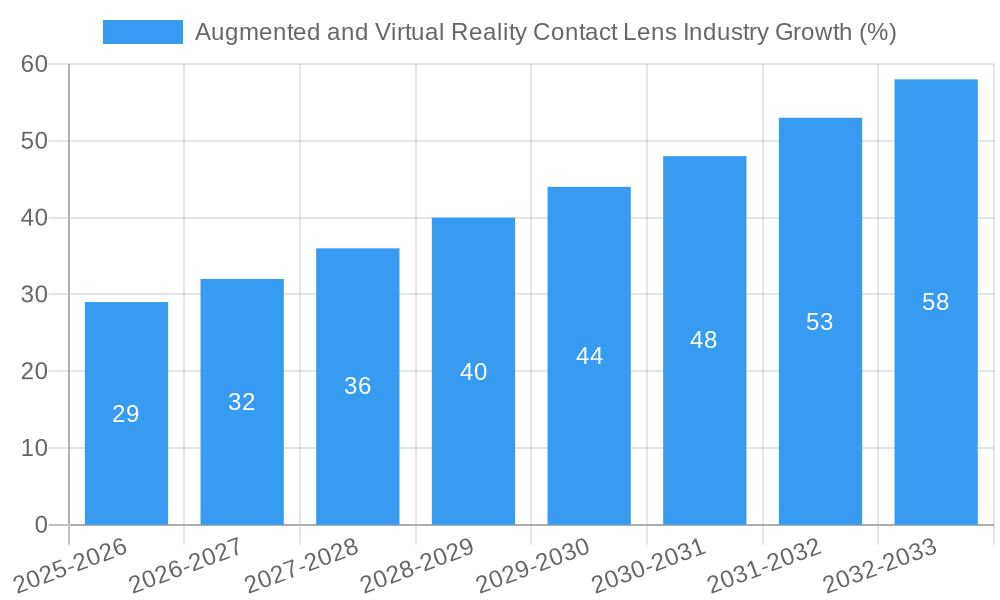
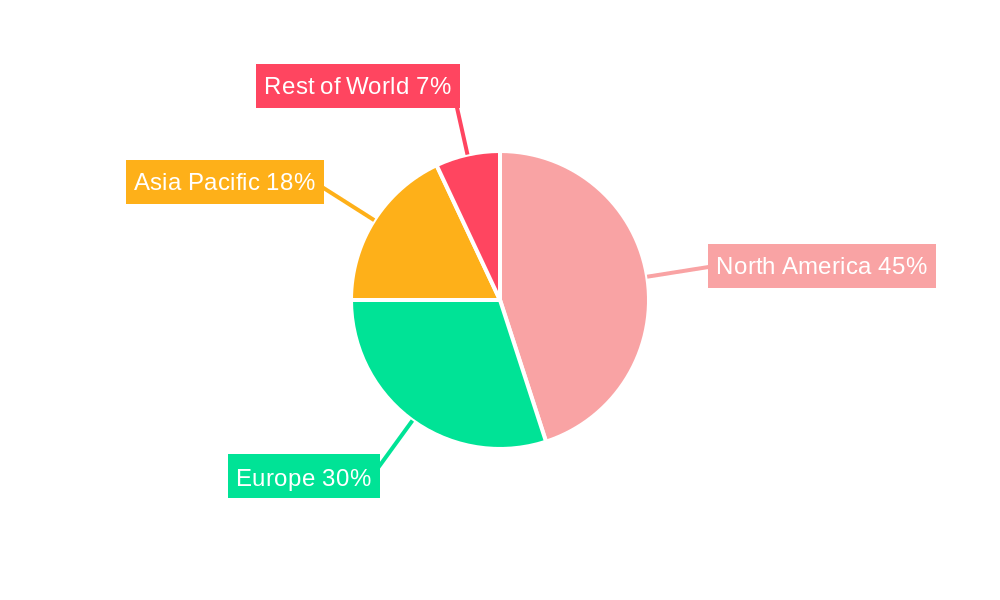
The augmented and virtual reality (AR/VR) contact lens market is poised for significant growth, driven by advancements in miniaturization of electronics, increasing demand for immersive experiences, and the development of sophisticated sensor technologies. The market, currently estimated at several hundred million dollars in 2025, is projected to experience a Compound Annual Growth Rate (CAGR) of 9.80% from 2025 to 2033, reaching a substantial market value by the end of the forecast period. Key drivers include the rising adoption of AR/VR technologies across various sectors, including healthcare (continuous glucose and intraocular pressure monitoring), gaming, and entertainment. The integration of advanced functionalities like haptic feedback and improved image resolution further fuels market expansion. Growth is segmented across lens types (rigid gas-permeable, daily-wear soft, extended-wear), applications (health monitoring, entertainment), and end-users (hospitals, clinics, individual consumers). While technological challenges related to power source miniaturization, lens comfort, and regulatory approvals present some restraints, ongoing innovation and strategic collaborations among leading companies like Johnson & Johnson, Sony, and Samsung are expected to overcome these hurdles. The North American market currently holds a significant share, followed by Europe and the Asia-Pacific region, with emerging markets in other regions exhibiting promising growth potential.
The competitive landscape is dynamic, with established players and innovative startups vying for market dominance. The success of AR/VR contact lenses hinges on the successful integration of advanced technologies into comfortable and user-friendly devices. Companies are focusing on improving battery life, enhancing image quality, and developing more comfortable lens materials to cater to the growing user base. Further market growth will also depend on the effective regulation and standardization of these innovative technologies to ensure safety and efficacy. This market is poised to revolutionize how users interact with digital information and their physical environment, impacting numerous industries and lifestyle trends in the coming years. Ongoing research and development focused on improving the technology and broadening its applications will be crucial in determining the ultimate success and reach of this innovative sector.
Augmented and Virtual Reality Contact Lens Industry: A Comprehensive Market Report (2019-2033)
This comprehensive report provides an in-depth analysis of the burgeoning Augmented and Virtual Reality (AR/VR) contact lens industry, encompassing market dynamics, growth trends, dominant segments, and key players. The study period covers 2019-2033, with 2025 as the base and estimated year. The report offers valuable insights for industry professionals, investors, and stakeholders seeking to understand and capitalize on the transformative potential of this rapidly evolving sector. The parent market is the contact lens industry, and the child market is the smart contact lens segment within AR/VR technology.
Augmented and Virtual Reality Contact Lens Industry Market Dynamics & Structure
This section analyzes the competitive landscape, technological advancements, regulatory hurdles, and market consolidation within the AR/VR contact lens industry. The market is currently characterized by moderate concentration, with key players including established contact lens manufacturers and emerging technology companies vying for market share. Technological innovation is a primary driver, with continuous advancements in miniaturization, power efficiency, and display technologies shaping product development. Regulatory frameworks, particularly concerning medical device approvals and data privacy, play a significant role in market growth.
- Market Concentration: Moderately concentrated, with a few major players and numerous smaller entrants. The market share of the top 5 players is estimated to be xx%.
- Technological Innovation Drivers: Miniaturization of components, improved power efficiency of integrated circuits, and advancements in display technologies.
- Regulatory Frameworks: Stringent regulations regarding medical device approvals and data privacy impacting market entry and product development.
- Competitive Product Substitutes: Traditional eyeglasses and contact lenses, other wearable AR/VR devices.
- End-User Demographics: Primarily individuals with vision correction needs, expanding to include patients requiring continuous health monitoring.
- M&A Trends: A moderate level of M&A activity, driven by the need for technological expertise and market expansion. The number of M&A deals in the last 5 years is estimated at xx.
Augmented and Virtual Reality Contact Lens Industry Growth Trends & Insights
The AR/VR contact lens market is experiencing significant growth, driven by increasing demand for convenient and immersive augmented reality experiences. Market size is projected to grow from xx million units in 2025 to xx million units by 2033, exhibiting a CAGR of xx%. Adoption rates are expected to increase steadily as technological advancements address limitations in battery life, image quality, and comfort. Technological disruptions, such as the introduction of bio-integrated sensors and improved display technology, will further accelerate market expansion. Shifting consumer preferences towards seamless integration of technology into daily life are also contributing factors. This growth is further fueled by increasing investments in R&D, expanding collaborations between technology companies and healthcare providers, and growing demand for minimally invasive healthcare solutions.
Dominant Regions, Countries, or Segments in Augmented and Virtual Reality Contact Lens Industry
North America currently holds the largest market share in the AR/VR contact lens industry, driven by high adoption rates, extensive research and development activities, and substantial investments in healthcare technology. Within the market, Daily-wear Soft Lenses hold the largest segment share due to their convenience and widespread acceptance. The Continuous Glucose Monitoring application is experiencing rapid growth, driven by the increasing prevalence of diabetes and the need for non-invasive monitoring solutions.
- Key Drivers: High healthcare spending in North America, supportive regulatory frameworks, and strong consumer preference for advanced healthcare technologies.
- Market Share: North America holds approximately xx% of the global market share. Daily-wear Soft lenses account for xx% of the market by type.
- Growth Potential: Significant growth potential exists in Asia-Pacific and Europe driven by rising healthcare awareness and technological advancements.
Augmented and Virtual Reality Contact Lens Industry Product Landscape
AR/VR contact lenses are evolving rapidly, incorporating advanced features like miniature displays, integrated sensors, and wireless communication capabilities. These innovations enhance functionality beyond basic vision correction, including applications in health monitoring (glucose and intraocular pressure), AR overlays, and more. Key performance metrics focus on image quality, battery life, comfort, and ease of use. Unique selling propositions include seamless integration, discreet design, and real-time data delivery.
Key Drivers, Barriers & Challenges in Augmented and Virtual Reality Contact Lens Industry
Key Drivers: Technological advancements in miniaturization, power efficiency, and display technology, increasing demand for non-invasive health monitoring solutions, and the growing consumer preference for seamless technology integration.
Challenges & Restraints: High manufacturing costs, regulatory hurdles for medical device approvals, limited battery life in current prototypes, potential concerns regarding user comfort and safety, and the need for effective and secure data transmission and storage technologies. The estimated impact of these challenges on market growth is a reduction of xx% in the forecast period.
Emerging Opportunities in Augmented and Virtual Reality Contact Lens Industry
Emerging opportunities include applications beyond vision correction and health monitoring, such as enhanced reality experiences for gaming, education, and industrial settings. Untapped markets in developing countries with high myopia prevalence represent substantial growth potential. Personalized AR/VR experiences, tailored to individual needs and preferences, will further drive market expansion.
Growth Accelerators in the Augmented and Virtual Reality Contact Lens Industry Industry
Technological breakthroughs in biocompatible materials, advanced energy storage solutions, and improved sensor technology are major catalysts for long-term growth. Strategic partnerships between technology companies and healthcare providers are crucial for market expansion and product development. Effective marketing campaigns focusing on the benefits and safety of these innovative products are essential to drive consumer adoption.
Key Players Shaping the Augmented and Virtual Reality Contact Lens Industry Market
- Mojo Vision
- International Business Machines (IBM) Corporation
- InWith Corporation
- EP Global Communications Inc (EPGL)
- RaayonNova LLC
- Johnson & Johnson
- Sony Group Corporation
- Samsung
- Innovega Inc
- Huawei Biomed
- Sensimed
Notable Milestones in Augmented and Virtual Reality Contact Lens Industry Sector
- March 2022: Mojo Vision unveiled its advanced Mojo Lens prototype, a significant milestone in smart contact lens development.
- January 2022: Innovega Inc.'s iOptik smart contact lens showed positive results in Phase 2 clinical trials.
In-Depth Augmented and Virtual Reality Contact Lens Industry Market Outlook
The AR/VR contact lens market is poised for substantial growth, driven by continuous technological advancements, increasing consumer demand, and strategic collaborations. The future holds significant opportunities for companies developing innovative products and expanding into new applications. Strategic partnerships, targeted marketing, and addressing current challenges regarding cost, comfort, and regulatory approvals will be key to unlocking the full market potential.
Augmented and Virtual Reality Contact Lens Industry Segmentation
-
1. Type
- 1.1. Rigid Gas-Permeable (RGP)
- 1.2. Daily-wear Soft Lenses
- 1.3. Extended-wear Lenses
- 1.4. Others
-
2. Application
- 2.1. Continuous Glucose Monitoring
- 2.2. Continuous Intraocular Pressure Monitoring
-
3. End User
- 3.1. Hospitals
- 3.2. Ophthalmology Clinics
- 3.3. Other End Users
Augmented and Virtual Reality Contact Lens Industry Segmentation By Geography
-
1. North America
- 1.1. United States
- 1.2. Canada
- 1.3. Mexico
-
2. Europe
- 2.1. Germany
- 2.2. United Kingdom
- 2.3. France
- 2.4. Italy
- 2.5. Spain
- 2.6. Rest of Europe
-
3. Asia Pacific
- 3.1. China
- 3.2. Japan
- 3.3. India
- 3.4. Australia
- 3.5. South Korea
- 3.6. Rest of Asia Pacific
-
4. Middle East and Africa
- 4.1. GCC
- 4.2. South Africa
- 4.3. Rest of Middle East and Africa
-
5. South America
- 5.1. Brazil
- 5.2. Argentina
- 5.3. Rest of South America
Augmented and Virtual Reality Contact Lens Industry REPORT HIGHLIGHTS
| Aspects | Details |
|---|---|
| Study Period | 2019-2033 |
| Base Year | 2024 |
| Estimated Year | 2025 |
| Forecast Period | 2025-2033 |
| Historical Period | 2019-2024 |
| Growth Rate | CAGR of 9.80% from 2019-2033 |
| Segmentation |
|
Table of Contents
- 1. Introduction
- 1.1. Research Scope
- 1.2. Market Segmentation
- 1.3. Research Methodology
- 1.4. Definitions and Assumptions
- 2. Executive Summary
- 2.1. Introduction
- 3. Market Dynamics
- 3.1. Introduction
- 3.2. Market Drivers
- 3.2.1. Rising Burden of Eye Disorders; Increasing Research and Development for Smart Contact Lenses
- 3.3. Market Restrains
- 3.3.1. High Cost of Smart Contact Lenses and Lack of Awareness
- 3.4. Market Trends
- 3.4.1. Continuous Glucose Monitoring Segment is Expected to Hold a Significant Market Share in the Smart Contact Lenses Market
- 4. Market Factor Analysis
- 4.1. Porters Five Forces
- 4.2. Supply/Value Chain
- 4.3. PESTEL analysis
- 4.4. Market Entropy
- 4.5. Patent/Trademark Analysis
- 5. Global Augmented and Virtual Reality Contact Lens Industry Analysis, Insights and Forecast, 2019-2031
- 5.1. Market Analysis, Insights and Forecast - by Type
- 5.1.1. Rigid Gas-Permeable (RGP)
- 5.1.2. Daily-wear Soft Lenses
- 5.1.3. Extended-wear Lenses
- 5.1.4. Others
- 5.2. Market Analysis, Insights and Forecast - by Application
- 5.2.1. Continuous Glucose Monitoring
- 5.2.2. Continuous Intraocular Pressure Monitoring
- 5.3. Market Analysis, Insights and Forecast - by End User
- 5.3.1. Hospitals
- 5.3.2. Ophthalmology Clinics
- 5.3.3. Other End Users
- 5.4. Market Analysis, Insights and Forecast - by Region
- 5.4.1. North America
- 5.4.2. Europe
- 5.4.3. Asia Pacific
- 5.4.4. Middle East and Africa
- 5.4.5. South America
- 5.1. Market Analysis, Insights and Forecast - by Type
- 6. North America Augmented and Virtual Reality Contact Lens Industry Analysis, Insights and Forecast, 2019-2031
- 6.1. Market Analysis, Insights and Forecast - by Type
- 6.1.1. Rigid Gas-Permeable (RGP)
- 6.1.2. Daily-wear Soft Lenses
- 6.1.3. Extended-wear Lenses
- 6.1.4. Others
- 6.2. Market Analysis, Insights and Forecast - by Application
- 6.2.1. Continuous Glucose Monitoring
- 6.2.2. Continuous Intraocular Pressure Monitoring
- 6.3. Market Analysis, Insights and Forecast - by End User
- 6.3.1. Hospitals
- 6.3.2. Ophthalmology Clinics
- 6.3.3. Other End Users
- 6.1. Market Analysis, Insights and Forecast - by Type
- 7. Europe Augmented and Virtual Reality Contact Lens Industry Analysis, Insights and Forecast, 2019-2031
- 7.1. Market Analysis, Insights and Forecast - by Type
- 7.1.1. Rigid Gas-Permeable (RGP)
- 7.1.2. Daily-wear Soft Lenses
- 7.1.3. Extended-wear Lenses
- 7.1.4. Others
- 7.2. Market Analysis, Insights and Forecast - by Application
- 7.2.1. Continuous Glucose Monitoring
- 7.2.2. Continuous Intraocular Pressure Monitoring
- 7.3. Market Analysis, Insights and Forecast - by End User
- 7.3.1. Hospitals
- 7.3.2. Ophthalmology Clinics
- 7.3.3. Other End Users
- 7.1. Market Analysis, Insights and Forecast - by Type
- 8. Asia Pacific Augmented and Virtual Reality Contact Lens Industry Analysis, Insights and Forecast, 2019-2031
- 8.1. Market Analysis, Insights and Forecast - by Type
- 8.1.1. Rigid Gas-Permeable (RGP)
- 8.1.2. Daily-wear Soft Lenses
- 8.1.3. Extended-wear Lenses
- 8.1.4. Others
- 8.2. Market Analysis, Insights and Forecast - by Application
- 8.2.1. Continuous Glucose Monitoring
- 8.2.2. Continuous Intraocular Pressure Monitoring
- 8.3. Market Analysis, Insights and Forecast - by End User
- 8.3.1. Hospitals
- 8.3.2. Ophthalmology Clinics
- 8.3.3. Other End Users
- 8.1. Market Analysis, Insights and Forecast - by Type
- 9. Middle East and Africa Augmented and Virtual Reality Contact Lens Industry Analysis, Insights and Forecast, 2019-2031
- 9.1. Market Analysis, Insights and Forecast - by Type
- 9.1.1. Rigid Gas-Permeable (RGP)
- 9.1.2. Daily-wear Soft Lenses
- 9.1.3. Extended-wear Lenses
- 9.1.4. Others
- 9.2. Market Analysis, Insights and Forecast - by Application
- 9.2.1. Continuous Glucose Monitoring
- 9.2.2. Continuous Intraocular Pressure Monitoring
- 9.3. Market Analysis, Insights and Forecast - by End User
- 9.3.1. Hospitals
- 9.3.2. Ophthalmology Clinics
- 9.3.3. Other End Users
- 9.1. Market Analysis, Insights and Forecast - by Type
- 10. South America Augmented and Virtual Reality Contact Lens Industry Analysis, Insights and Forecast, 2019-2031
- 10.1. Market Analysis, Insights and Forecast - by Type
- 10.1.1. Rigid Gas-Permeable (RGP)
- 10.1.2. Daily-wear Soft Lenses
- 10.1.3. Extended-wear Lenses
- 10.1.4. Others
- 10.2. Market Analysis, Insights and Forecast - by Application
- 10.2.1. Continuous Glucose Monitoring
- 10.2.2. Continuous Intraocular Pressure Monitoring
- 10.3. Market Analysis, Insights and Forecast - by End User
- 10.3.1. Hospitals
- 10.3.2. Ophthalmology Clinics
- 10.3.3. Other End Users
- 10.1. Market Analysis, Insights and Forecast - by Type
- 11. North America Augmented and Virtual Reality Contact Lens Industry Analysis, Insights and Forecast, 2019-2031
- 11.1. Market Analysis, Insights and Forecast - By Country/Sub-region
- 11.1.1 United States
- 11.1.2 Canada
- 11.1.3 Mexico
- 12. Europe Augmented and Virtual Reality Contact Lens Industry Analysis, Insights and Forecast, 2019-2031
- 12.1. Market Analysis, Insights and Forecast - By Country/Sub-region
- 12.1.1 Germany
- 12.1.2 United Kingdom
- 12.1.3 France
- 12.1.4 Italy
- 12.1.5 Spain
- 12.1.6 Rest of Europe
- 13. Asia Pacific Augmented and Virtual Reality Contact Lens Industry Analysis, Insights and Forecast, 2019-2031
- 13.1. Market Analysis, Insights and Forecast - By Country/Sub-region
- 13.1.1 China
- 13.1.2 Japan
- 13.1.3 India
- 13.1.4 Australia
- 13.1.5 South Korea
- 13.1.6 Rest of Asia Pacific
- 14. Middle East and Africa Augmented and Virtual Reality Contact Lens Industry Analysis, Insights and Forecast, 2019-2031
- 14.1. Market Analysis, Insights and Forecast - By Country/Sub-region
- 14.1.1 GCC
- 14.1.2 South Africa
- 14.1.3 Rest of Middle East and Africa
- 15. South America Augmented and Virtual Reality Contact Lens Industry Analysis, Insights and Forecast, 2019-2031
- 15.1. Market Analysis, Insights and Forecast - By Country/Sub-region
- 15.1.1 Brazil
- 15.1.2 Argentina
- 15.1.3 Rest of South America
- 16. Competitive Analysis
- 16.1. Global Market Share Analysis 2024
- 16.2. Company Profiles
- 16.2.1 Mojo Vision
- 16.2.1.1. Overview
- 16.2.1.2. Products
- 16.2.1.3. SWOT Analysis
- 16.2.1.4. Recent Developments
- 16.2.1.5. Financials (Based on Availability)
- 16.2.2 International Business Machines (IBM) Corporation
- 16.2.2.1. Overview
- 16.2.2.2. Products
- 16.2.2.3. SWOT Analysis
- 16.2.2.4. Recent Developments
- 16.2.2.5. Financials (Based on Availability)
- 16.2.3 InWith Corporation
- 16.2.3.1. Overview
- 16.2.3.2. Products
- 16.2.3.3. SWOT Analysis
- 16.2.3.4. Recent Developments
- 16.2.3.5. Financials (Based on Availability)
- 16.2.4 EP Global Communications Inc (EPGL)
- 16.2.4.1. Overview
- 16.2.4.2. Products
- 16.2.4.3. SWOT Analysis
- 16.2.4.4. Recent Developments
- 16.2.4.5. Financials (Based on Availability)
- 16.2.5 RaayonNova LLC
- 16.2.5.1. Overview
- 16.2.5.2. Products
- 16.2.5.3. SWOT Analysis
- 16.2.5.4. Recent Developments
- 16.2.5.5. Financials (Based on Availability)
- 16.2.6 Johnson & Johnson
- 16.2.6.1. Overview
- 16.2.6.2. Products
- 16.2.6.3. SWOT Analysis
- 16.2.6.4. Recent Developments
- 16.2.6.5. Financials (Based on Availability)
- 16.2.7 Sony Group Corporation
- 16.2.7.1. Overview
- 16.2.7.2. Products
- 16.2.7.3. SWOT Analysis
- 16.2.7.4. Recent Developments
- 16.2.7.5. Financials (Based on Availability)
- 16.2.8 Samsung
- 16.2.8.1. Overview
- 16.2.8.2. Products
- 16.2.8.3. SWOT Analysis
- 16.2.8.4. Recent Developments
- 16.2.8.5. Financials (Based on Availability)
- 16.2.9 Innovega Inc
- 16.2.9.1. Overview
- 16.2.9.2. Products
- 16.2.9.3. SWOT Analysis
- 16.2.9.4. Recent Developments
- 16.2.9.5. Financials (Based on Availability)
- 16.2.10 Huawei Biomed
- 16.2.10.1. Overview
- 16.2.10.2. Products
- 16.2.10.3. SWOT Analysis
- 16.2.10.4. Recent Developments
- 16.2.10.5. Financials (Based on Availability)
- 16.2.11 Sensimed
- 16.2.11.1. Overview
- 16.2.11.2. Products
- 16.2.11.3. SWOT Analysis
- 16.2.11.4. Recent Developments
- 16.2.11.5. Financials (Based on Availability)
- 16.2.1 Mojo Vision
List of Figures
- Figure 1: Global Augmented and Virtual Reality Contact Lens Industry Revenue Breakdown (Million, %) by Region 2024 & 2032
- Figure 2: North America Augmented and Virtual Reality Contact Lens Industry Revenue (Million), by Country 2024 & 2032
- Figure 3: North America Augmented and Virtual Reality Contact Lens Industry Revenue Share (%), by Country 2024 & 2032
- Figure 4: Europe Augmented and Virtual Reality Contact Lens Industry Revenue (Million), by Country 2024 & 2032
- Figure 5: Europe Augmented and Virtual Reality Contact Lens Industry Revenue Share (%), by Country 2024 & 2032
- Figure 6: Asia Pacific Augmented and Virtual Reality Contact Lens Industry Revenue (Million), by Country 2024 & 2032
- Figure 7: Asia Pacific Augmented and Virtual Reality Contact Lens Industry Revenue Share (%), by Country 2024 & 2032
- Figure 8: Middle East and Africa Augmented and Virtual Reality Contact Lens Industry Revenue (Million), by Country 2024 & 2032
- Figure 9: Middle East and Africa Augmented and Virtual Reality Contact Lens Industry Revenue Share (%), by Country 2024 & 2032
- Figure 10: South America Augmented and Virtual Reality Contact Lens Industry Revenue (Million), by Country 2024 & 2032
- Figure 11: South America Augmented and Virtual Reality Contact Lens Industry Revenue Share (%), by Country 2024 & 2032
- Figure 12: North America Augmented and Virtual Reality Contact Lens Industry Revenue (Million), by Type 2024 & 2032
- Figure 13: North America Augmented and Virtual Reality Contact Lens Industry Revenue Share (%), by Type 2024 & 2032
- Figure 14: North America Augmented and Virtual Reality Contact Lens Industry Revenue (Million), by Application 2024 & 2032
- Figure 15: North America Augmented and Virtual Reality Contact Lens Industry Revenue Share (%), by Application 2024 & 2032
- Figure 16: North America Augmented and Virtual Reality Contact Lens Industry Revenue (Million), by End User 2024 & 2032
- Figure 17: North America Augmented and Virtual Reality Contact Lens Industry Revenue Share (%), by End User 2024 & 2032
- Figure 18: North America Augmented and Virtual Reality Contact Lens Industry Revenue (Million), by Country 2024 & 2032
- Figure 19: North America Augmented and Virtual Reality Contact Lens Industry Revenue Share (%), by Country 2024 & 2032
- Figure 20: Europe Augmented and Virtual Reality Contact Lens Industry Revenue (Million), by Type 2024 & 2032
- Figure 21: Europe Augmented and Virtual Reality Contact Lens Industry Revenue Share (%), by Type 2024 & 2032
- Figure 22: Europe Augmented and Virtual Reality Contact Lens Industry Revenue (Million), by Application 2024 & 2032
- Figure 23: Europe Augmented and Virtual Reality Contact Lens Industry Revenue Share (%), by Application 2024 & 2032
- Figure 24: Europe Augmented and Virtual Reality Contact Lens Industry Revenue (Million), by End User 2024 & 2032
- Figure 25: Europe Augmented and Virtual Reality Contact Lens Industry Revenue Share (%), by End User 2024 & 2032
- Figure 26: Europe Augmented and Virtual Reality Contact Lens Industry Revenue (Million), by Country 2024 & 2032
- Figure 27: Europe Augmented and Virtual Reality Contact Lens Industry Revenue Share (%), by Country 2024 & 2032
- Figure 28: Asia Pacific Augmented and Virtual Reality Contact Lens Industry Revenue (Million), by Type 2024 & 2032
- Figure 29: Asia Pacific Augmented and Virtual Reality Contact Lens Industry Revenue Share (%), by Type 2024 & 2032
- Figure 30: Asia Pacific Augmented and Virtual Reality Contact Lens Industry Revenue (Million), by Application 2024 & 2032
- Figure 31: Asia Pacific Augmented and Virtual Reality Contact Lens Industry Revenue Share (%), by Application 2024 & 2032
- Figure 32: Asia Pacific Augmented and Virtual Reality Contact Lens Industry Revenue (Million), by End User 2024 & 2032
- Figure 33: Asia Pacific Augmented and Virtual Reality Contact Lens Industry Revenue Share (%), by End User 2024 & 2032
- Figure 34: Asia Pacific Augmented and Virtual Reality Contact Lens Industry Revenue (Million), by Country 2024 & 2032
- Figure 35: Asia Pacific Augmented and Virtual Reality Contact Lens Industry Revenue Share (%), by Country 2024 & 2032
- Figure 36: Middle East and Africa Augmented and Virtual Reality Contact Lens Industry Revenue (Million), by Type 2024 & 2032
- Figure 37: Middle East and Africa Augmented and Virtual Reality Contact Lens Industry Revenue Share (%), by Type 2024 & 2032
- Figure 38: Middle East and Africa Augmented and Virtual Reality Contact Lens Industry Revenue (Million), by Application 2024 & 2032
- Figure 39: Middle East and Africa Augmented and Virtual Reality Contact Lens Industry Revenue Share (%), by Application 2024 & 2032
- Figure 40: Middle East and Africa Augmented and Virtual Reality Contact Lens Industry Revenue (Million), by End User 2024 & 2032
- Figure 41: Middle East and Africa Augmented and Virtual Reality Contact Lens Industry Revenue Share (%), by End User 2024 & 2032
- Figure 42: Middle East and Africa Augmented and Virtual Reality Contact Lens Industry Revenue (Million), by Country 2024 & 2032
- Figure 43: Middle East and Africa Augmented and Virtual Reality Contact Lens Industry Revenue Share (%), by Country 2024 & 2032
- Figure 44: South America Augmented and Virtual Reality Contact Lens Industry Revenue (Million), by Type 2024 & 2032
- Figure 45: South America Augmented and Virtual Reality Contact Lens Industry Revenue Share (%), by Type 2024 & 2032
- Figure 46: South America Augmented and Virtual Reality Contact Lens Industry Revenue (Million), by Application 2024 & 2032
- Figure 47: South America Augmented and Virtual Reality Contact Lens Industry Revenue Share (%), by Application 2024 & 2032
- Figure 48: South America Augmented and Virtual Reality Contact Lens Industry Revenue (Million), by End User 2024 & 2032
- Figure 49: South America Augmented and Virtual Reality Contact Lens Industry Revenue Share (%), by End User 2024 & 2032
- Figure 50: South America Augmented and Virtual Reality Contact Lens Industry Revenue (Million), by Country 2024 & 2032
- Figure 51: South America Augmented and Virtual Reality Contact Lens Industry Revenue Share (%), by Country 2024 & 2032
List of Tables
- Table 1: Global Augmented and Virtual Reality Contact Lens Industry Revenue Million Forecast, by Region 2019 & 2032
- Table 2: Global Augmented and Virtual Reality Contact Lens Industry Revenue Million Forecast, by Type 2019 & 2032
- Table 3: Global Augmented and Virtual Reality Contact Lens Industry Revenue Million Forecast, by Application 2019 & 2032
- Table 4: Global Augmented and Virtual Reality Contact Lens Industry Revenue Million Forecast, by End User 2019 & 2032
- Table 5: Global Augmented and Virtual Reality Contact Lens Industry Revenue Million Forecast, by Region 2019 & 2032
- Table 6: Global Augmented and Virtual Reality Contact Lens Industry Revenue Million Forecast, by Country 2019 & 2032
- Table 7: United States Augmented and Virtual Reality Contact Lens Industry Revenue (Million) Forecast, by Application 2019 & 2032
- Table 8: Canada Augmented and Virtual Reality Contact Lens Industry Revenue (Million) Forecast, by Application 2019 & 2032
- Table 9: Mexico Augmented and Virtual Reality Contact Lens Industry Revenue (Million) Forecast, by Application 2019 & 2032
- Table 10: Global Augmented and Virtual Reality Contact Lens Industry Revenue Million Forecast, by Country 2019 & 2032
- Table 11: Germany Augmented and Virtual Reality Contact Lens Industry Revenue (Million) Forecast, by Application 2019 & 2032
- Table 12: United Kingdom Augmented and Virtual Reality Contact Lens Industry Revenue (Million) Forecast, by Application 2019 & 2032
- Table 13: France Augmented and Virtual Reality Contact Lens Industry Revenue (Million) Forecast, by Application 2019 & 2032
- Table 14: Italy Augmented and Virtual Reality Contact Lens Industry Revenue (Million) Forecast, by Application 2019 & 2032
- Table 15: Spain Augmented and Virtual Reality Contact Lens Industry Revenue (Million) Forecast, by Application 2019 & 2032
- Table 16: Rest of Europe Augmented and Virtual Reality Contact Lens Industry Revenue (Million) Forecast, by Application 2019 & 2032
- Table 17: Global Augmented and Virtual Reality Contact Lens Industry Revenue Million Forecast, by Country 2019 & 2032
- Table 18: China Augmented and Virtual Reality Contact Lens Industry Revenue (Million) Forecast, by Application 2019 & 2032
- Table 19: Japan Augmented and Virtual Reality Contact Lens Industry Revenue (Million) Forecast, by Application 2019 & 2032
- Table 20: India Augmented and Virtual Reality Contact Lens Industry Revenue (Million) Forecast, by Application 2019 & 2032
- Table 21: Australia Augmented and Virtual Reality Contact Lens Industry Revenue (Million) Forecast, by Application 2019 & 2032
- Table 22: South Korea Augmented and Virtual Reality Contact Lens Industry Revenue (Million) Forecast, by Application 2019 & 2032
- Table 23: Rest of Asia Pacific Augmented and Virtual Reality Contact Lens Industry Revenue (Million) Forecast, by Application 2019 & 2032
- Table 24: Global Augmented and Virtual Reality Contact Lens Industry Revenue Million Forecast, by Country 2019 & 2032
- Table 25: GCC Augmented and Virtual Reality Contact Lens Industry Revenue (Million) Forecast, by Application 2019 & 2032
- Table 26: South Africa Augmented and Virtual Reality Contact Lens Industry Revenue (Million) Forecast, by Application 2019 & 2032
- Table 27: Rest of Middle East and Africa Augmented and Virtual Reality Contact Lens Industry Revenue (Million) Forecast, by Application 2019 & 2032
- Table 28: Global Augmented and Virtual Reality Contact Lens Industry Revenue Million Forecast, by Country 2019 & 2032
- Table 29: Brazil Augmented and Virtual Reality Contact Lens Industry Revenue (Million) Forecast, by Application 2019 & 2032
- Table 30: Argentina Augmented and Virtual Reality Contact Lens Industry Revenue (Million) Forecast, by Application 2019 & 2032
- Table 31: Rest of South America Augmented and Virtual Reality Contact Lens Industry Revenue (Million) Forecast, by Application 2019 & 2032
- Table 32: Global Augmented and Virtual Reality Contact Lens Industry Revenue Million Forecast, by Type 2019 & 2032
- Table 33: Global Augmented and Virtual Reality Contact Lens Industry Revenue Million Forecast, by Application 2019 & 2032
- Table 34: Global Augmented and Virtual Reality Contact Lens Industry Revenue Million Forecast, by End User 2019 & 2032
- Table 35: Global Augmented and Virtual Reality Contact Lens Industry Revenue Million Forecast, by Country 2019 & 2032
- Table 36: United States Augmented and Virtual Reality Contact Lens Industry Revenue (Million) Forecast, by Application 2019 & 2032
- Table 37: Canada Augmented and Virtual Reality Contact Lens Industry Revenue (Million) Forecast, by Application 2019 & 2032
- Table 38: Mexico Augmented and Virtual Reality Contact Lens Industry Revenue (Million) Forecast, by Application 2019 & 2032
- Table 39: Global Augmented and Virtual Reality Contact Lens Industry Revenue Million Forecast, by Type 2019 & 2032
- Table 40: Global Augmented and Virtual Reality Contact Lens Industry Revenue Million Forecast, by Application 2019 & 2032
- Table 41: Global Augmented and Virtual Reality Contact Lens Industry Revenue Million Forecast, by End User 2019 & 2032
- Table 42: Global Augmented and Virtual Reality Contact Lens Industry Revenue Million Forecast, by Country 2019 & 2032
- Table 43: Germany Augmented and Virtual Reality Contact Lens Industry Revenue (Million) Forecast, by Application 2019 & 2032
- Table 44: United Kingdom Augmented and Virtual Reality Contact Lens Industry Revenue (Million) Forecast, by Application 2019 & 2032
- Table 45: France Augmented and Virtual Reality Contact Lens Industry Revenue (Million) Forecast, by Application 2019 & 2032
- Table 46: Italy Augmented and Virtual Reality Contact Lens Industry Revenue (Million) Forecast, by Application 2019 & 2032
- Table 47: Spain Augmented and Virtual Reality Contact Lens Industry Revenue (Million) Forecast, by Application 2019 & 2032
- Table 48: Rest of Europe Augmented and Virtual Reality Contact Lens Industry Revenue (Million) Forecast, by Application 2019 & 2032
- Table 49: Global Augmented and Virtual Reality Contact Lens Industry Revenue Million Forecast, by Type 2019 & 2032
- Table 50: Global Augmented and Virtual Reality Contact Lens Industry Revenue Million Forecast, by Application 2019 & 2032
- Table 51: Global Augmented and Virtual Reality Contact Lens Industry Revenue Million Forecast, by End User 2019 & 2032
- Table 52: Global Augmented and Virtual Reality Contact Lens Industry Revenue Million Forecast, by Country 2019 & 2032
- Table 53: China Augmented and Virtual Reality Contact Lens Industry Revenue (Million) Forecast, by Application 2019 & 2032
- Table 54: Japan Augmented and Virtual Reality Contact Lens Industry Revenue (Million) Forecast, by Application 2019 & 2032
- Table 55: India Augmented and Virtual Reality Contact Lens Industry Revenue (Million) Forecast, by Application 2019 & 2032
- Table 56: Australia Augmented and Virtual Reality Contact Lens Industry Revenue (Million) Forecast, by Application 2019 & 2032
- Table 57: South Korea Augmented and Virtual Reality Contact Lens Industry Revenue (Million) Forecast, by Application 2019 & 2032
- Table 58: Rest of Asia Pacific Augmented and Virtual Reality Contact Lens Industry Revenue (Million) Forecast, by Application 2019 & 2032
- Table 59: Global Augmented and Virtual Reality Contact Lens Industry Revenue Million Forecast, by Type 2019 & 2032
- Table 60: Global Augmented and Virtual Reality Contact Lens Industry Revenue Million Forecast, by Application 2019 & 2032
- Table 61: Global Augmented and Virtual Reality Contact Lens Industry Revenue Million Forecast, by End User 2019 & 2032
- Table 62: Global Augmented and Virtual Reality Contact Lens Industry Revenue Million Forecast, by Country 2019 & 2032
- Table 63: GCC Augmented and Virtual Reality Contact Lens Industry Revenue (Million) Forecast, by Application 2019 & 2032
- Table 64: South Africa Augmented and Virtual Reality Contact Lens Industry Revenue (Million) Forecast, by Application 2019 & 2032
- Table 65: Rest of Middle East and Africa Augmented and Virtual Reality Contact Lens Industry Revenue (Million) Forecast, by Application 2019 & 2032
- Table 66: Global Augmented and Virtual Reality Contact Lens Industry Revenue Million Forecast, by Type 2019 & 2032
- Table 67: Global Augmented and Virtual Reality Contact Lens Industry Revenue Million Forecast, by Application 2019 & 2032
- Table 68: Global Augmented and Virtual Reality Contact Lens Industry Revenue Million Forecast, by End User 2019 & 2032
- Table 69: Global Augmented and Virtual Reality Contact Lens Industry Revenue Million Forecast, by Country 2019 & 2032
- Table 70: Brazil Augmented and Virtual Reality Contact Lens Industry Revenue (Million) Forecast, by Application 2019 & 2032
- Table 71: Argentina Augmented and Virtual Reality Contact Lens Industry Revenue (Million) Forecast, by Application 2019 & 2032
- Table 72: Rest of South America Augmented and Virtual Reality Contact Lens Industry Revenue (Million) Forecast, by Application 2019 & 2032
Frequently Asked Questions
1. What is the projected Compound Annual Growth Rate (CAGR) of the Augmented and Virtual Reality Contact Lens Industry?
The projected CAGR is approximately 9.80%.
2. Which companies are prominent players in the Augmented and Virtual Reality Contact Lens Industry?
Key companies in the market include Mojo Vision, International Business Machines (IBM) Corporation, InWith Corporation, EP Global Communications Inc (EPGL), RaayonNova LLC, Johnson & Johnson, Sony Group Corporation, Samsung, Innovega Inc, Huawei Biomed, Sensimed.
3. What are the main segments of the Augmented and Virtual Reality Contact Lens Industry?
The market segments include Type, Application, End User.
4. Can you provide details about the market size?
The market size is estimated to be USD XX Million as of 2022.
5. What are some drivers contributing to market growth?
Rising Burden of Eye Disorders; Increasing Research and Development for Smart Contact Lenses.
6. What are the notable trends driving market growth?
Continuous Glucose Monitoring Segment is Expected to Hold a Significant Market Share in the Smart Contact Lenses Market.
7. Are there any restraints impacting market growth?
High Cost of Smart Contact Lenses and Lack of Awareness.
8. Can you provide examples of recent developments in the market?
March 2022: Mojo Vision, the Invisible Computing Company, introduced its most advanced prototype of Mojo Lens, the world's first true smart contact lens, including an array of new, industry-first features. The Mojo Lens prototype is a critical milestone for the company in its development, testing, and validation process. It is an innovation positioned at the intersection of smartphones, Augmented Reality/Virtual Reality, smart wearables, and health tech.
9. What pricing options are available for accessing the report?
Pricing options include single-user, multi-user, and enterprise licenses priced at USD 4750, USD 5250, and USD 8750 respectively.
10. Is the market size provided in terms of value or volume?
The market size is provided in terms of value, measured in Million.
11. Are there any specific market keywords associated with the report?
Yes, the market keyword associated with the report is "Augmented and Virtual Reality Contact Lens Industry," which aids in identifying and referencing the specific market segment covered.
12. How do I determine which pricing option suits my needs best?
The pricing options vary based on user requirements and access needs. Individual users may opt for single-user licenses, while businesses requiring broader access may choose multi-user or enterprise licenses for cost-effective access to the report.
13. Are there any additional resources or data provided in the Augmented and Virtual Reality Contact Lens Industry report?
While the report offers comprehensive insights, it's advisable to review the specific contents or supplementary materials provided to ascertain if additional resources or data are available.
14. How can I stay updated on further developments or reports in the Augmented and Virtual Reality Contact Lens Industry?
To stay informed about further developments, trends, and reports in the Augmented and Virtual Reality Contact Lens Industry, consider subscribing to industry newsletters, following relevant companies and organizations, or regularly checking reputable industry news sources and publications.
Methodology
Step 1 - Identification of Relevant Samples Size from Population Database


Step 2 - Approaches for Defining Global Market Size (Value, Volume* & Price*)

Note*: In applicable scenarios
Step 3 - Data Sources
Primary Research
- Web Analytics
- Survey Reports
- Research Institute
- Latest Research Reports
- Opinion Leaders
Secondary Research
- Annual Reports
- White Paper
- Latest Press Release
- Industry Association
- Paid Database
- Investor Presentations

Step 4 - Data Triangulation
Involves using different sources of information in order to increase the validity of a study
These sources are likely to be stakeholders in a program - participants, other researchers, program staff, other community members, and so on.
Then we put all data in single framework & apply various statistical tools to find out the dynamic on the market.
During the analysis stage, feedback from the stakeholder groups would be compared to determine areas of agreement as well as areas of divergence


