
Key Insights
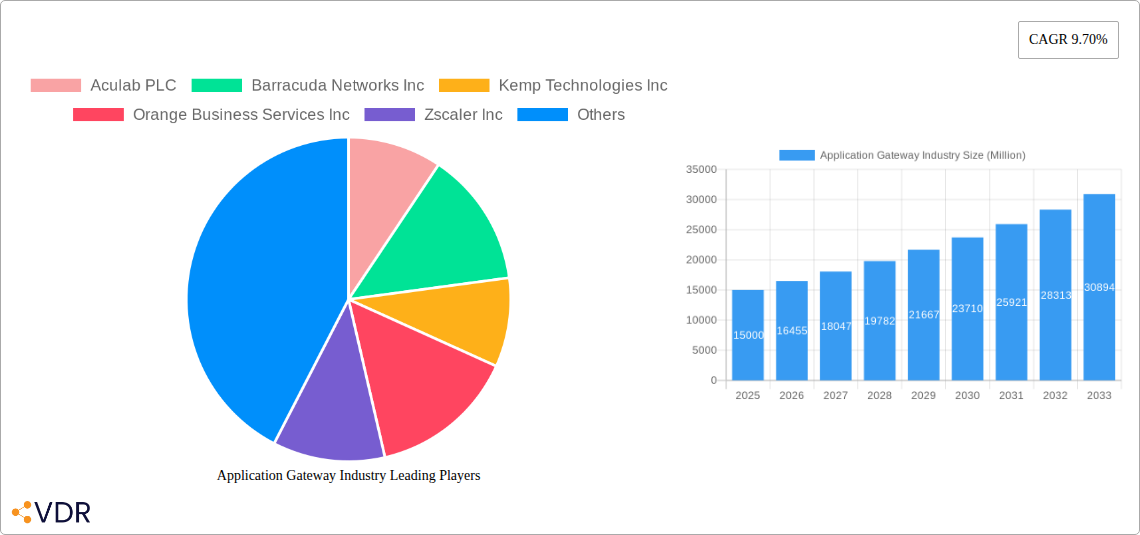
The Application Gateway market is experiencing robust growth, projected to reach a substantial size, driven by the increasing adoption of cloud computing, the expanding digital landscape, and the rising need for enhanced security and scalability. The market's 9.70% CAGR from 2019 to 2024 indicates a significant upward trajectory, and this momentum is expected to continue through 2033. Key drivers include the need for improved application performance and availability, the shift towards microservices architectures, and the growing demand for secure access to applications across diverse environments, including hybrid and multi-cloud deployments. The market is segmented by offering (solutions and services), organization size (small and medium enterprises (SMEs) and large enterprises), and end-user verticals (BFSI, IT and telecommunications, retail, healthcare, and others such as education, government, and energy & utilities). Large enterprises currently dominate the market due to their greater IT budgets and complex application deployments, however, growing adoption among SMEs is expected to contribute significantly to market expansion in the coming years. The competitive landscape is dynamic, with established players like F5 Networks, Citrix Systems, and Palo Alto Networks alongside emerging technology providers constantly innovating and expanding their product offerings to meet evolving customer requirements. Geographic growth is anticipated across all regions, with North America and Europe holding significant market share initially, followed by a strong rise from the Asia-Pacific region driven by increasing digitalization and technological advancements.
The restraining factors include the complexity of implementation and management, the need for skilled professionals, and the cost of deployment, particularly for smaller organizations. However, the ongoing advancements in automation, the availability of managed services, and the increasing awareness of cybersecurity threats are expected to mitigate these challenges. The market's future growth will be shaped by innovations in areas such as AI-powered security, serverless computing, and edge computing, allowing for greater efficiency, scalability, and security for applications. The increasing adoption of DevOps practices and the growing reliance on cloud-native applications will further accelerate market growth, driving the demand for sophisticated application gateway solutions that can efficiently manage application traffic and ensure high availability.
Application Gateway Industry Market Report: 2019-2033
This comprehensive report provides a detailed analysis of the Application Gateway industry, encompassing market dynamics, growth trends, regional performance, competitive landscape, and future outlook. The study period covers 2019-2033, with 2025 as the base and estimated year. The forecast period extends from 2025 to 2033, and the historical period spans 2019-2024. The report segments the market by offering (Solutions, Services), organization size (Small and Medium Enterprise, Large Enterprise), and end-user verticals (BFSI, IT and Telecommunication, Retail, Healthcare, Others – Education, Government, and Energy & Utilities). Key players analyzed include Aculab PLC, Barracuda Networks Inc, Kemp Technologies Inc, Orange Business Services Inc, Zscaler Inc, Akamai Technologies Inc, Avi Networks Inc, F5 Networks Inc, Imperva Inc, Microsoft Corporation, Snapt Inc, Forcepoint LLC, Palo Alto Networks Inc, Citrix Systems Inc, and SAP SE. The global Application Gateway market is projected to reach xx Million by 2033.
Application Gateway Industry Market Dynamics & Structure
The Application Gateway market is characterized by a moderately concentrated landscape, with a few major players holding significant market share. Technological innovation, particularly in areas like AI-powered security and cloud-native architectures, is a primary growth driver. Regulatory frameworks, such as GDPR and CCPA, are shaping security protocols and influencing product development. Competitive substitutes include traditional firewalls and VPNs, while the market faces challenges from open-source solutions. End-user demographics are shifting towards cloud adoption and increased reliance on digital services, impacting demand. M&A activity has been relatively high in recent years, with several strategic acquisitions aimed at expanding market reach and technological capabilities. The global market size in 2025 is estimated at 1500 Million.
- Market Concentration: Highly concentrated, with top 5 players holding approximately 60% market share in 2025.
- Technological Innovation: AI/ML integration, automation, and cloud-native architectures are key drivers.
- Regulatory Landscape: GDPR, CCPA, and other regional regulations influence security requirements.
- Competitive Substitutes: Traditional firewalls, VPNs, and open-source solutions present competition.
- M&A Activity: Significant M&A activity observed, with xx deals in the past 5 years, averaging xx Million USD per deal.
- End-User Demographics: Increasing cloud adoption and digital transformation fuel market growth.
Application Gateway Industry Growth Trends & Insights
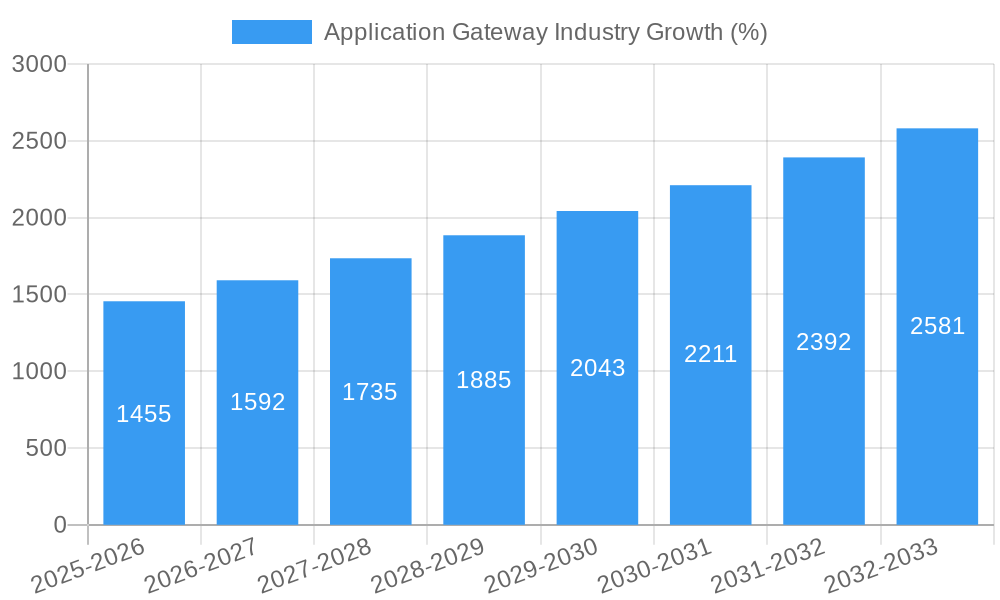
The Application Gateway market experienced robust growth during the historical period (2019-2024), driven by increasing adoption of cloud computing, the rise of mobile applications, and heightened security concerns. The market is projected to maintain a healthy Compound Annual Growth Rate (CAGR) of xx% during the forecast period (2025-2033). This growth is fueled by technological advancements, such as the integration of Artificial Intelligence (AI) and Machine Learning (ML) for enhanced threat detection and response. Moreover, the increasing adoption of DevOps methodologies and the shift towards microservices architectures are driving demand for sophisticated application gateways that can efficiently manage and secure complex application deployments. The growing adoption of edge computing is also creating new opportunities for application gateways to improve application performance and latency. Consumer behavior is shifting toward increased reliance on online services, which further bolsters market expansion. Market penetration increased from xx% in 2019 to xx% in 2024.
Dominant Regions, Countries, or Segments in Application Gateway Industry
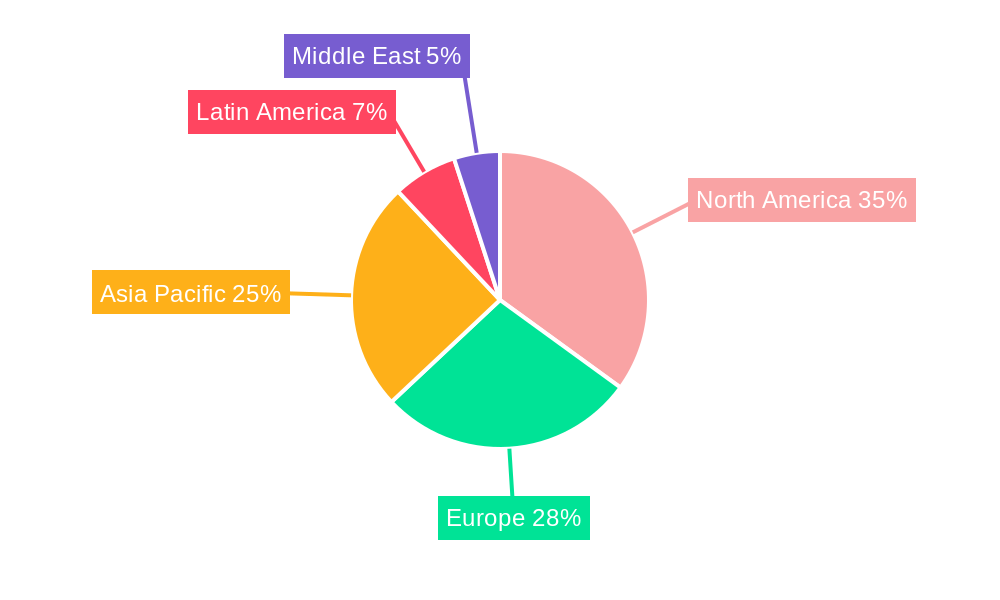
North America currently dominates the Application Gateway market, driven by early adoption of cloud technologies, a robust IT infrastructure, and strong regulatory frameworks focused on data security. Europe is experiencing significant growth, driven by increasing digital transformation initiatives and regulatory compliance demands. The Asia-Pacific region presents substantial untapped potential, with rapidly growing economies and increasing adoption of cloud services.
- By Offering: The Solutions segment holds the largest market share (xx%), followed by Services (xx%).
- By Organization Size: Large Enterprises dominate the market (xx%), driven by higher budgets and complex IT environments.
- By End-user Verticals: The BFSI and IT and Telecommunication sectors are the major contributors (BFSI - xx%, IT and Telecom - xx%).
- Key Drivers: Strong government support for digital transformation, investments in cloud infrastructure, and stringent data security regulations.
Application Gateway Industry Product Landscape
Application gateways are evolving rapidly, incorporating advanced features like AI-powered threat detection, automated security policy management, and seamless integration with cloud platforms. Key innovations include improved performance metrics, such as reduced latency and increased throughput. Unique selling propositions include advanced threat intelligence feeds, robust API management capabilities, and zero-trust security architectures. These advancements enhance security, scalability, and overall application performance.
Key Drivers, Barriers & Challenges in Application Gateway Industry
Key Drivers: Increased adoption of cloud computing, heightened security concerns, growth of mobile applications, and increasing demand for improved application performance.
Challenges: Integration complexities, cost of implementation, the need for skilled personnel, and the rise of open-source alternatives. These challenges may result in a xx% reduction in adoption rates in certain segments.
Emerging Opportunities in Application Gateway Industry
Emerging opportunities lie in the growing adoption of edge computing, the rise of 5G networks, and the increasing demand for secure access service edge (SASE) solutions. Untapped markets include the expanding IoT landscape and the increasing penetration of cloud services in developing economies. Opportunities also exist in developing more advanced AI-driven security features for application gateways.
Growth Accelerators in the Application Gateway Industry
Strategic partnerships, technological breakthroughs in areas like AI/ML and serverless computing, and focused expansion into untapped regional markets are crucial growth catalysts. These efforts create a synergistic effect driving market expansion and improved market penetration.
Key Players Shaping the Application Gateway Industry Market
- Aculab PLC
- Barracuda Networks Inc
- Kemp Technologies Inc
- Orange Business Services Inc
- Zscaler Inc
- Akamai Technologies Inc
- Avi Networks Inc
- F5 Networks Inc
- Imperva Inc
- Microsoft Corporation
- Snapt Inc
- Forcepoint LLC
- Palo Alto Networks Inc
- Citrix Systems Inc
- SAP SE
Notable Milestones in Application Gateway Industry Sector
- 2020: Increased focus on cloud-native application gateways.
- 2021: Several major players acquired smaller companies specializing in AI-powered security.
- 2022: Significant adoption of SASE architectures observed.
- 2023: Launch of several new application gateways integrating advanced AI/ML capabilities.
In-Depth Application Gateway Industry Market Outlook
The Application Gateway market is poised for continued strong growth, driven by ongoing digital transformation, the expansion of cloud computing, and the increasing focus on cybersecurity. Strategic opportunities lie in developing innovative solutions that address the evolving needs of enterprises in a rapidly changing technological landscape. The market's future potential is considerable, and companies that can effectively leverage AI/ML and provide integrated solutions will be best positioned for success.
Application Gateway Industry Segmentation
-
1. Offering
- 1.1. Solutions
- 1.2. Services
-
2. Organization Size
- 2.1. Small and Medium Enterprise
- 2.2. Large Enterprise
-
3. End-user Verticals
- 3.1. BFSi
- 3.2. IT and Telecommunication
- 3.3. Retail
- 3.4. Healthcare
- 3.5. Others (
Application Gateway Industry Segmentation By Geography
- 1. North America
- 2. Europe
- 3. Asia Pacific
- 4. Latin America
- 5. Middle East
Application Gateway Industry REPORT HIGHLIGHTS
| Aspects | Details |
|---|---|
| Study Period | 2019-2033 |
| Base Year | 2024 |
| Estimated Year | 2025 |
| Forecast Period | 2025-2033 |
| Historical Period | 2019-2024 |
| Growth Rate | CAGR of 9.70% from 2019-2033 |
| Segmentation |
|
Table of Contents
- 1. Introduction
- 1.1. Research Scope
- 1.2. Market Segmentation
- 1.3. Research Methodology
- 1.4. Definitions and Assumptions
- 2. Executive Summary
- 2.1. Introduction
- 3. Market Dynamics
- 3.1. Introduction
- 3.2. Market Drivers
- 3.2.1. ; Growth in Number of Different Application Layer Attacks
- 3.3. Market Restrains
- 3.3.1. ; Lack of Mandatory Regulations for Information Security
- 3.4. Market Trends
- 3.4.1. Healthcare Segment to Show Significant Growth
- 4. Market Factor Analysis
- 4.1. Porters Five Forces
- 4.2. Supply/Value Chain
- 4.3. PESTEL analysis
- 4.4. Market Entropy
- 4.5. Patent/Trademark Analysis
- 5. Global Application Gateway Industry Analysis, Insights and Forecast, 2019-2031
- 5.1. Market Analysis, Insights and Forecast - by Offering
- 5.1.1. Solutions
- 5.1.2. Services
- 5.2. Market Analysis, Insights and Forecast - by Organization Size
- 5.2.1. Small and Medium Enterprise
- 5.2.2. Large Enterprise
- 5.3. Market Analysis, Insights and Forecast - by End-user Verticals
- 5.3.1. BFSi
- 5.3.2. IT and Telecommunication
- 5.3.3. Retail
- 5.3.4. Healthcare
- 5.3.5. Others (
- 5.4. Market Analysis, Insights and Forecast - by Region
- 5.4.1. North America
- 5.4.2. Europe
- 5.4.3. Asia Pacific
- 5.4.4. Latin America
- 5.4.5. Middle East
- 5.1. Market Analysis, Insights and Forecast - by Offering
- 6. North America Application Gateway Industry Analysis, Insights and Forecast, 2019-2031
- 6.1. Market Analysis, Insights and Forecast - by Offering
- 6.1.1. Solutions
- 6.1.2. Services
- 6.2. Market Analysis, Insights and Forecast - by Organization Size
- 6.2.1. Small and Medium Enterprise
- 6.2.2. Large Enterprise
- 6.3. Market Analysis, Insights and Forecast - by End-user Verticals
- 6.3.1. BFSi
- 6.3.2. IT and Telecommunication
- 6.3.3. Retail
- 6.3.4. Healthcare
- 6.3.5. Others (
- 6.1. Market Analysis, Insights and Forecast - by Offering
- 7. Europe Application Gateway Industry Analysis, Insights and Forecast, 2019-2031
- 7.1. Market Analysis, Insights and Forecast - by Offering
- 7.1.1. Solutions
- 7.1.2. Services
- 7.2. Market Analysis, Insights and Forecast - by Organization Size
- 7.2.1. Small and Medium Enterprise
- 7.2.2. Large Enterprise
- 7.3. Market Analysis, Insights and Forecast - by End-user Verticals
- 7.3.1. BFSi
- 7.3.2. IT and Telecommunication
- 7.3.3. Retail
- 7.3.4. Healthcare
- 7.3.5. Others (
- 7.1. Market Analysis, Insights and Forecast - by Offering
- 8. Asia Pacific Application Gateway Industry Analysis, Insights and Forecast, 2019-2031
- 8.1. Market Analysis, Insights and Forecast - by Offering
- 8.1.1. Solutions
- 8.1.2. Services
- 8.2. Market Analysis, Insights and Forecast - by Organization Size
- 8.2.1. Small and Medium Enterprise
- 8.2.2. Large Enterprise
- 8.3. Market Analysis, Insights and Forecast - by End-user Verticals
- 8.3.1. BFSi
- 8.3.2. IT and Telecommunication
- 8.3.3. Retail
- 8.3.4. Healthcare
- 8.3.5. Others (
- 8.1. Market Analysis, Insights and Forecast - by Offering
- 9. Latin America Application Gateway Industry Analysis, Insights and Forecast, 2019-2031
- 9.1. Market Analysis, Insights and Forecast - by Offering
- 9.1.1. Solutions
- 9.1.2. Services
- 9.2. Market Analysis, Insights and Forecast - by Organization Size
- 9.2.1. Small and Medium Enterprise
- 9.2.2. Large Enterprise
- 9.3. Market Analysis, Insights and Forecast - by End-user Verticals
- 9.3.1. BFSi
- 9.3.2. IT and Telecommunication
- 9.3.3. Retail
- 9.3.4. Healthcare
- 9.3.5. Others (
- 9.1. Market Analysis, Insights and Forecast - by Offering
- 10. Middle East Application Gateway Industry Analysis, Insights and Forecast, 2019-2031
- 10.1. Market Analysis, Insights and Forecast - by Offering
- 10.1.1. Solutions
- 10.1.2. Services
- 10.2. Market Analysis, Insights and Forecast - by Organization Size
- 10.2.1. Small and Medium Enterprise
- 10.2.2. Large Enterprise
- 10.3. Market Analysis, Insights and Forecast - by End-user Verticals
- 10.3.1. BFSi
- 10.3.2. IT and Telecommunication
- 10.3.3. Retail
- 10.3.4. Healthcare
- 10.3.5. Others (
- 10.1. Market Analysis, Insights and Forecast - by Offering
- 11. North America Application Gateway Industry Analysis, Insights and Forecast, 2019-2031
- 11.1. Market Analysis, Insights and Forecast - By Country/Sub-region
- 11.1.1.
- 12. Europe Application Gateway Industry Analysis, Insights and Forecast, 2019-2031
- 12.1. Market Analysis, Insights and Forecast - By Country/Sub-region
- 12.1.1.
- 13. Asia Pacific Application Gateway Industry Analysis, Insights and Forecast, 2019-2031
- 13.1. Market Analysis, Insights and Forecast - By Country/Sub-region
- 13.1.1.
- 14. Latin America Application Gateway Industry Analysis, Insights and Forecast, 2019-2031
- 14.1. Market Analysis, Insights and Forecast - By Country/Sub-region
- 14.1.1.
- 15. Middle East Application Gateway Industry Analysis, Insights and Forecast, 2019-2031
- 15.1. Market Analysis, Insights and Forecast - By Country/Sub-region
- 15.1.1.
- 16. Competitive Analysis
- 16.1. Global Market Share Analysis 2024
- 16.2. Company Profiles
- 16.2.1 Aculab PLC
- 16.2.1.1. Overview
- 16.2.1.2. Products
- 16.2.1.3. SWOT Analysis
- 16.2.1.4. Recent Developments
- 16.2.1.5. Financials (Based on Availability)
- 16.2.2 Barracuda Networks Inc
- 16.2.2.1. Overview
- 16.2.2.2. Products
- 16.2.2.3. SWOT Analysis
- 16.2.2.4. Recent Developments
- 16.2.2.5. Financials (Based on Availability)
- 16.2.3 Kemp Technologies Inc
- 16.2.3.1. Overview
- 16.2.3.2. Products
- 16.2.3.3. SWOT Analysis
- 16.2.3.4. Recent Developments
- 16.2.3.5. Financials (Based on Availability)
- 16.2.4 Orange Business Services Inc
- 16.2.4.1. Overview
- 16.2.4.2. Products
- 16.2.4.3. SWOT Analysis
- 16.2.4.4. Recent Developments
- 16.2.4.5. Financials (Based on Availability)
- 16.2.5 Zscaler Inc
- 16.2.5.1. Overview
- 16.2.5.2. Products
- 16.2.5.3. SWOT Analysis
- 16.2.5.4. Recent Developments
- 16.2.5.5. Financials (Based on Availability)
- 16.2.6 Akamai Technolgies Inc
- 16.2.6.1. Overview
- 16.2.6.2. Products
- 16.2.6.3. SWOT Analysis
- 16.2.6.4. Recent Developments
- 16.2.6.5. Financials (Based on Availability)
- 16.2.7 Avi Networks Inc
- 16.2.7.1. Overview
- 16.2.7.2. Products
- 16.2.7.3. SWOT Analysis
- 16.2.7.4. Recent Developments
- 16.2.7.5. Financials (Based on Availability)
- 16.2.8 F5 Networks Inc
- 16.2.8.1. Overview
- 16.2.8.2. Products
- 16.2.8.3. SWOT Analysis
- 16.2.8.4. Recent Developments
- 16.2.8.5. Financials (Based on Availability)
- 16.2.9 Imperva Inc
- 16.2.9.1. Overview
- 16.2.9.2. Products
- 16.2.9.3. SWOT Analysis
- 16.2.9.4. Recent Developments
- 16.2.9.5. Financials (Based on Availability)
- 16.2.10 Microsoft Corporation
- 16.2.10.1. Overview
- 16.2.10.2. Products
- 16.2.10.3. SWOT Analysis
- 16.2.10.4. Recent Developments
- 16.2.10.5. Financials (Based on Availability)
- 16.2.11 Snapt Inc
- 16.2.11.1. Overview
- 16.2.11.2. Products
- 16.2.11.3. SWOT Analysis
- 16.2.11.4. Recent Developments
- 16.2.11.5. Financials (Based on Availability)
- 16.2.12 Forcepoint LLC
- 16.2.12.1. Overview
- 16.2.12.2. Products
- 16.2.12.3. SWOT Analysis
- 16.2.12.4. Recent Developments
- 16.2.12.5. Financials (Based on Availability)
- 16.2.13 Palo Alto Networks Inc
- 16.2.13.1. Overview
- 16.2.13.2. Products
- 16.2.13.3. SWOT Analysis
- 16.2.13.4. Recent Developments
- 16.2.13.5. Financials (Based on Availability)
- 16.2.14 Citrix Systems Inc
- 16.2.14.1. Overview
- 16.2.14.2. Products
- 16.2.14.3. SWOT Analysis
- 16.2.14.4. Recent Developments
- 16.2.14.5. Financials (Based on Availability)
- 16.2.15 SAP SE
- 16.2.15.1. Overview
- 16.2.15.2. Products
- 16.2.15.3. SWOT Analysis
- 16.2.15.4. Recent Developments
- 16.2.15.5. Financials (Based on Availability)
- 16.2.1 Aculab PLC
List of Figures
- Figure 1: Global Application Gateway Industry Revenue Breakdown (Million, %) by Region 2024 & 2032
- Figure 2: North America Application Gateway Industry Revenue (Million), by Country 2024 & 2032
- Figure 3: North America Application Gateway Industry Revenue Share (%), by Country 2024 & 2032
- Figure 4: Europe Application Gateway Industry Revenue (Million), by Country 2024 & 2032
- Figure 5: Europe Application Gateway Industry Revenue Share (%), by Country 2024 & 2032
- Figure 6: Asia Pacific Application Gateway Industry Revenue (Million), by Country 2024 & 2032
- Figure 7: Asia Pacific Application Gateway Industry Revenue Share (%), by Country 2024 & 2032
- Figure 8: Latin America Application Gateway Industry Revenue (Million), by Country 2024 & 2032
- Figure 9: Latin America Application Gateway Industry Revenue Share (%), by Country 2024 & 2032
- Figure 10: Middle East Application Gateway Industry Revenue (Million), by Country 2024 & 2032
- Figure 11: Middle East Application Gateway Industry Revenue Share (%), by Country 2024 & 2032
- Figure 12: North America Application Gateway Industry Revenue (Million), by Offering 2024 & 2032
- Figure 13: North America Application Gateway Industry Revenue Share (%), by Offering 2024 & 2032
- Figure 14: North America Application Gateway Industry Revenue (Million), by Organization Size 2024 & 2032
- Figure 15: North America Application Gateway Industry Revenue Share (%), by Organization Size 2024 & 2032
- Figure 16: North America Application Gateway Industry Revenue (Million), by End-user Verticals 2024 & 2032
- Figure 17: North America Application Gateway Industry Revenue Share (%), by End-user Verticals 2024 & 2032
- Figure 18: North America Application Gateway Industry Revenue (Million), by Country 2024 & 2032
- Figure 19: North America Application Gateway Industry Revenue Share (%), by Country 2024 & 2032
- Figure 20: Europe Application Gateway Industry Revenue (Million), by Offering 2024 & 2032
- Figure 21: Europe Application Gateway Industry Revenue Share (%), by Offering 2024 & 2032
- Figure 22: Europe Application Gateway Industry Revenue (Million), by Organization Size 2024 & 2032
- Figure 23: Europe Application Gateway Industry Revenue Share (%), by Organization Size 2024 & 2032
- Figure 24: Europe Application Gateway Industry Revenue (Million), by End-user Verticals 2024 & 2032
- Figure 25: Europe Application Gateway Industry Revenue Share (%), by End-user Verticals 2024 & 2032
- Figure 26: Europe Application Gateway Industry Revenue (Million), by Country 2024 & 2032
- Figure 27: Europe Application Gateway Industry Revenue Share (%), by Country 2024 & 2032
- Figure 28: Asia Pacific Application Gateway Industry Revenue (Million), by Offering 2024 & 2032
- Figure 29: Asia Pacific Application Gateway Industry Revenue Share (%), by Offering 2024 & 2032
- Figure 30: Asia Pacific Application Gateway Industry Revenue (Million), by Organization Size 2024 & 2032
- Figure 31: Asia Pacific Application Gateway Industry Revenue Share (%), by Organization Size 2024 & 2032
- Figure 32: Asia Pacific Application Gateway Industry Revenue (Million), by End-user Verticals 2024 & 2032
- Figure 33: Asia Pacific Application Gateway Industry Revenue Share (%), by End-user Verticals 2024 & 2032
- Figure 34: Asia Pacific Application Gateway Industry Revenue (Million), by Country 2024 & 2032
- Figure 35: Asia Pacific Application Gateway Industry Revenue Share (%), by Country 2024 & 2032
- Figure 36: Latin America Application Gateway Industry Revenue (Million), by Offering 2024 & 2032
- Figure 37: Latin America Application Gateway Industry Revenue Share (%), by Offering 2024 & 2032
- Figure 38: Latin America Application Gateway Industry Revenue (Million), by Organization Size 2024 & 2032
- Figure 39: Latin America Application Gateway Industry Revenue Share (%), by Organization Size 2024 & 2032
- Figure 40: Latin America Application Gateway Industry Revenue (Million), by End-user Verticals 2024 & 2032
- Figure 41: Latin America Application Gateway Industry Revenue Share (%), by End-user Verticals 2024 & 2032
- Figure 42: Latin America Application Gateway Industry Revenue (Million), by Country 2024 & 2032
- Figure 43: Latin America Application Gateway Industry Revenue Share (%), by Country 2024 & 2032
- Figure 44: Middle East Application Gateway Industry Revenue (Million), by Offering 2024 & 2032
- Figure 45: Middle East Application Gateway Industry Revenue Share (%), by Offering 2024 & 2032
- Figure 46: Middle East Application Gateway Industry Revenue (Million), by Organization Size 2024 & 2032
- Figure 47: Middle East Application Gateway Industry Revenue Share (%), by Organization Size 2024 & 2032
- Figure 48: Middle East Application Gateway Industry Revenue (Million), by End-user Verticals 2024 & 2032
- Figure 49: Middle East Application Gateway Industry Revenue Share (%), by End-user Verticals 2024 & 2032
- Figure 50: Middle East Application Gateway Industry Revenue (Million), by Country 2024 & 2032
- Figure 51: Middle East Application Gateway Industry Revenue Share (%), by Country 2024 & 2032
List of Tables
- Table 1: Global Application Gateway Industry Revenue Million Forecast, by Region 2019 & 2032
- Table 2: Global Application Gateway Industry Revenue Million Forecast, by Offering 2019 & 2032
- Table 3: Global Application Gateway Industry Revenue Million Forecast, by Organization Size 2019 & 2032
- Table 4: Global Application Gateway Industry Revenue Million Forecast, by End-user Verticals 2019 & 2032
- Table 5: Global Application Gateway Industry Revenue Million Forecast, by Region 2019 & 2032
- Table 6: Global Application Gateway Industry Revenue Million Forecast, by Country 2019 & 2032
- Table 7: Application Gateway Industry Revenue (Million) Forecast, by Application 2019 & 2032
- Table 8: Global Application Gateway Industry Revenue Million Forecast, by Country 2019 & 2032
- Table 9: Application Gateway Industry Revenue (Million) Forecast, by Application 2019 & 2032
- Table 10: Global Application Gateway Industry Revenue Million Forecast, by Country 2019 & 2032
- Table 11: Application Gateway Industry Revenue (Million) Forecast, by Application 2019 & 2032
- Table 12: Global Application Gateway Industry Revenue Million Forecast, by Country 2019 & 2032
- Table 13: Application Gateway Industry Revenue (Million) Forecast, by Application 2019 & 2032
- Table 14: Global Application Gateway Industry Revenue Million Forecast, by Country 2019 & 2032
- Table 15: Application Gateway Industry Revenue (Million) Forecast, by Application 2019 & 2032
- Table 16: Global Application Gateway Industry Revenue Million Forecast, by Offering 2019 & 2032
- Table 17: Global Application Gateway Industry Revenue Million Forecast, by Organization Size 2019 & 2032
- Table 18: Global Application Gateway Industry Revenue Million Forecast, by End-user Verticals 2019 & 2032
- Table 19: Global Application Gateway Industry Revenue Million Forecast, by Country 2019 & 2032
- Table 20: Global Application Gateway Industry Revenue Million Forecast, by Offering 2019 & 2032
- Table 21: Global Application Gateway Industry Revenue Million Forecast, by Organization Size 2019 & 2032
- Table 22: Global Application Gateway Industry Revenue Million Forecast, by End-user Verticals 2019 & 2032
- Table 23: Global Application Gateway Industry Revenue Million Forecast, by Country 2019 & 2032
- Table 24: Global Application Gateway Industry Revenue Million Forecast, by Offering 2019 & 2032
- Table 25: Global Application Gateway Industry Revenue Million Forecast, by Organization Size 2019 & 2032
- Table 26: Global Application Gateway Industry Revenue Million Forecast, by End-user Verticals 2019 & 2032
- Table 27: Global Application Gateway Industry Revenue Million Forecast, by Country 2019 & 2032
- Table 28: Global Application Gateway Industry Revenue Million Forecast, by Offering 2019 & 2032
- Table 29: Global Application Gateway Industry Revenue Million Forecast, by Organization Size 2019 & 2032
- Table 30: Global Application Gateway Industry Revenue Million Forecast, by End-user Verticals 2019 & 2032
- Table 31: Global Application Gateway Industry Revenue Million Forecast, by Country 2019 & 2032
- Table 32: Global Application Gateway Industry Revenue Million Forecast, by Offering 2019 & 2032
- Table 33: Global Application Gateway Industry Revenue Million Forecast, by Organization Size 2019 & 2032
- Table 34: Global Application Gateway Industry Revenue Million Forecast, by End-user Verticals 2019 & 2032
- Table 35: Global Application Gateway Industry Revenue Million Forecast, by Country 2019 & 2032
Frequently Asked Questions
1. What is the projected Compound Annual Growth Rate (CAGR) of the Application Gateway Industry?
The projected CAGR is approximately 9.70%.
2. Which companies are prominent players in the Application Gateway Industry?
Key companies in the market include Aculab PLC, Barracuda Networks Inc, Kemp Technologies Inc, Orange Business Services Inc, Zscaler Inc, Akamai Technolgies Inc, Avi Networks Inc, F5 Networks Inc, Imperva Inc, Microsoft Corporation, Snapt Inc, Forcepoint LLC, Palo Alto Networks Inc, Citrix Systems Inc, SAP SE.
3. What are the main segments of the Application Gateway Industry?
The market segments include Offering, Organization Size, End-user Verticals.
4. Can you provide details about the market size?
The market size is estimated to be USD XX Million as of 2022.
5. What are some drivers contributing to market growth?
; Growth in Number of Different Application Layer Attacks.
6. What are the notable trends driving market growth?
Healthcare Segment to Show Significant Growth.
7. Are there any restraints impacting market growth?
; Lack of Mandatory Regulations for Information Security.
8. Can you provide examples of recent developments in the market?
N/A
9. What pricing options are available for accessing the report?
Pricing options include single-user, multi-user, and enterprise licenses priced at USD 4750, USD 5250, and USD 8750 respectively.
10. Is the market size provided in terms of value or volume?
The market size is provided in terms of value, measured in Million.
11. Are there any specific market keywords associated with the report?
Yes, the market keyword associated with the report is "Application Gateway Industry," which aids in identifying and referencing the specific market segment covered.
12. How do I determine which pricing option suits my needs best?
The pricing options vary based on user requirements and access needs. Individual users may opt for single-user licenses, while businesses requiring broader access may choose multi-user or enterprise licenses for cost-effective access to the report.
13. Are there any additional resources or data provided in the Application Gateway Industry report?
While the report offers comprehensive insights, it's advisable to review the specific contents or supplementary materials provided to ascertain if additional resources or data are available.
14. How can I stay updated on further developments or reports in the Application Gateway Industry?
To stay informed about further developments, trends, and reports in the Application Gateway Industry, consider subscribing to industry newsletters, following relevant companies and organizations, or regularly checking reputable industry news sources and publications.
Methodology
Step 1 - Identification of Relevant Samples Size from Population Database


Step 2 - Approaches for Defining Global Market Size (Value, Volume* & Price*)

Note*: In applicable scenarios
Step 3 - Data Sources
Primary Research
- Web Analytics
- Survey Reports
- Research Institute
- Latest Research Reports
- Opinion Leaders
Secondary Research
- Annual Reports
- White Paper
- Latest Press Release
- Industry Association
- Paid Database
- Investor Presentations

Step 4 - Data Triangulation
Involves using different sources of information in order to increase the validity of a study
These sources are likely to be stakeholders in a program - participants, other researchers, program staff, other community members, and so on.
Then we put all data in single framework & apply various statistical tools to find out the dynamic on the market.
During the analysis stage, feedback from the stakeholder groups would be compared to determine areas of agreement as well as areas of divergence


