
Key Insights
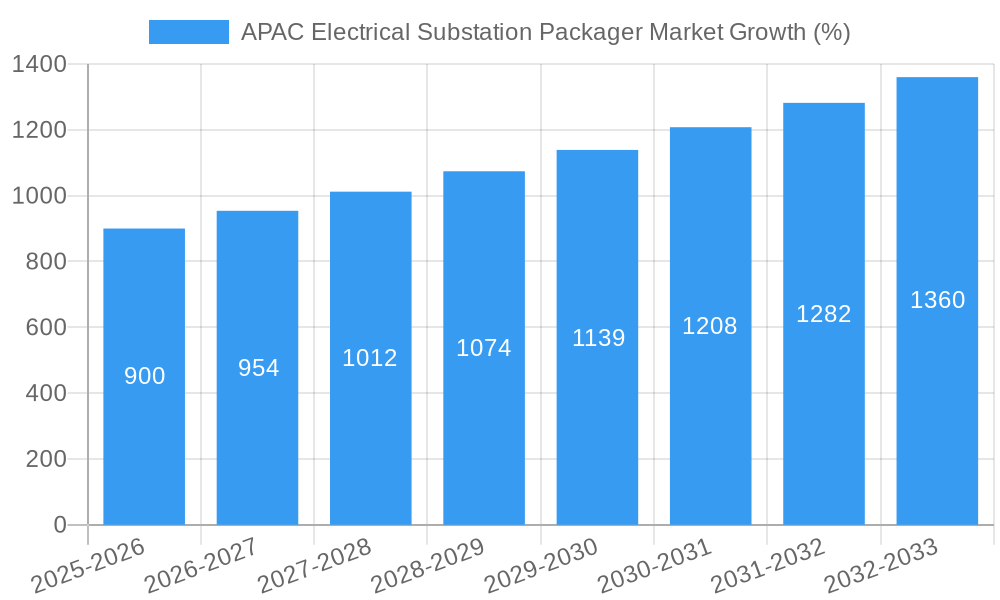
The Asia-Pacific (APAC) electrical substation packager market is experiencing robust growth, driven by the region's rapid industrialization, urbanization, and increasing electricity demand. The market's Compound Annual Growth Rate (CAGR) exceeding 6% indicates a significant expansion trajectory over the forecast period (2025-2033). Key drivers include large-scale infrastructure projects, the expansion of renewable energy sources necessitating advanced substation technologies, and rising government investments in grid modernization across countries like China, India, and Southeast Asia. Furthermore, the increasing adoption of smart grid technologies and the need for enhanced grid reliability are fueling market growth. Growth is segmented across various voltage levels (high, medium, low) and applications (industrial, power utilities, commercial, others), with the industrial and power utility sectors dominating market share due to their substantial infrastructure requirements. While challenges such as high initial investment costs and complex regulatory frameworks may pose some restraints, the long-term growth prospects remain exceptionally positive due to the region's sustained economic development and energy needs.
The market is highly competitive, with a mix of multinational corporations like ABB, Siemens, and Schneider Electric, and regional players like Kirloskar Electric and C&S Electric vying for market share. The strategic partnerships, mergers, and acquisitions observed in recent years indicate a highly dynamic market environment. The dominance of specific regional players is likely to vary based on the specific country and its energy infrastructure priorities. For instance, China's significant investments in renewable energy will likely boost demand for advanced substation packaging solutions, while India’s ongoing grid modernization efforts will present substantial opportunities. This competition fosters innovation and offers customers a wide array of solutions catering to diverse needs and budgets. Future growth hinges on continuous technological advancements in areas like digitalization, automation, and sustainability, coupled with a successful navigation of regulatory and logistical hurdles.
APAC Electrical Substation Packager Market: A Comprehensive Report (2019-2033)
This comprehensive report provides an in-depth analysis of the Asia-Pacific (APAC) Electrical Substation Packager Market, covering the period from 2019 to 2033. It delves into market dynamics, growth trends, key players, and future opportunities within this crucial segment of the broader power and energy infrastructure sector. The report offers valuable insights for industry professionals, investors, and strategic decision-makers seeking to understand and capitalize on this evolving market. The study period encompasses the historical period (2019-2024), base year (2025), and forecast period (2025-2033). Market values are presented in Million units.
APAC Electrical Substation Packager Market Market Dynamics & Structure
The APAC electrical substation packager market is characterized by a moderately concentrated landscape with several major players and numerous smaller regional companies. Technological innovation, particularly in areas like digitalization and smart grid technologies, is a primary growth driver. Stringent regulatory frameworks focused on grid modernization and renewable energy integration influence market expansion. The market experiences competition from alternative solutions for power distribution, although the inherent advantages of packaged substations often outweigh these alternatives. End-user demographics, primarily power utilities and industrial sectors, significantly shape market demand. Mergers and acquisitions (M&A) activity is notable, indicating consolidation and expansion strategies by leading players.
- Market Concentration: Moderately concentrated, with a top 5 market share of approximately xx%.
- Technological Innovation: Focus on digital substations, smart grid integration, and improved efficiency.
- Regulatory Framework: Stringent standards and regulations promoting grid modernization and renewable energy integration.
- Competitive Substitutes: Limited direct substitutes, with competition primarily from alternative power distribution methods.
- End-User Demographics: Power utilities (xx%), Industrial (xx%), Commercial (xx%), Others (xx%).
- M&A Activity: Significant activity observed in recent years, with xx major deals concluded in the past 5 years. This trend is expected to continue, driven by expansion and consolidation strategies.
APAC Electrical Substation Packager Market Growth Trends & Insights
The APAC electrical substation packager market is experiencing robust growth, driven by increasing electricity demand, large-scale infrastructure projects, and the expansion of renewable energy sources. The market size is projected to witness a Compound Annual Growth Rate (CAGR) of xx% during the forecast period (2025-2033). This growth is fueled by several factors, including government initiatives promoting grid modernization, the rising adoption of smart grid technologies, and increasing investments in renewable energy projects across the region. Technological disruptions, such as the integration of digital technologies and the development of modular substation designs, are significantly impacting market dynamics. Consumer behavior shifts toward sustainable and efficient power solutions further bolster market growth. Market penetration is expected to reach xx% by 2033, primarily driven by growth in the industrial and power utility segments.
Dominant Regions, Countries, or Segments in APAC Electrical Substation Packager Market
Within the APAC region, [Insert Dominant Country/Region Here, e.g., China or India] exhibits the highest market share and growth potential. This dominance stems from factors such as substantial investments in infrastructure development, robust economic growth, and a supportive regulatory environment that favors grid modernization and renewable energy integration. The high-voltage segment commands the largest share within the market, reflecting the significant investment in large-scale power transmission infrastructure projects. Power utilities represent the dominant end-user segment, given their crucial role in managing and expanding the electricity grid.
- Key Drivers in [Dominant Country/Region]:
- Massive investments in infrastructure development, particularly for power transmission and distribution networks.
- Government initiatives and policies promoting renewable energy integration and grid modernization.
- Rapid industrialization and urbanization leading to increased electricity demand.
- Dominant Segments:
- Voltage: High-voltage substations are predicted to maintain their dominance owing to large-scale infrastructure projects.
- Application: Power utilities dominate, driven by significant investments in grid expansion.
APAC Electrical Substation Packager Market Product Landscape
The APAC electrical substation packager market showcases a diverse product landscape. Innovations encompass modular designs, digital substations with advanced monitoring and control capabilities, and environmentally friendly solutions. These offerings cater to diverse applications, including power transmission, distribution, and industrial power supply. Key performance indicators include efficiency, reliability, and safety features. Unique selling propositions emphasize ease of installation, reduced downtime, and enhanced grid management capabilities. Technological advancements focus on automation, data analytics, and IoT integration for improved grid operations and maintenance.
Key Drivers, Barriers & Challenges in APAC Electrical Substation Packager Market
Key Drivers:
- Increasing electricity demand driven by economic growth and urbanization.
- Government investments in grid modernization and renewable energy integration.
- Advancements in digital substation technologies.
- Growing adoption of smart grid solutions.
Challenges:
- Supply chain disruptions impacting the availability of critical components. (Estimated impact: xx% reduction in production capacity in 2024).
- Regulatory complexities and bureaucratic hurdles in obtaining project approvals.
- Intense competition from both established players and new entrants.
Emerging Opportunities in APAC Electrical Substation Packager Market
- Untapped markets in rural and underserved areas.
- Growing demand for mini and micro-grid solutions.
- Increasing adoption of renewable energy sources requiring specialized substation packages.
- Opportunities in smart city initiatives requiring advanced substation technology integration.
Growth Accelerators in the APAC Electrical Substation Packager Market Industry
Long-term growth will be accelerated by strategic partnerships between technology providers and EPC contractors, enabling faster deployment of innovative solutions. Technological breakthroughs in areas like AI-powered grid management and advanced materials will improve substation efficiency and reliability. Market expansion into underserved regions and the development of new applications for packaged substations, such as microgrids, will also fuel growth.
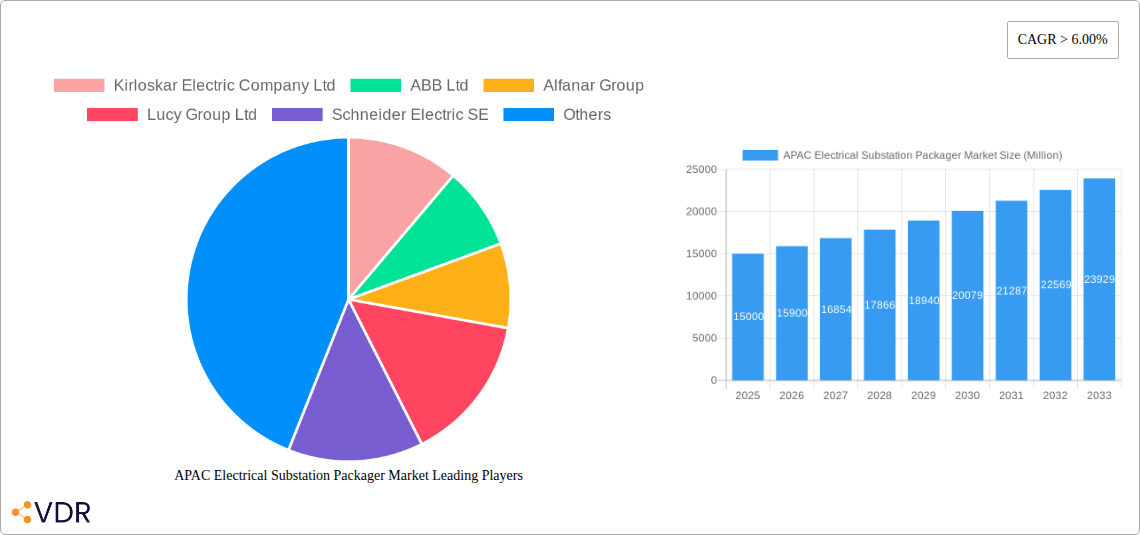
Key Players Shaping the APAC Electrical Substation Packager Market Market
- Kirloskar Electric Company Ltd
- ABB Ltd
- Alfanar Group
- Lucy Group Ltd
- Schneider Electric SE
- Eaton Corporation PLC
- LARSEN & TOUBRO LIMITED
- General Electric Company
- C&S Electric Limited
- Siemens AG *List Not Exhaustive
Notable Milestones in APAC Electrical Substation Packager Market Sector
- [Month, Year]: ABB wins a contract to supply electrical substation packages for a hydropower plant in India.
- [Month, Year]: Schneider Electric launches a new range of modular substation packages designed for urban applications.
- [Month, Year]: GE acquires a local electrical substation packager in China to expand its market presence.
In-Depth APAC Electrical Substation Packager Market Market Outlook
The APAC electrical substation packager market holds significant future potential, driven by sustained infrastructure development, expanding renewable energy capacity, and ongoing grid modernization efforts. Strategic opportunities lie in leveraging technological innovations to improve operational efficiency, enhancing grid resilience, and developing tailored solutions for specific applications. The market's long-term growth trajectory remains positive, with continued demand for reliable and efficient power solutions across the region.
APAC Electrical Substation Packager Market Segmentation
-
1. Voltage
- 1.1. High
- 1.2. Medium
- 1.3. Low
-
2. Application
- 2.1. Industrial
- 2.2. Power Utilities
- 2.3. Commercial
- 2.4. Others
-
3. Geography
- 3.1. China
- 3.2. India
- 3.3. Japan
- 3.4. Rest of Asia-Pacific
APAC Electrical Substation Packager Market Segmentation By Geography
- 1. China
- 2. India
- 3. Japan
- 4. Rest of Asia Pacific
APAC Electrical Substation Packager Market REPORT HIGHLIGHTS
| Aspects | Details |
|---|---|
| Study Period | 2019-2033 |
| Base Year | 2024 |
| Estimated Year | 2025 |
| Forecast Period | 2025-2033 |
| Historical Period | 2019-2024 |
| Growth Rate | CAGR of > 6.00% from 2019-2033 |
| Segmentation |
|
Table of Contents
- 1. Introduction
- 1.1. Research Scope
- 1.2. Market Segmentation
- 1.3. Research Methodology
- 1.4. Definitions and Assumptions
- 2. Executive Summary
- 2.1. Introduction
- 3. Market Dynamics
- 3.1. Introduction
- 3.2. Market Drivers
- 3.2.1. 4.; Growing Energy Demand4.; Renewable Energy Transition
- 3.3. Market Restrains
- 3.3.1. 4.; Phasing out of Conventional Sources of Electricity
- 3.4. Market Trends
- 3.4.1. Power Utilities Segment to Witness Significant Demand
- 4. Market Factor Analysis
- 4.1. Porters Five Forces
- 4.2. Supply/Value Chain
- 4.3. PESTEL analysis
- 4.4. Market Entropy
- 4.5. Patent/Trademark Analysis
- 5. Global APAC Electrical Substation Packager Market Analysis, Insights and Forecast, 2019-2031
- 5.1. Market Analysis, Insights and Forecast - by Voltage
- 5.1.1. High
- 5.1.2. Medium
- 5.1.3. Low
- 5.2. Market Analysis, Insights and Forecast - by Application
- 5.2.1. Industrial
- 5.2.2. Power Utilities
- 5.2.3. Commercial
- 5.2.4. Others
- 5.3. Market Analysis, Insights and Forecast - by Geography
- 5.3.1. China
- 5.3.2. India
- 5.3.3. Japan
- 5.3.4. Rest of Asia-Pacific
- 5.4. Market Analysis, Insights and Forecast - by Region
- 5.4.1. China
- 5.4.2. India
- 5.4.3. Japan
- 5.4.4. Rest of Asia Pacific
- 5.1. Market Analysis, Insights and Forecast - by Voltage
- 6. China APAC Electrical Substation Packager Market Analysis, Insights and Forecast, 2019-2031
- 6.1. Market Analysis, Insights and Forecast - by Voltage
- 6.1.1. High
- 6.1.2. Medium
- 6.1.3. Low
- 6.2. Market Analysis, Insights and Forecast - by Application
- 6.2.1. Industrial
- 6.2.2. Power Utilities
- 6.2.3. Commercial
- 6.2.4. Others
- 6.3. Market Analysis, Insights and Forecast - by Geography
- 6.3.1. China
- 6.3.2. India
- 6.3.3. Japan
- 6.3.4. Rest of Asia-Pacific
- 6.1. Market Analysis, Insights and Forecast - by Voltage
- 7. India APAC Electrical Substation Packager Market Analysis, Insights and Forecast, 2019-2031
- 7.1. Market Analysis, Insights and Forecast - by Voltage
- 7.1.1. High
- 7.1.2. Medium
- 7.1.3. Low
- 7.2. Market Analysis, Insights and Forecast - by Application
- 7.2.1. Industrial
- 7.2.2. Power Utilities
- 7.2.3. Commercial
- 7.2.4. Others
- 7.3. Market Analysis, Insights and Forecast - by Geography
- 7.3.1. China
- 7.3.2. India
- 7.3.3. Japan
- 7.3.4. Rest of Asia-Pacific
- 7.1. Market Analysis, Insights and Forecast - by Voltage
- 8. Japan APAC Electrical Substation Packager Market Analysis, Insights and Forecast, 2019-2031
- 8.1. Market Analysis, Insights and Forecast - by Voltage
- 8.1.1. High
- 8.1.2. Medium
- 8.1.3. Low
- 8.2. Market Analysis, Insights and Forecast - by Application
- 8.2.1. Industrial
- 8.2.2. Power Utilities
- 8.2.3. Commercial
- 8.2.4. Others
- 8.3. Market Analysis, Insights and Forecast - by Geography
- 8.3.1. China
- 8.3.2. India
- 8.3.3. Japan
- 8.3.4. Rest of Asia-Pacific
- 8.1. Market Analysis, Insights and Forecast - by Voltage
- 9. Rest of Asia Pacific APAC Electrical Substation Packager Market Analysis, Insights and Forecast, 2019-2031
- 9.1. Market Analysis, Insights and Forecast - by Voltage
- 9.1.1. High
- 9.1.2. Medium
- 9.1.3. Low
- 9.2. Market Analysis, Insights and Forecast - by Application
- 9.2.1. Industrial
- 9.2.2. Power Utilities
- 9.2.3. Commercial
- 9.2.4. Others
- 9.3. Market Analysis, Insights and Forecast - by Geography
- 9.3.1. China
- 9.3.2. India
- 9.3.3. Japan
- 9.3.4. Rest of Asia-Pacific
- 9.1. Market Analysis, Insights and Forecast - by Voltage
- 10. North America APAC Electrical Substation Packager Market Analysis, Insights and Forecast, 2019-2031
- 10.1. Market Analysis, Insights and Forecast - By Country/Sub-region
- 10.1.1 United States
- 10.1.2 Canada
- 10.1.3 Mexico
- 11. Europe APAC Electrical Substation Packager Market Analysis, Insights and Forecast, 2019-2031
- 11.1. Market Analysis, Insights and Forecast - By Country/Sub-region
- 11.1.1 Germany
- 11.1.2 United Kingdom
- 11.1.3 France
- 11.1.4 Spain
- 11.1.5 Italy
- 11.1.6 Spain
- 11.1.7 Belgium
- 11.1.8 Netherland
- 11.1.9 Nordics
- 11.1.10 Rest of Europe
- 12. Asia Pacific APAC Electrical Substation Packager Market Analysis, Insights and Forecast, 2019-2031
- 12.1. Market Analysis, Insights and Forecast - By Country/Sub-region
- 12.1.1 China
- 12.1.2 Japan
- 12.1.3 India
- 12.1.4 South Korea
- 12.1.5 Southeast Asia
- 12.1.6 Australia
- 12.1.7 Indonesia
- 12.1.8 Phillipes
- 12.1.9 Singapore
- 12.1.10 Thailandc
- 12.1.11 Rest of Asia Pacific
- 13. South America APAC Electrical Substation Packager Market Analysis, Insights and Forecast, 2019-2031
- 13.1. Market Analysis, Insights and Forecast - By Country/Sub-region
- 13.1.1 Brazil
- 13.1.2 Argentina
- 13.1.3 Peru
- 13.1.4 Chile
- 13.1.5 Colombia
- 13.1.6 Ecuador
- 13.1.7 Venezuela
- 13.1.8 Rest of South America
- 14. North America APAC Electrical Substation Packager Market Analysis, Insights and Forecast, 2019-2031
- 14.1. Market Analysis, Insights and Forecast - By Country/Sub-region
- 14.1.1 United States
- 14.1.2 Canada
- 14.1.3 Mexico
- 15. MEA APAC Electrical Substation Packager Market Analysis, Insights and Forecast, 2019-2031
- 15.1. Market Analysis, Insights and Forecast - By Country/Sub-region
- 15.1.1 United Arab Emirates
- 15.1.2 Saudi Arabia
- 15.1.3 South Africa
- 15.1.4 Rest of Middle East and Africa
- 16. Competitive Analysis
- 16.1. Global Market Share Analysis 2024
- 16.2. Company Profiles
- 16.2.1 Kirloskar Electric Company Ltd
- 16.2.1.1. Overview
- 16.2.1.2. Products
- 16.2.1.3. SWOT Analysis
- 16.2.1.4. Recent Developments
- 16.2.1.5. Financials (Based on Availability)
- 16.2.2 ABB Ltd
- 16.2.2.1. Overview
- 16.2.2.2. Products
- 16.2.2.3. SWOT Analysis
- 16.2.2.4. Recent Developments
- 16.2.2.5. Financials (Based on Availability)
- 16.2.3 Alfanar Group
- 16.2.3.1. Overview
- 16.2.3.2. Products
- 16.2.3.3. SWOT Analysis
- 16.2.3.4. Recent Developments
- 16.2.3.5. Financials (Based on Availability)
- 16.2.4 Lucy Group Ltd
- 16.2.4.1. Overview
- 16.2.4.2. Products
- 16.2.4.3. SWOT Analysis
- 16.2.4.4. Recent Developments
- 16.2.4.5. Financials (Based on Availability)
- 16.2.5 Schneider Electric SE
- 16.2.5.1. Overview
- 16.2.5.2. Products
- 16.2.5.3. SWOT Analysis
- 16.2.5.4. Recent Developments
- 16.2.5.5. Financials (Based on Availability)
- 16.2.6 Eaton Corporation PLC
- 16.2.6.1. Overview
- 16.2.6.2. Products
- 16.2.6.3. SWOT Analysis
- 16.2.6.4. Recent Developments
- 16.2.6.5. Financials (Based on Availability)
- 16.2.7 LARSEN & TOUBRO LIMITED
- 16.2.7.1. Overview
- 16.2.7.2. Products
- 16.2.7.3. SWOT Analysis
- 16.2.7.4. Recent Developments
- 16.2.7.5. Financials (Based on Availability)
- 16.2.8 General Electric Company
- 16.2.8.1. Overview
- 16.2.8.2. Products
- 16.2.8.3. SWOT Analysis
- 16.2.8.4. Recent Developments
- 16.2.8.5. Financials (Based on Availability)
- 16.2.9 C&S Electric Limited*List Not Exhaustive
- 16.2.9.1. Overview
- 16.2.9.2. Products
- 16.2.9.3. SWOT Analysis
- 16.2.9.4. Recent Developments
- 16.2.9.5. Financials (Based on Availability)
- 16.2.10 Siemens AG
- 16.2.10.1. Overview
- 16.2.10.2. Products
- 16.2.10.3. SWOT Analysis
- 16.2.10.4. Recent Developments
- 16.2.10.5. Financials (Based on Availability)
- 16.2.1 Kirloskar Electric Company Ltd
List of Figures
- Figure 1: Global APAC Electrical Substation Packager Market Revenue Breakdown (Million, %) by Region 2024 & 2032
- Figure 2: Global APAC Electrical Substation Packager Market Volume Breakdown (Gigawatt, %) by Region 2024 & 2032
- Figure 3: North America APAC Electrical Substation Packager Market Revenue (Million), by Country 2024 & 2032
- Figure 4: North America APAC Electrical Substation Packager Market Volume (Gigawatt), by Country 2024 & 2032
- Figure 5: North America APAC Electrical Substation Packager Market Revenue Share (%), by Country 2024 & 2032
- Figure 6: North America APAC Electrical Substation Packager Market Volume Share (%), by Country 2024 & 2032
- Figure 7: Europe APAC Electrical Substation Packager Market Revenue (Million), by Country 2024 & 2032
- Figure 8: Europe APAC Electrical Substation Packager Market Volume (Gigawatt), by Country 2024 & 2032
- Figure 9: Europe APAC Electrical Substation Packager Market Revenue Share (%), by Country 2024 & 2032
- Figure 10: Europe APAC Electrical Substation Packager Market Volume Share (%), by Country 2024 & 2032
- Figure 11: Asia Pacific APAC Electrical Substation Packager Market Revenue (Million), by Country 2024 & 2032
- Figure 12: Asia Pacific APAC Electrical Substation Packager Market Volume (Gigawatt), by Country 2024 & 2032
- Figure 13: Asia Pacific APAC Electrical Substation Packager Market Revenue Share (%), by Country 2024 & 2032
- Figure 14: Asia Pacific APAC Electrical Substation Packager Market Volume Share (%), by Country 2024 & 2032
- Figure 15: South America APAC Electrical Substation Packager Market Revenue (Million), by Country 2024 & 2032
- Figure 16: South America APAC Electrical Substation Packager Market Volume (Gigawatt), by Country 2024 & 2032
- Figure 17: South America APAC Electrical Substation Packager Market Revenue Share (%), by Country 2024 & 2032
- Figure 18: South America APAC Electrical Substation Packager Market Volume Share (%), by Country 2024 & 2032
- Figure 19: North America APAC Electrical Substation Packager Market Revenue (Million), by Country 2024 & 2032
- Figure 20: North America APAC Electrical Substation Packager Market Volume (Gigawatt), by Country 2024 & 2032
- Figure 21: North America APAC Electrical Substation Packager Market Revenue Share (%), by Country 2024 & 2032
- Figure 22: North America APAC Electrical Substation Packager Market Volume Share (%), by Country 2024 & 2032
- Figure 23: MEA APAC Electrical Substation Packager Market Revenue (Million), by Country 2024 & 2032
- Figure 24: MEA APAC Electrical Substation Packager Market Volume (Gigawatt), by Country 2024 & 2032
- Figure 25: MEA APAC Electrical Substation Packager Market Revenue Share (%), by Country 2024 & 2032
- Figure 26: MEA APAC Electrical Substation Packager Market Volume Share (%), by Country 2024 & 2032
- Figure 27: China APAC Electrical Substation Packager Market Revenue (Million), by Voltage 2024 & 2032
- Figure 28: China APAC Electrical Substation Packager Market Volume (Gigawatt), by Voltage 2024 & 2032
- Figure 29: China APAC Electrical Substation Packager Market Revenue Share (%), by Voltage 2024 & 2032
- Figure 30: China APAC Electrical Substation Packager Market Volume Share (%), by Voltage 2024 & 2032
- Figure 31: China APAC Electrical Substation Packager Market Revenue (Million), by Application 2024 & 2032
- Figure 32: China APAC Electrical Substation Packager Market Volume (Gigawatt), by Application 2024 & 2032
- Figure 33: China APAC Electrical Substation Packager Market Revenue Share (%), by Application 2024 & 2032
- Figure 34: China APAC Electrical Substation Packager Market Volume Share (%), by Application 2024 & 2032
- Figure 35: China APAC Electrical Substation Packager Market Revenue (Million), by Geography 2024 & 2032
- Figure 36: China APAC Electrical Substation Packager Market Volume (Gigawatt), by Geography 2024 & 2032
- Figure 37: China APAC Electrical Substation Packager Market Revenue Share (%), by Geography 2024 & 2032
- Figure 38: China APAC Electrical Substation Packager Market Volume Share (%), by Geography 2024 & 2032
- Figure 39: China APAC Electrical Substation Packager Market Revenue (Million), by Country 2024 & 2032
- Figure 40: China APAC Electrical Substation Packager Market Volume (Gigawatt), by Country 2024 & 2032
- Figure 41: China APAC Electrical Substation Packager Market Revenue Share (%), by Country 2024 & 2032
- Figure 42: China APAC Electrical Substation Packager Market Volume Share (%), by Country 2024 & 2032
- Figure 43: India APAC Electrical Substation Packager Market Revenue (Million), by Voltage 2024 & 2032
- Figure 44: India APAC Electrical Substation Packager Market Volume (Gigawatt), by Voltage 2024 & 2032
- Figure 45: India APAC Electrical Substation Packager Market Revenue Share (%), by Voltage 2024 & 2032
- Figure 46: India APAC Electrical Substation Packager Market Volume Share (%), by Voltage 2024 & 2032
- Figure 47: India APAC Electrical Substation Packager Market Revenue (Million), by Application 2024 & 2032
- Figure 48: India APAC Electrical Substation Packager Market Volume (Gigawatt), by Application 2024 & 2032
- Figure 49: India APAC Electrical Substation Packager Market Revenue Share (%), by Application 2024 & 2032
- Figure 50: India APAC Electrical Substation Packager Market Volume Share (%), by Application 2024 & 2032
- Figure 51: India APAC Electrical Substation Packager Market Revenue (Million), by Geography 2024 & 2032
- Figure 52: India APAC Electrical Substation Packager Market Volume (Gigawatt), by Geography 2024 & 2032
- Figure 53: India APAC Electrical Substation Packager Market Revenue Share (%), by Geography 2024 & 2032
- Figure 54: India APAC Electrical Substation Packager Market Volume Share (%), by Geography 2024 & 2032
- Figure 55: India APAC Electrical Substation Packager Market Revenue (Million), by Country 2024 & 2032
- Figure 56: India APAC Electrical Substation Packager Market Volume (Gigawatt), by Country 2024 & 2032
- Figure 57: India APAC Electrical Substation Packager Market Revenue Share (%), by Country 2024 & 2032
- Figure 58: India APAC Electrical Substation Packager Market Volume Share (%), by Country 2024 & 2032
- Figure 59: Japan APAC Electrical Substation Packager Market Revenue (Million), by Voltage 2024 & 2032
- Figure 60: Japan APAC Electrical Substation Packager Market Volume (Gigawatt), by Voltage 2024 & 2032
- Figure 61: Japan APAC Electrical Substation Packager Market Revenue Share (%), by Voltage 2024 & 2032
- Figure 62: Japan APAC Electrical Substation Packager Market Volume Share (%), by Voltage 2024 & 2032
- Figure 63: Japan APAC Electrical Substation Packager Market Revenue (Million), by Application 2024 & 2032
- Figure 64: Japan APAC Electrical Substation Packager Market Volume (Gigawatt), by Application 2024 & 2032
- Figure 65: Japan APAC Electrical Substation Packager Market Revenue Share (%), by Application 2024 & 2032
- Figure 66: Japan APAC Electrical Substation Packager Market Volume Share (%), by Application 2024 & 2032
- Figure 67: Japan APAC Electrical Substation Packager Market Revenue (Million), by Geography 2024 & 2032
- Figure 68: Japan APAC Electrical Substation Packager Market Volume (Gigawatt), by Geography 2024 & 2032
- Figure 69: Japan APAC Electrical Substation Packager Market Revenue Share (%), by Geography 2024 & 2032
- Figure 70: Japan APAC Electrical Substation Packager Market Volume Share (%), by Geography 2024 & 2032
- Figure 71: Japan APAC Electrical Substation Packager Market Revenue (Million), by Country 2024 & 2032
- Figure 72: Japan APAC Electrical Substation Packager Market Volume (Gigawatt), by Country 2024 & 2032
- Figure 73: Japan APAC Electrical Substation Packager Market Revenue Share (%), by Country 2024 & 2032
- Figure 74: Japan APAC Electrical Substation Packager Market Volume Share (%), by Country 2024 & 2032
- Figure 75: Rest of Asia Pacific APAC Electrical Substation Packager Market Revenue (Million), by Voltage 2024 & 2032
- Figure 76: Rest of Asia Pacific APAC Electrical Substation Packager Market Volume (Gigawatt), by Voltage 2024 & 2032
- Figure 77: Rest of Asia Pacific APAC Electrical Substation Packager Market Revenue Share (%), by Voltage 2024 & 2032
- Figure 78: Rest of Asia Pacific APAC Electrical Substation Packager Market Volume Share (%), by Voltage 2024 & 2032
- Figure 79: Rest of Asia Pacific APAC Electrical Substation Packager Market Revenue (Million), by Application 2024 & 2032
- Figure 80: Rest of Asia Pacific APAC Electrical Substation Packager Market Volume (Gigawatt), by Application 2024 & 2032
- Figure 81: Rest of Asia Pacific APAC Electrical Substation Packager Market Revenue Share (%), by Application 2024 & 2032
- Figure 82: Rest of Asia Pacific APAC Electrical Substation Packager Market Volume Share (%), by Application 2024 & 2032
- Figure 83: Rest of Asia Pacific APAC Electrical Substation Packager Market Revenue (Million), by Geography 2024 & 2032
- Figure 84: Rest of Asia Pacific APAC Electrical Substation Packager Market Volume (Gigawatt), by Geography 2024 & 2032
- Figure 85: Rest of Asia Pacific APAC Electrical Substation Packager Market Revenue Share (%), by Geography 2024 & 2032
- Figure 86: Rest of Asia Pacific APAC Electrical Substation Packager Market Volume Share (%), by Geography 2024 & 2032
- Figure 87: Rest of Asia Pacific APAC Electrical Substation Packager Market Revenue (Million), by Country 2024 & 2032
- Figure 88: Rest of Asia Pacific APAC Electrical Substation Packager Market Volume (Gigawatt), by Country 2024 & 2032
- Figure 89: Rest of Asia Pacific APAC Electrical Substation Packager Market Revenue Share (%), by Country 2024 & 2032
- Figure 90: Rest of Asia Pacific APAC Electrical Substation Packager Market Volume Share (%), by Country 2024 & 2032
List of Tables
- Table 1: Global APAC Electrical Substation Packager Market Revenue Million Forecast, by Region 2019 & 2032
- Table 2: Global APAC Electrical Substation Packager Market Volume Gigawatt Forecast, by Region 2019 & 2032
- Table 3: Global APAC Electrical Substation Packager Market Revenue Million Forecast, by Voltage 2019 & 2032
- Table 4: Global APAC Electrical Substation Packager Market Volume Gigawatt Forecast, by Voltage 2019 & 2032
- Table 5: Global APAC Electrical Substation Packager Market Revenue Million Forecast, by Application 2019 & 2032
- Table 6: Global APAC Electrical Substation Packager Market Volume Gigawatt Forecast, by Application 2019 & 2032
- Table 7: Global APAC Electrical Substation Packager Market Revenue Million Forecast, by Geography 2019 & 2032
- Table 8: Global APAC Electrical Substation Packager Market Volume Gigawatt Forecast, by Geography 2019 & 2032
- Table 9: Global APAC Electrical Substation Packager Market Revenue Million Forecast, by Region 2019 & 2032
- Table 10: Global APAC Electrical Substation Packager Market Volume Gigawatt Forecast, by Region 2019 & 2032
- Table 11: Global APAC Electrical Substation Packager Market Revenue Million Forecast, by Country 2019 & 2032
- Table 12: Global APAC Electrical Substation Packager Market Volume Gigawatt Forecast, by Country 2019 & 2032
- Table 13: United States APAC Electrical Substation Packager Market Revenue (Million) Forecast, by Application 2019 & 2032
- Table 14: United States APAC Electrical Substation Packager Market Volume (Gigawatt) Forecast, by Application 2019 & 2032
- Table 15: Canada APAC Electrical Substation Packager Market Revenue (Million) Forecast, by Application 2019 & 2032
- Table 16: Canada APAC Electrical Substation Packager Market Volume (Gigawatt) Forecast, by Application 2019 & 2032
- Table 17: Mexico APAC Electrical Substation Packager Market Revenue (Million) Forecast, by Application 2019 & 2032
- Table 18: Mexico APAC Electrical Substation Packager Market Volume (Gigawatt) Forecast, by Application 2019 & 2032
- Table 19: Global APAC Electrical Substation Packager Market Revenue Million Forecast, by Country 2019 & 2032
- Table 20: Global APAC Electrical Substation Packager Market Volume Gigawatt Forecast, by Country 2019 & 2032
- Table 21: Germany APAC Electrical Substation Packager Market Revenue (Million) Forecast, by Application 2019 & 2032
- Table 22: Germany APAC Electrical Substation Packager Market Volume (Gigawatt) Forecast, by Application 2019 & 2032
- Table 23: United Kingdom APAC Electrical Substation Packager Market Revenue (Million) Forecast, by Application 2019 & 2032
- Table 24: United Kingdom APAC Electrical Substation Packager Market Volume (Gigawatt) Forecast, by Application 2019 & 2032
- Table 25: France APAC Electrical Substation Packager Market Revenue (Million) Forecast, by Application 2019 & 2032
- Table 26: France APAC Electrical Substation Packager Market Volume (Gigawatt) Forecast, by Application 2019 & 2032
- Table 27: Spain APAC Electrical Substation Packager Market Revenue (Million) Forecast, by Application 2019 & 2032
- Table 28: Spain APAC Electrical Substation Packager Market Volume (Gigawatt) Forecast, by Application 2019 & 2032
- Table 29: Italy APAC Electrical Substation Packager Market Revenue (Million) Forecast, by Application 2019 & 2032
- Table 30: Italy APAC Electrical Substation Packager Market Volume (Gigawatt) Forecast, by Application 2019 & 2032
- Table 31: Spain APAC Electrical Substation Packager Market Revenue (Million) Forecast, by Application 2019 & 2032
- Table 32: Spain APAC Electrical Substation Packager Market Volume (Gigawatt) Forecast, by Application 2019 & 2032
- Table 33: Belgium APAC Electrical Substation Packager Market Revenue (Million) Forecast, by Application 2019 & 2032
- Table 34: Belgium APAC Electrical Substation Packager Market Volume (Gigawatt) Forecast, by Application 2019 & 2032
- Table 35: Netherland APAC Electrical Substation Packager Market Revenue (Million) Forecast, by Application 2019 & 2032
- Table 36: Netherland APAC Electrical Substation Packager Market Volume (Gigawatt) Forecast, by Application 2019 & 2032
- Table 37: Nordics APAC Electrical Substation Packager Market Revenue (Million) Forecast, by Application 2019 & 2032
- Table 38: Nordics APAC Electrical Substation Packager Market Volume (Gigawatt) Forecast, by Application 2019 & 2032
- Table 39: Rest of Europe APAC Electrical Substation Packager Market Revenue (Million) Forecast, by Application 2019 & 2032
- Table 40: Rest of Europe APAC Electrical Substation Packager Market Volume (Gigawatt) Forecast, by Application 2019 & 2032
- Table 41: Global APAC Electrical Substation Packager Market Revenue Million Forecast, by Country 2019 & 2032
- Table 42: Global APAC Electrical Substation Packager Market Volume Gigawatt Forecast, by Country 2019 & 2032
- Table 43: China APAC Electrical Substation Packager Market Revenue (Million) Forecast, by Application 2019 & 2032
- Table 44: China APAC Electrical Substation Packager Market Volume (Gigawatt) Forecast, by Application 2019 & 2032
- Table 45: Japan APAC Electrical Substation Packager Market Revenue (Million) Forecast, by Application 2019 & 2032
- Table 46: Japan APAC Electrical Substation Packager Market Volume (Gigawatt) Forecast, by Application 2019 & 2032
- Table 47: India APAC Electrical Substation Packager Market Revenue (Million) Forecast, by Application 2019 & 2032
- Table 48: India APAC Electrical Substation Packager Market Volume (Gigawatt) Forecast, by Application 2019 & 2032
- Table 49: South Korea APAC Electrical Substation Packager Market Revenue (Million) Forecast, by Application 2019 & 2032
- Table 50: South Korea APAC Electrical Substation Packager Market Volume (Gigawatt) Forecast, by Application 2019 & 2032
- Table 51: Southeast Asia APAC Electrical Substation Packager Market Revenue (Million) Forecast, by Application 2019 & 2032
- Table 52: Southeast Asia APAC Electrical Substation Packager Market Volume (Gigawatt) Forecast, by Application 2019 & 2032
- Table 53: Australia APAC Electrical Substation Packager Market Revenue (Million) Forecast, by Application 2019 & 2032
- Table 54: Australia APAC Electrical Substation Packager Market Volume (Gigawatt) Forecast, by Application 2019 & 2032
- Table 55: Indonesia APAC Electrical Substation Packager Market Revenue (Million) Forecast, by Application 2019 & 2032
- Table 56: Indonesia APAC Electrical Substation Packager Market Volume (Gigawatt) Forecast, by Application 2019 & 2032
- Table 57: Phillipes APAC Electrical Substation Packager Market Revenue (Million) Forecast, by Application 2019 & 2032
- Table 58: Phillipes APAC Electrical Substation Packager Market Volume (Gigawatt) Forecast, by Application 2019 & 2032
- Table 59: Singapore APAC Electrical Substation Packager Market Revenue (Million) Forecast, by Application 2019 & 2032
- Table 60: Singapore APAC Electrical Substation Packager Market Volume (Gigawatt) Forecast, by Application 2019 & 2032
- Table 61: Thailandc APAC Electrical Substation Packager Market Revenue (Million) Forecast, by Application 2019 & 2032
- Table 62: Thailandc APAC Electrical Substation Packager Market Volume (Gigawatt) Forecast, by Application 2019 & 2032
- Table 63: Rest of Asia Pacific APAC Electrical Substation Packager Market Revenue (Million) Forecast, by Application 2019 & 2032
- Table 64: Rest of Asia Pacific APAC Electrical Substation Packager Market Volume (Gigawatt) Forecast, by Application 2019 & 2032
- Table 65: Global APAC Electrical Substation Packager Market Revenue Million Forecast, by Country 2019 & 2032
- Table 66: Global APAC Electrical Substation Packager Market Volume Gigawatt Forecast, by Country 2019 & 2032
- Table 67: Brazil APAC Electrical Substation Packager Market Revenue (Million) Forecast, by Application 2019 & 2032
- Table 68: Brazil APAC Electrical Substation Packager Market Volume (Gigawatt) Forecast, by Application 2019 & 2032
- Table 69: Argentina APAC Electrical Substation Packager Market Revenue (Million) Forecast, by Application 2019 & 2032
- Table 70: Argentina APAC Electrical Substation Packager Market Volume (Gigawatt) Forecast, by Application 2019 & 2032
- Table 71: Peru APAC Electrical Substation Packager Market Revenue (Million) Forecast, by Application 2019 & 2032
- Table 72: Peru APAC Electrical Substation Packager Market Volume (Gigawatt) Forecast, by Application 2019 & 2032
- Table 73: Chile APAC Electrical Substation Packager Market Revenue (Million) Forecast, by Application 2019 & 2032
- Table 74: Chile APAC Electrical Substation Packager Market Volume (Gigawatt) Forecast, by Application 2019 & 2032
- Table 75: Colombia APAC Electrical Substation Packager Market Revenue (Million) Forecast, by Application 2019 & 2032
- Table 76: Colombia APAC Electrical Substation Packager Market Volume (Gigawatt) Forecast, by Application 2019 & 2032
- Table 77: Ecuador APAC Electrical Substation Packager Market Revenue (Million) Forecast, by Application 2019 & 2032
- Table 78: Ecuador APAC Electrical Substation Packager Market Volume (Gigawatt) Forecast, by Application 2019 & 2032
- Table 79: Venezuela APAC Electrical Substation Packager Market Revenue (Million) Forecast, by Application 2019 & 2032
- Table 80: Venezuela APAC Electrical Substation Packager Market Volume (Gigawatt) Forecast, by Application 2019 & 2032
- Table 81: Rest of South America APAC Electrical Substation Packager Market Revenue (Million) Forecast, by Application 2019 & 2032
- Table 82: Rest of South America APAC Electrical Substation Packager Market Volume (Gigawatt) Forecast, by Application 2019 & 2032
- Table 83: Global APAC Electrical Substation Packager Market Revenue Million Forecast, by Country 2019 & 2032
- Table 84: Global APAC Electrical Substation Packager Market Volume Gigawatt Forecast, by Country 2019 & 2032
- Table 85: United States APAC Electrical Substation Packager Market Revenue (Million) Forecast, by Application 2019 & 2032
- Table 86: United States APAC Electrical Substation Packager Market Volume (Gigawatt) Forecast, by Application 2019 & 2032
- Table 87: Canada APAC Electrical Substation Packager Market Revenue (Million) Forecast, by Application 2019 & 2032
- Table 88: Canada APAC Electrical Substation Packager Market Volume (Gigawatt) Forecast, by Application 2019 & 2032
- Table 89: Mexico APAC Electrical Substation Packager Market Revenue (Million) Forecast, by Application 2019 & 2032
- Table 90: Mexico APAC Electrical Substation Packager Market Volume (Gigawatt) Forecast, by Application 2019 & 2032
- Table 91: Global APAC Electrical Substation Packager Market Revenue Million Forecast, by Country 2019 & 2032
- Table 92: Global APAC Electrical Substation Packager Market Volume Gigawatt Forecast, by Country 2019 & 2032
- Table 93: United Arab Emirates APAC Electrical Substation Packager Market Revenue (Million) Forecast, by Application 2019 & 2032
- Table 94: United Arab Emirates APAC Electrical Substation Packager Market Volume (Gigawatt) Forecast, by Application 2019 & 2032
- Table 95: Saudi Arabia APAC Electrical Substation Packager Market Revenue (Million) Forecast, by Application 2019 & 2032
- Table 96: Saudi Arabia APAC Electrical Substation Packager Market Volume (Gigawatt) Forecast, by Application 2019 & 2032
- Table 97: South Africa APAC Electrical Substation Packager Market Revenue (Million) Forecast, by Application 2019 & 2032
- Table 98: South Africa APAC Electrical Substation Packager Market Volume (Gigawatt) Forecast, by Application 2019 & 2032
- Table 99: Rest of Middle East and Africa APAC Electrical Substation Packager Market Revenue (Million) Forecast, by Application 2019 & 2032
- Table 100: Rest of Middle East and Africa APAC Electrical Substation Packager Market Volume (Gigawatt) Forecast, by Application 2019 & 2032
- Table 101: Global APAC Electrical Substation Packager Market Revenue Million Forecast, by Voltage 2019 & 2032
- Table 102: Global APAC Electrical Substation Packager Market Volume Gigawatt Forecast, by Voltage 2019 & 2032
- Table 103: Global APAC Electrical Substation Packager Market Revenue Million Forecast, by Application 2019 & 2032
- Table 104: Global APAC Electrical Substation Packager Market Volume Gigawatt Forecast, by Application 2019 & 2032
- Table 105: Global APAC Electrical Substation Packager Market Revenue Million Forecast, by Geography 2019 & 2032
- Table 106: Global APAC Electrical Substation Packager Market Volume Gigawatt Forecast, by Geography 2019 & 2032
- Table 107: Global APAC Electrical Substation Packager Market Revenue Million Forecast, by Country 2019 & 2032
- Table 108: Global APAC Electrical Substation Packager Market Volume Gigawatt Forecast, by Country 2019 & 2032
- Table 109: Global APAC Electrical Substation Packager Market Revenue Million Forecast, by Voltage 2019 & 2032
- Table 110: Global APAC Electrical Substation Packager Market Volume Gigawatt Forecast, by Voltage 2019 & 2032
- Table 111: Global APAC Electrical Substation Packager Market Revenue Million Forecast, by Application 2019 & 2032
- Table 112: Global APAC Electrical Substation Packager Market Volume Gigawatt Forecast, by Application 2019 & 2032
- Table 113: Global APAC Electrical Substation Packager Market Revenue Million Forecast, by Geography 2019 & 2032
- Table 114: Global APAC Electrical Substation Packager Market Volume Gigawatt Forecast, by Geography 2019 & 2032
- Table 115: Global APAC Electrical Substation Packager Market Revenue Million Forecast, by Country 2019 & 2032
- Table 116: Global APAC Electrical Substation Packager Market Volume Gigawatt Forecast, by Country 2019 & 2032
- Table 117: Global APAC Electrical Substation Packager Market Revenue Million Forecast, by Voltage 2019 & 2032
- Table 118: Global APAC Electrical Substation Packager Market Volume Gigawatt Forecast, by Voltage 2019 & 2032
- Table 119: Global APAC Electrical Substation Packager Market Revenue Million Forecast, by Application 2019 & 2032
- Table 120: Global APAC Electrical Substation Packager Market Volume Gigawatt Forecast, by Application 2019 & 2032
- Table 121: Global APAC Electrical Substation Packager Market Revenue Million Forecast, by Geography 2019 & 2032
- Table 122: Global APAC Electrical Substation Packager Market Volume Gigawatt Forecast, by Geography 2019 & 2032
- Table 123: Global APAC Electrical Substation Packager Market Revenue Million Forecast, by Country 2019 & 2032
- Table 124: Global APAC Electrical Substation Packager Market Volume Gigawatt Forecast, by Country 2019 & 2032
- Table 125: Global APAC Electrical Substation Packager Market Revenue Million Forecast, by Voltage 2019 & 2032
- Table 126: Global APAC Electrical Substation Packager Market Volume Gigawatt Forecast, by Voltage 2019 & 2032
- Table 127: Global APAC Electrical Substation Packager Market Revenue Million Forecast, by Application 2019 & 2032
- Table 128: Global APAC Electrical Substation Packager Market Volume Gigawatt Forecast, by Application 2019 & 2032
- Table 129: Global APAC Electrical Substation Packager Market Revenue Million Forecast, by Geography 2019 & 2032
- Table 130: Global APAC Electrical Substation Packager Market Volume Gigawatt Forecast, by Geography 2019 & 2032
- Table 131: Global APAC Electrical Substation Packager Market Revenue Million Forecast, by Country 2019 & 2032
- Table 132: Global APAC Electrical Substation Packager Market Volume Gigawatt Forecast, by Country 2019 & 2032
Frequently Asked Questions
1. What is the projected Compound Annual Growth Rate (CAGR) of the APAC Electrical Substation Packager Market?
The projected CAGR is approximately > 6.00%.
2. Which companies are prominent players in the APAC Electrical Substation Packager Market?
Key companies in the market include Kirloskar Electric Company Ltd, ABB Ltd, Alfanar Group, Lucy Group Ltd, Schneider Electric SE, Eaton Corporation PLC, LARSEN & TOUBRO LIMITED, General Electric Company, C&S Electric Limited*List Not Exhaustive, Siemens AG.
3. What are the main segments of the APAC Electrical Substation Packager Market?
The market segments include Voltage, Application, Geography.
4. Can you provide details about the market size?
The market size is estimated to be USD XX Million as of 2022.
5. What are some drivers contributing to market growth?
4.; Growing Energy Demand4.; Renewable Energy Transition.
6. What are the notable trends driving market growth?
Power Utilities Segment to Witness Significant Demand.
7. Are there any restraints impacting market growth?
4.; Phasing out of Conventional Sources of Electricity.
8. Can you provide examples of recent developments in the market?
ABB wins a contract to supply electrical substation packages for a hydropower plant in India.
9. What pricing options are available for accessing the report?
Pricing options include single-user, multi-user, and enterprise licenses priced at USD 4750, USD 5250, and USD 8750 respectively.
10. Is the market size provided in terms of value or volume?
The market size is provided in terms of value, measured in Million and volume, measured in Gigawatt.
11. Are there any specific market keywords associated with the report?
Yes, the market keyword associated with the report is "APAC Electrical Substation Packager Market," which aids in identifying and referencing the specific market segment covered.
12. How do I determine which pricing option suits my needs best?
The pricing options vary based on user requirements and access needs. Individual users may opt for single-user licenses, while businesses requiring broader access may choose multi-user or enterprise licenses for cost-effective access to the report.
13. Are there any additional resources or data provided in the APAC Electrical Substation Packager Market report?
While the report offers comprehensive insights, it's advisable to review the specific contents or supplementary materials provided to ascertain if additional resources or data are available.
14. How can I stay updated on further developments or reports in the APAC Electrical Substation Packager Market?
To stay informed about further developments, trends, and reports in the APAC Electrical Substation Packager Market, consider subscribing to industry newsletters, following relevant companies and organizations, or regularly checking reputable industry news sources and publications.
Methodology
Step 1 - Identification of Relevant Samples Size from Population Database


Step 2 - Approaches for Defining Global Market Size (Value, Volume* & Price*)

Note*: In applicable scenarios
Step 3 - Data Sources
Primary Research
- Web Analytics
- Survey Reports
- Research Institute
- Latest Research Reports
- Opinion Leaders
Secondary Research
- Annual Reports
- White Paper
- Latest Press Release
- Industry Association
- Paid Database
- Investor Presentations

Step 4 - Data Triangulation
Involves using different sources of information in order to increase the validity of a study
These sources are likely to be stakeholders in a program - participants, other researchers, program staff, other community members, and so on.
Then we put all data in single framework & apply various statistical tools to find out the dynamic on the market.
During the analysis stage, feedback from the stakeholder groups would be compared to determine areas of agreement as well as areas of divergence


