
Key Insights
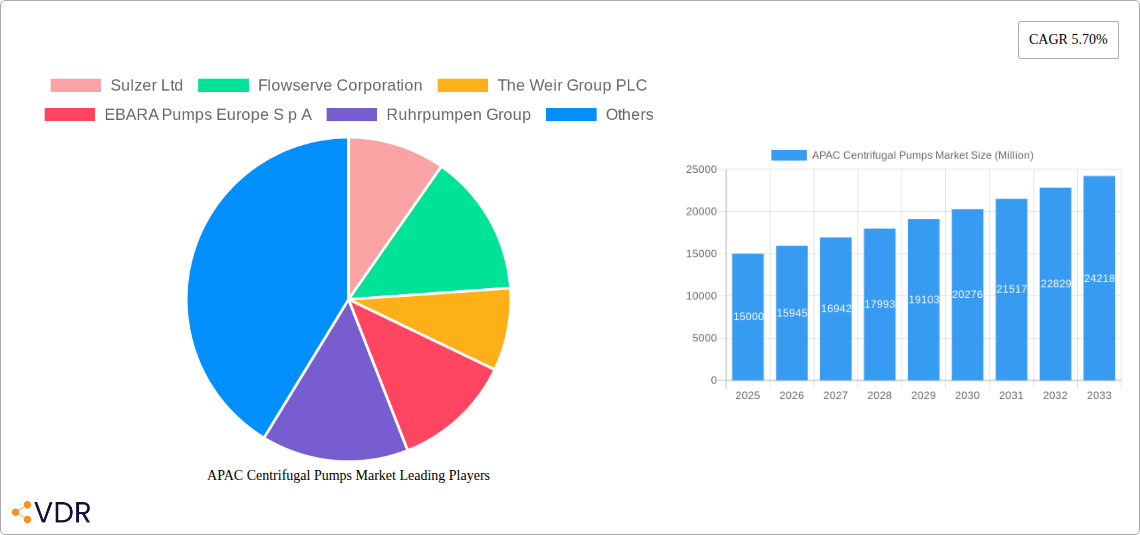
The Asia-Pacific (APAC) centrifugal pumps market is experiencing robust growth, driven by burgeoning industrialization, infrastructure development, and rising demand across diverse sectors. The market's Compound Annual Growth Rate (CAGR) of 5.70% from 2019-2033 indicates a significant expansion, with projected market values exceeding initial estimations. Key drivers include the booming oil & gas, chemical, and power sectors within the region, necessitating efficient and reliable fluid transfer solutions. Furthermore, increasing urbanization and the consequent need for advanced water and wastewater management systems are significantly contributing to market expansion. The preference for energy-efficient centrifugal pumps, along with technological advancements like smart pumps with predictive maintenance capabilities, is shaping market trends. While regulatory changes related to environmental compliance might present some restraints, the overall market outlook remains positive, fueled by consistent infrastructural investment and industrial expansion across APAC countries like China, India, and South Korea. Segmentation reveals significant demand for multi-stage pumps in heavy industries and axial pumps in applications requiring high flow rates. Major players like Sulzer, Flowserve, and Xylem are strategically investing in regional manufacturing and distribution networks to cater to the growing demand and enhance their market positioning within this dynamic landscape.
Growth in specific APAC sub-regions will vary. Given the overall CAGR of 5.7%, and considering China and India as major contributors, we can anticipate stronger growth in these countries compared to others in the region. The presence of established industrial bases and ongoing large-scale infrastructure projects in these nations will translate to higher demand. However, other APAC nations will also see positive growth albeit potentially at a slightly lower rate, driven by factors like industrial development, urbanization and government initiatives promoting infrastructure modernization. The market segmentation by end-user industry and pump type reflects the diverse applications of centrifugal pumps, highlighting the need for manufacturers to offer tailored solutions that address specific industry requirements and operational needs. This specialization will be crucial for sustained success within the competitive APAC centrifugal pumps market.
APAC Centrifugal Pumps Market: A Comprehensive Report (2019-2033)
This in-depth report provides a comprehensive analysis of the APAC centrifugal pumps market, encompassing market dynamics, growth trends, regional dominance, product landscape, key players, and future outlook. The report covers the period from 2019 to 2033, with a focus on the base year 2025 and forecast period 2025-2033. The market is segmented by end-user industry (Oil & Gas, Chemicals, Food & Beverages, Water & Wastewater, Pharma, Power, Construction, Metal & Mining), flow type (Axial, Radial, Mixed), and number of stages (Single Stage, Multi Stage). This report is essential for industry professionals, investors, and anyone seeking to understand this dynamic market. The total market size in 2025 is estimated at xx Million units.
APAC Centrifugal Pumps Market Dynamics & Structure
The APAC centrifugal pumps market is characterized by a moderately concentrated landscape, with several major players holding significant market share. Technological innovation, driven by increasing demand for energy efficiency and process optimization, is a key driver. Stringent environmental regulations and the growing focus on sustainability further influence market dynamics. Competitive product substitutes, such as positive displacement pumps, present challenges, while mergers and acquisitions (M&A) activity consolidates market positions. The market witnessed xx M&A deals in the historical period (2019-2024).
- Market Concentration: Moderately concentrated, with top 10 players holding approximately xx% market share in 2025.
- Technological Innovation: Focus on energy efficiency, smart pumps, and advanced materials.
- Regulatory Frameworks: Stringent environmental regulations impacting design and material selection.
- Competitive Substitutes: Positive displacement pumps, diaphragm pumps offer alternative solutions.
- End-User Demographics: Growing industrialization and urbanization fueling demand across various sectors.
- M&A Trends: Consolidation expected to continue, driving strategic partnerships and market expansion.
APAC Centrifugal Pumps Market Growth Trends & Insights
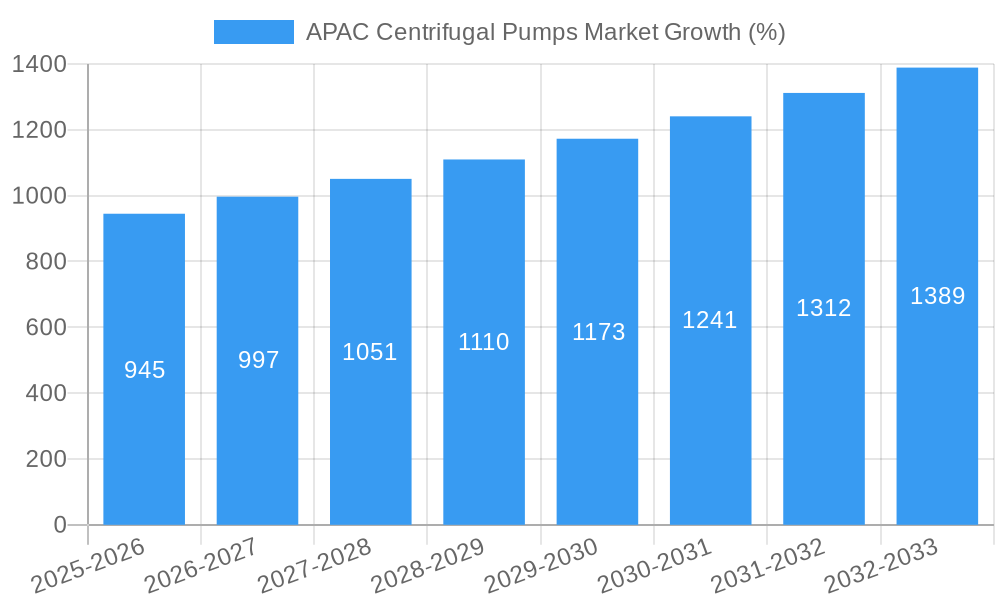
The APAC centrifugal pumps market experienced significant growth during the historical period (2019-2024), with a Compound Annual Growth Rate (CAGR) of xx%. This growth is driven by robust industrial expansion, particularly in sectors such as Oil & Gas, Chemicals, and Water & Wastewater. Technological advancements, including the adoption of smart pumps and IoT-enabled solutions, are accelerating market adoption rates. Changing consumer behaviors, favoring sustainable and efficient solutions, further contribute to market growth. The market penetration of energy-efficient centrifugal pumps is expected to reach xx% by 2033. The projected market size for 2033 is xx Million units, indicating a CAGR of xx% during the forecast period.
Dominant Regions, Countries, or Segments in APAC Centrifugal Pumps Market
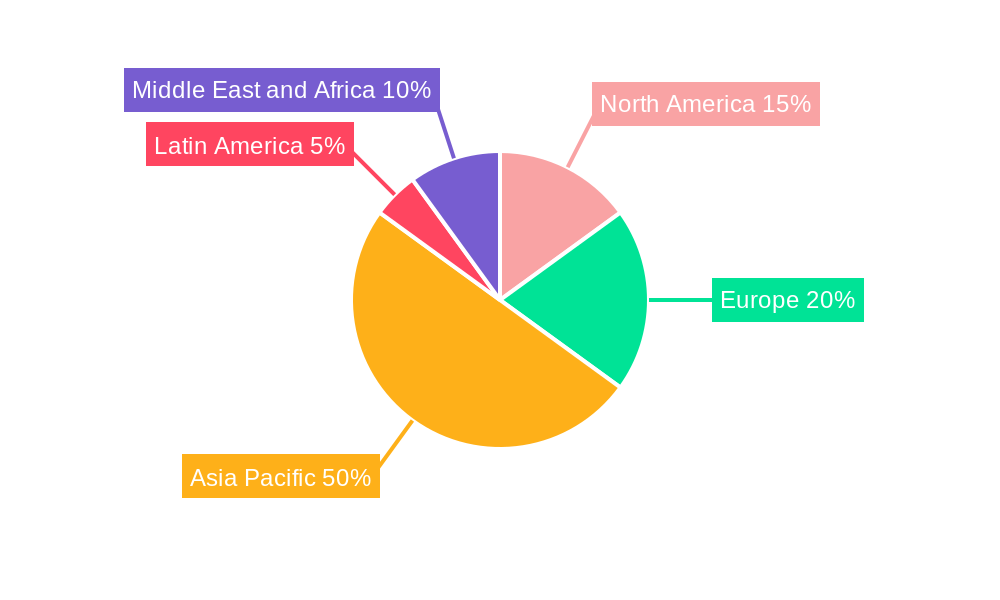
China and India are currently the dominant markets within the APAC region, driven by rapid industrialization and infrastructure development. The Oil & Gas sector remains a key driver, followed by the Chemicals and Water & Wastewater sectors. Radial flow pumps dominate the market by flow type, owing to their versatility and suitability for a wide range of applications. Multi-stage pumps are preferred in high-pressure applications.
- Key Drivers:
- China & India: Rapid industrialization, infrastructure development, and rising energy demand.
- Oil & Gas: High demand for efficient and reliable pumps in upstream and downstream operations.
- Chemicals: Stringent process requirements and the need for high-performance pumps.
- Water & Wastewater: Growing investments in water treatment and infrastructure projects.
- Dominance Factors: Strong industrial base, government support for infrastructure development, and growing investment in energy-efficient technologies.
APAP Centrifugal Pumps Market Product Landscape
The APAC centrifugal pumps market offers a diverse range of products, including single-stage and multi-stage pumps, axial, radial, and mixed flow pumps, catering to various applications and pressure requirements. Recent innovations focus on improving energy efficiency, reducing noise levels, and enhancing reliability. Key features include advanced materials, improved sealing technologies, and smart control systems. The modular design of pumps, such as the third-generation REDA HPS multistage centrifugal pump, allows for customization and cost-effectiveness.
Key Drivers, Barriers & Challenges in APAC Centrifugal Pumps Market
Key Drivers: Growing industrialization, urbanization, and infrastructure development in APAC are major drivers. Increased demand for efficient water and wastewater management systems and rising energy costs are also contributing to market growth. Government initiatives to promote energy efficiency are creating favorable conditions for growth.
Key Challenges: Fluctuations in raw material prices, supply chain disruptions, and intense competition from both domestic and international players pose significant challenges. Stringent environmental regulations and increasing labor costs can also affect profitability. The market faces challenges related to maintenance costs and the need for skilled labor.
Emerging Opportunities in APAC Centrifugal Pumps Market
Emerging opportunities lie in the adoption of smart pumps with advanced monitoring capabilities, the growing demand for high-efficiency pumps in various sectors such as renewable energy and the development of customized solutions for niche applications. The increasing focus on sustainability and environmental regulations will drive demand for energy-efficient and eco-friendly pumps. Untapped markets in smaller cities and rural areas present significant growth potential.
Growth Accelerators in the APAC Centrifugal Pumps Market Industry
Technological advancements, such as the development of smart pumps and IoT-enabled solutions, are crucial growth accelerators. Strategic partnerships between pump manufacturers and end-users are enhancing collaboration and fostering innovation. Market expansion strategies, including geographic diversification and product diversification, will help companies to capitalize on emerging opportunities and consolidate their market positions.
Key Players Shaping the APAC Centrifugal Pumps Market Market
- Sulzer Ltd
- Flowserve Corporation
- The Weir Group PLC
- EBARA Pumps Europe S p A
- Ruhrpumpen Group
- Xylem
- KSB SE & Co
- Dover Corporation
- Baker Hughes Company
- Schlumberger Limited
Notable Milestones in APAC Centrifugal Pumps Market Sector
- November 2021: Launch of the third-generation REDA HPS multistage centrifugal pump, offering a cost-effective and efficient solution for various applications.
- April 2021: Successful impeller upgrade for ten amine pumps in Malaysia, resulting in significant vibration reduction and improved performance.
In-Depth APAC Centrifugal Pumps Market Market Outlook
The APAC centrifugal pumps market is poised for sustained growth driven by ongoing industrialization, urbanization, and investments in infrastructure. The increasing demand for energy-efficient and sustainable solutions, coupled with technological advancements, will shape future market dynamics. Strategic partnerships and collaborations will play a key role in driving innovation and market expansion. The market presents significant opportunities for companies to capitalize on the growing demand for reliable and high-performance centrifugal pumps across diverse end-user industries.
APAC Centrifugal Pumps Market Segmentation
-
1. Flow Type
- 1.1. Axial
- 1.2. Radial
- 1.3. Mixed
-
2. Number of Stages
- 2.1. Single Stage
- 2.2. Multi Stage
-
3. End-User Industry
- 3.1. Oil & Gas
- 3.2. Chemicals
- 3.3. Food & Beverages
- 3.4. Water & Wastewater
- 3.5. Pharma
- 3.6. Power
- 3.7. Construction
- 3.8. Metal & Mining
APAC Centrifugal Pumps Market Segmentation By Geography
-
1. North America
- 1.1. United States
- 1.2. Canada
- 1.3. Mexico
-
2. South America
- 2.1. Brazil
- 2.2. Argentina
- 2.3. Rest of South America
-
3. Europe
- 3.1. United Kingdom
- 3.2. Germany
- 3.3. France
- 3.4. Italy
- 3.5. Spain
- 3.6. Russia
- 3.7. Benelux
- 3.8. Nordics
- 3.9. Rest of Europe
-
4. Middle East & Africa
- 4.1. Turkey
- 4.2. Israel
- 4.3. GCC
- 4.4. North Africa
- 4.5. South Africa
- 4.6. Rest of Middle East & Africa
-
5. Asia Pacific
- 5.1. China
- 5.2. India
- 5.3. Japan
- 5.4. South Korea
- 5.5. ASEAN
- 5.6. Oceania
- 5.7. Rest of Asia Pacific
APAC Centrifugal Pumps Market REPORT HIGHLIGHTS
| Aspects | Details |
|---|---|
| Study Period | 2019-2033 |
| Base Year | 2024 |
| Estimated Year | 2025 |
| Forecast Period | 2025-2033 |
| Historical Period | 2019-2024 |
| Growth Rate | CAGR of 5.70% from 2019-2033 |
| Segmentation |
|
Table of Contents
- 1. Introduction
- 1.1. Research Scope
- 1.2. Market Segmentation
- 1.3. Research Methodology
- 1.4. Definitions and Assumptions
- 2. Executive Summary
- 2.1. Introduction
- 3. Market Dynamics
- 3.1. Introduction
- 3.2. Market Drivers
- 3.2.1. Rapid Industrialization and Urbanization; Increasing Investments in Urban Waste-Water Sector; Demand for Energy-efficient Pumps
- 3.3. Market Restrains
- 3.3.1. High Acquisition and Maintenace Cost of Industrial CT systems
- 3.4. Market Trends
- 3.4.1. Increasing Government Focus on Energy Efficient products to Drive the Market Growth
- 4. Market Factor Analysis
- 4.1. Porters Five Forces
- 4.2. Supply/Value Chain
- 4.3. PESTEL analysis
- 4.4. Market Entropy
- 4.5. Patent/Trademark Analysis
- 5. Global APAC Centrifugal Pumps Market Analysis, Insights and Forecast, 2019-2031
- 5.1. Market Analysis, Insights and Forecast - by Flow Type
- 5.1.1. Axial
- 5.1.2. Radial
- 5.1.3. Mixed
- 5.2. Market Analysis, Insights and Forecast - by Number of Stages
- 5.2.1. Single Stage
- 5.2.2. Multi Stage
- 5.3. Market Analysis, Insights and Forecast - by End-User Industry
- 5.3.1. Oil & Gas
- 5.3.2. Chemicals
- 5.3.3. Food & Beverages
- 5.3.4. Water & Wastewater
- 5.3.5. Pharma
- 5.3.6. Power
- 5.3.7. Construction
- 5.3.8. Metal & Mining
- 5.4. Market Analysis, Insights and Forecast - by Region
- 5.4.1. North America
- 5.4.2. South America
- 5.4.3. Europe
- 5.4.4. Middle East & Africa
- 5.4.5. Asia Pacific
- 5.1. Market Analysis, Insights and Forecast - by Flow Type
- 6. North America APAC Centrifugal Pumps Market Analysis, Insights and Forecast, 2019-2031
- 6.1. Market Analysis, Insights and Forecast - by Flow Type
- 6.1.1. Axial
- 6.1.2. Radial
- 6.1.3. Mixed
- 6.2. Market Analysis, Insights and Forecast - by Number of Stages
- 6.2.1. Single Stage
- 6.2.2. Multi Stage
- 6.3. Market Analysis, Insights and Forecast - by End-User Industry
- 6.3.1. Oil & Gas
- 6.3.2. Chemicals
- 6.3.3. Food & Beverages
- 6.3.4. Water & Wastewater
- 6.3.5. Pharma
- 6.3.6. Power
- 6.3.7. Construction
- 6.3.8. Metal & Mining
- 6.1. Market Analysis, Insights and Forecast - by Flow Type
- 7. South America APAC Centrifugal Pumps Market Analysis, Insights and Forecast, 2019-2031
- 7.1. Market Analysis, Insights and Forecast - by Flow Type
- 7.1.1. Axial
- 7.1.2. Radial
- 7.1.3. Mixed
- 7.2. Market Analysis, Insights and Forecast - by Number of Stages
- 7.2.1. Single Stage
- 7.2.2. Multi Stage
- 7.3. Market Analysis, Insights and Forecast - by End-User Industry
- 7.3.1. Oil & Gas
- 7.3.2. Chemicals
- 7.3.3. Food & Beverages
- 7.3.4. Water & Wastewater
- 7.3.5. Pharma
- 7.3.6. Power
- 7.3.7. Construction
- 7.3.8. Metal & Mining
- 7.1. Market Analysis, Insights and Forecast - by Flow Type
- 8. Europe APAC Centrifugal Pumps Market Analysis, Insights and Forecast, 2019-2031
- 8.1. Market Analysis, Insights and Forecast - by Flow Type
- 8.1.1. Axial
- 8.1.2. Radial
- 8.1.3. Mixed
- 8.2. Market Analysis, Insights and Forecast - by Number of Stages
- 8.2.1. Single Stage
- 8.2.2. Multi Stage
- 8.3. Market Analysis, Insights and Forecast - by End-User Industry
- 8.3.1. Oil & Gas
- 8.3.2. Chemicals
- 8.3.3. Food & Beverages
- 8.3.4. Water & Wastewater
- 8.3.5. Pharma
- 8.3.6. Power
- 8.3.7. Construction
- 8.3.8. Metal & Mining
- 8.1. Market Analysis, Insights and Forecast - by Flow Type
- 9. Middle East & Africa APAC Centrifugal Pumps Market Analysis, Insights and Forecast, 2019-2031
- 9.1. Market Analysis, Insights and Forecast - by Flow Type
- 9.1.1. Axial
- 9.1.2. Radial
- 9.1.3. Mixed
- 9.2. Market Analysis, Insights and Forecast - by Number of Stages
- 9.2.1. Single Stage
- 9.2.2. Multi Stage
- 9.3. Market Analysis, Insights and Forecast - by End-User Industry
- 9.3.1. Oil & Gas
- 9.3.2. Chemicals
- 9.3.3. Food & Beverages
- 9.3.4. Water & Wastewater
- 9.3.5. Pharma
- 9.3.6. Power
- 9.3.7. Construction
- 9.3.8. Metal & Mining
- 9.1. Market Analysis, Insights and Forecast - by Flow Type
- 10. Asia Pacific APAC Centrifugal Pumps Market Analysis, Insights and Forecast, 2019-2031
- 10.1. Market Analysis, Insights and Forecast - by Flow Type
- 10.1.1. Axial
- 10.1.2. Radial
- 10.1.3. Mixed
- 10.2. Market Analysis, Insights and Forecast - by Number of Stages
- 10.2.1. Single Stage
- 10.2.2. Multi Stage
- 10.3. Market Analysis, Insights and Forecast - by End-User Industry
- 10.3.1. Oil & Gas
- 10.3.2. Chemicals
- 10.3.3. Food & Beverages
- 10.3.4. Water & Wastewater
- 10.3.5. Pharma
- 10.3.6. Power
- 10.3.7. Construction
- 10.3.8. Metal & Mining
- 10.1. Market Analysis, Insights and Forecast - by Flow Type
- 11. North America APAC Centrifugal Pumps Market Analysis, Insights and Forecast, 2019-2031
- 11.1. Market Analysis, Insights and Forecast - By Country/Sub-region
- 11.1.1.
- 12. Europe APAC Centrifugal Pumps Market Analysis, Insights and Forecast, 2019-2031
- 12.1. Market Analysis, Insights and Forecast - By Country/Sub-region
- 12.1.1.
- 13. Asia Pacific APAC Centrifugal Pumps Market Analysis, Insights and Forecast, 2019-2031
- 13.1. Market Analysis, Insights and Forecast - By Country/Sub-region
- 13.1.1.
- 14. Latin America APAC Centrifugal Pumps Market Analysis, Insights and Forecast, 2019-2031
- 14.1. Market Analysis, Insights and Forecast - By Country/Sub-region
- 14.1.1.
- 15. Middle East and Africa APAC Centrifugal Pumps Market Analysis, Insights and Forecast, 2019-2031
- 15.1. Market Analysis, Insights and Forecast - By Country/Sub-region
- 15.1.1.
- 16. Competitive Analysis
- 16.1. Global Market Share Analysis 2024
- 16.2. Company Profiles
- 16.2.1 Sulzer Ltd
- 16.2.1.1. Overview
- 16.2.1.2. Products
- 16.2.1.3. SWOT Analysis
- 16.2.1.4. Recent Developments
- 16.2.1.5. Financials (Based on Availability)
- 16.2.2 Flowserve Corporation
- 16.2.2.1. Overview
- 16.2.2.2. Products
- 16.2.2.3. SWOT Analysis
- 16.2.2.4. Recent Developments
- 16.2.2.5. Financials (Based on Availability)
- 16.2.3 The Weir Group PLC
- 16.2.3.1. Overview
- 16.2.3.2. Products
- 16.2.3.3. SWOT Analysis
- 16.2.3.4. Recent Developments
- 16.2.3.5. Financials (Based on Availability)
- 16.2.4 EBARA Pumps Europe S p A
- 16.2.4.1. Overview
- 16.2.4.2. Products
- 16.2.4.3. SWOT Analysis
- 16.2.4.4. Recent Developments
- 16.2.4.5. Financials (Based on Availability)
- 16.2.5 Ruhrpumpen Group
- 16.2.5.1. Overview
- 16.2.5.2. Products
- 16.2.5.3. SWOT Analysis
- 16.2.5.4. Recent Developments
- 16.2.5.5. Financials (Based on Availability)
- 16.2.6 Xylem
- 16.2.6.1. Overview
- 16.2.6.2. Products
- 16.2.6.3. SWOT Analysis
- 16.2.6.4. Recent Developments
- 16.2.6.5. Financials (Based on Availability)
- 16.2.7 KSB SE & Co
- 16.2.7.1. Overview
- 16.2.7.2. Products
- 16.2.7.3. SWOT Analysis
- 16.2.7.4. Recent Developments
- 16.2.7.5. Financials (Based on Availability)
- 16.2.8 Dover Corporation
- 16.2.8.1. Overview
- 16.2.8.2. Products
- 16.2.8.3. SWOT Analysis
- 16.2.8.4. Recent Developments
- 16.2.8.5. Financials (Based on Availability)
- 16.2.9 Baker Hughes Company
- 16.2.9.1. Overview
- 16.2.9.2. Products
- 16.2.9.3. SWOT Analysis
- 16.2.9.4. Recent Developments
- 16.2.9.5. Financials (Based on Availability)
- 16.2.10 Schlumberger Limited
- 16.2.10.1. Overview
- 16.2.10.2. Products
- 16.2.10.3. SWOT Analysis
- 16.2.10.4. Recent Developments
- 16.2.10.5. Financials (Based on Availability)
- 16.2.1 Sulzer Ltd
List of Figures
- Figure 1: Global APAC Centrifugal Pumps Market Revenue Breakdown (Million, %) by Region 2024 & 2032
- Figure 2: Global APAC Centrifugal Pumps Market Volume Breakdown (K Unit, %) by Region 2024 & 2032
- Figure 3: North America APAC Centrifugal Pumps Market Revenue (Million), by Country 2024 & 2032
- Figure 4: North America APAC Centrifugal Pumps Market Volume (K Unit), by Country 2024 & 2032
- Figure 5: North America APAC Centrifugal Pumps Market Revenue Share (%), by Country 2024 & 2032
- Figure 6: North America APAC Centrifugal Pumps Market Volume Share (%), by Country 2024 & 2032
- Figure 7: Europe APAC Centrifugal Pumps Market Revenue (Million), by Country 2024 & 2032
- Figure 8: Europe APAC Centrifugal Pumps Market Volume (K Unit), by Country 2024 & 2032
- Figure 9: Europe APAC Centrifugal Pumps Market Revenue Share (%), by Country 2024 & 2032
- Figure 10: Europe APAC Centrifugal Pumps Market Volume Share (%), by Country 2024 & 2032
- Figure 11: Asia Pacific APAC Centrifugal Pumps Market Revenue (Million), by Country 2024 & 2032
- Figure 12: Asia Pacific APAC Centrifugal Pumps Market Volume (K Unit), by Country 2024 & 2032
- Figure 13: Asia Pacific APAC Centrifugal Pumps Market Revenue Share (%), by Country 2024 & 2032
- Figure 14: Asia Pacific APAC Centrifugal Pumps Market Volume Share (%), by Country 2024 & 2032
- Figure 15: Latin America APAC Centrifugal Pumps Market Revenue (Million), by Country 2024 & 2032
- Figure 16: Latin America APAC Centrifugal Pumps Market Volume (K Unit), by Country 2024 & 2032
- Figure 17: Latin America APAC Centrifugal Pumps Market Revenue Share (%), by Country 2024 & 2032
- Figure 18: Latin America APAC Centrifugal Pumps Market Volume Share (%), by Country 2024 & 2032
- Figure 19: Middle East and Africa APAC Centrifugal Pumps Market Revenue (Million), by Country 2024 & 2032
- Figure 20: Middle East and Africa APAC Centrifugal Pumps Market Volume (K Unit), by Country 2024 & 2032
- Figure 21: Middle East and Africa APAC Centrifugal Pumps Market Revenue Share (%), by Country 2024 & 2032
- Figure 22: Middle East and Africa APAC Centrifugal Pumps Market Volume Share (%), by Country 2024 & 2032
- Figure 23: North America APAC Centrifugal Pumps Market Revenue (Million), by Flow Type 2024 & 2032
- Figure 24: North America APAC Centrifugal Pumps Market Volume (K Unit), by Flow Type 2024 & 2032
- Figure 25: North America APAC Centrifugal Pumps Market Revenue Share (%), by Flow Type 2024 & 2032
- Figure 26: North America APAC Centrifugal Pumps Market Volume Share (%), by Flow Type 2024 & 2032
- Figure 27: North America APAC Centrifugal Pumps Market Revenue (Million), by Number of Stages 2024 & 2032
- Figure 28: North America APAC Centrifugal Pumps Market Volume (K Unit), by Number of Stages 2024 & 2032
- Figure 29: North America APAC Centrifugal Pumps Market Revenue Share (%), by Number of Stages 2024 & 2032
- Figure 30: North America APAC Centrifugal Pumps Market Volume Share (%), by Number of Stages 2024 & 2032
- Figure 31: North America APAC Centrifugal Pumps Market Revenue (Million), by End-User Industry 2024 & 2032
- Figure 32: North America APAC Centrifugal Pumps Market Volume (K Unit), by End-User Industry 2024 & 2032
- Figure 33: North America APAC Centrifugal Pumps Market Revenue Share (%), by End-User Industry 2024 & 2032
- Figure 34: North America APAC Centrifugal Pumps Market Volume Share (%), by End-User Industry 2024 & 2032
- Figure 35: North America APAC Centrifugal Pumps Market Revenue (Million), by Country 2024 & 2032
- Figure 36: North America APAC Centrifugal Pumps Market Volume (K Unit), by Country 2024 & 2032
- Figure 37: North America APAC Centrifugal Pumps Market Revenue Share (%), by Country 2024 & 2032
- Figure 38: North America APAC Centrifugal Pumps Market Volume Share (%), by Country 2024 & 2032
- Figure 39: South America APAC Centrifugal Pumps Market Revenue (Million), by Flow Type 2024 & 2032
- Figure 40: South America APAC Centrifugal Pumps Market Volume (K Unit), by Flow Type 2024 & 2032
- Figure 41: South America APAC Centrifugal Pumps Market Revenue Share (%), by Flow Type 2024 & 2032
- Figure 42: South America APAC Centrifugal Pumps Market Volume Share (%), by Flow Type 2024 & 2032
- Figure 43: South America APAC Centrifugal Pumps Market Revenue (Million), by Number of Stages 2024 & 2032
- Figure 44: South America APAC Centrifugal Pumps Market Volume (K Unit), by Number of Stages 2024 & 2032
- Figure 45: South America APAC Centrifugal Pumps Market Revenue Share (%), by Number of Stages 2024 & 2032
- Figure 46: South America APAC Centrifugal Pumps Market Volume Share (%), by Number of Stages 2024 & 2032
- Figure 47: South America APAC Centrifugal Pumps Market Revenue (Million), by End-User Industry 2024 & 2032
- Figure 48: South America APAC Centrifugal Pumps Market Volume (K Unit), by End-User Industry 2024 & 2032
- Figure 49: South America APAC Centrifugal Pumps Market Revenue Share (%), by End-User Industry 2024 & 2032
- Figure 50: South America APAC Centrifugal Pumps Market Volume Share (%), by End-User Industry 2024 & 2032
- Figure 51: South America APAC Centrifugal Pumps Market Revenue (Million), by Country 2024 & 2032
- Figure 52: South America APAC Centrifugal Pumps Market Volume (K Unit), by Country 2024 & 2032
- Figure 53: South America APAC Centrifugal Pumps Market Revenue Share (%), by Country 2024 & 2032
- Figure 54: South America APAC Centrifugal Pumps Market Volume Share (%), by Country 2024 & 2032
- Figure 55: Europe APAC Centrifugal Pumps Market Revenue (Million), by Flow Type 2024 & 2032
- Figure 56: Europe APAC Centrifugal Pumps Market Volume (K Unit), by Flow Type 2024 & 2032
- Figure 57: Europe APAC Centrifugal Pumps Market Revenue Share (%), by Flow Type 2024 & 2032
- Figure 58: Europe APAC Centrifugal Pumps Market Volume Share (%), by Flow Type 2024 & 2032
- Figure 59: Europe APAC Centrifugal Pumps Market Revenue (Million), by Number of Stages 2024 & 2032
- Figure 60: Europe APAC Centrifugal Pumps Market Volume (K Unit), by Number of Stages 2024 & 2032
- Figure 61: Europe APAC Centrifugal Pumps Market Revenue Share (%), by Number of Stages 2024 & 2032
- Figure 62: Europe APAC Centrifugal Pumps Market Volume Share (%), by Number of Stages 2024 & 2032
- Figure 63: Europe APAC Centrifugal Pumps Market Revenue (Million), by End-User Industry 2024 & 2032
- Figure 64: Europe APAC Centrifugal Pumps Market Volume (K Unit), by End-User Industry 2024 & 2032
- Figure 65: Europe APAC Centrifugal Pumps Market Revenue Share (%), by End-User Industry 2024 & 2032
- Figure 66: Europe APAC Centrifugal Pumps Market Volume Share (%), by End-User Industry 2024 & 2032
- Figure 67: Europe APAC Centrifugal Pumps Market Revenue (Million), by Country 2024 & 2032
- Figure 68: Europe APAC Centrifugal Pumps Market Volume (K Unit), by Country 2024 & 2032
- Figure 69: Europe APAC Centrifugal Pumps Market Revenue Share (%), by Country 2024 & 2032
- Figure 70: Europe APAC Centrifugal Pumps Market Volume Share (%), by Country 2024 & 2032
- Figure 71: Middle East & Africa APAC Centrifugal Pumps Market Revenue (Million), by Flow Type 2024 & 2032
- Figure 72: Middle East & Africa APAC Centrifugal Pumps Market Volume (K Unit), by Flow Type 2024 & 2032
- Figure 73: Middle East & Africa APAC Centrifugal Pumps Market Revenue Share (%), by Flow Type 2024 & 2032
- Figure 74: Middle East & Africa APAC Centrifugal Pumps Market Volume Share (%), by Flow Type 2024 & 2032
- Figure 75: Middle East & Africa APAC Centrifugal Pumps Market Revenue (Million), by Number of Stages 2024 & 2032
- Figure 76: Middle East & Africa APAC Centrifugal Pumps Market Volume (K Unit), by Number of Stages 2024 & 2032
- Figure 77: Middle East & Africa APAC Centrifugal Pumps Market Revenue Share (%), by Number of Stages 2024 & 2032
- Figure 78: Middle East & Africa APAC Centrifugal Pumps Market Volume Share (%), by Number of Stages 2024 & 2032
- Figure 79: Middle East & Africa APAC Centrifugal Pumps Market Revenue (Million), by End-User Industry 2024 & 2032
- Figure 80: Middle East & Africa APAC Centrifugal Pumps Market Volume (K Unit), by End-User Industry 2024 & 2032
- Figure 81: Middle East & Africa APAC Centrifugal Pumps Market Revenue Share (%), by End-User Industry 2024 & 2032
- Figure 82: Middle East & Africa APAC Centrifugal Pumps Market Volume Share (%), by End-User Industry 2024 & 2032
- Figure 83: Middle East & Africa APAC Centrifugal Pumps Market Revenue (Million), by Country 2024 & 2032
- Figure 84: Middle East & Africa APAC Centrifugal Pumps Market Volume (K Unit), by Country 2024 & 2032
- Figure 85: Middle East & Africa APAC Centrifugal Pumps Market Revenue Share (%), by Country 2024 & 2032
- Figure 86: Middle East & Africa APAC Centrifugal Pumps Market Volume Share (%), by Country 2024 & 2032
- Figure 87: Asia Pacific APAC Centrifugal Pumps Market Revenue (Million), by Flow Type 2024 & 2032
- Figure 88: Asia Pacific APAC Centrifugal Pumps Market Volume (K Unit), by Flow Type 2024 & 2032
- Figure 89: Asia Pacific APAC Centrifugal Pumps Market Revenue Share (%), by Flow Type 2024 & 2032
- Figure 90: Asia Pacific APAC Centrifugal Pumps Market Volume Share (%), by Flow Type 2024 & 2032
- Figure 91: Asia Pacific APAC Centrifugal Pumps Market Revenue (Million), by Number of Stages 2024 & 2032
- Figure 92: Asia Pacific APAC Centrifugal Pumps Market Volume (K Unit), by Number of Stages 2024 & 2032
- Figure 93: Asia Pacific APAC Centrifugal Pumps Market Revenue Share (%), by Number of Stages 2024 & 2032
- Figure 94: Asia Pacific APAC Centrifugal Pumps Market Volume Share (%), by Number of Stages 2024 & 2032
- Figure 95: Asia Pacific APAC Centrifugal Pumps Market Revenue (Million), by End-User Industry 2024 & 2032
- Figure 96: Asia Pacific APAC Centrifugal Pumps Market Volume (K Unit), by End-User Industry 2024 & 2032
- Figure 97: Asia Pacific APAC Centrifugal Pumps Market Revenue Share (%), by End-User Industry 2024 & 2032
- Figure 98: Asia Pacific APAC Centrifugal Pumps Market Volume Share (%), by End-User Industry 2024 & 2032
- Figure 99: Asia Pacific APAC Centrifugal Pumps Market Revenue (Million), by Country 2024 & 2032
- Figure 100: Asia Pacific APAC Centrifugal Pumps Market Volume (K Unit), by Country 2024 & 2032
- Figure 101: Asia Pacific APAC Centrifugal Pumps Market Revenue Share (%), by Country 2024 & 2032
- Figure 102: Asia Pacific APAC Centrifugal Pumps Market Volume Share (%), by Country 2024 & 2032
List of Tables
- Table 1: Global APAC Centrifugal Pumps Market Revenue Million Forecast, by Region 2019 & 2032
- Table 2: Global APAC Centrifugal Pumps Market Volume K Unit Forecast, by Region 2019 & 2032
- Table 3: Global APAC Centrifugal Pumps Market Revenue Million Forecast, by Flow Type 2019 & 2032
- Table 4: Global APAC Centrifugal Pumps Market Volume K Unit Forecast, by Flow Type 2019 & 2032
- Table 5: Global APAC Centrifugal Pumps Market Revenue Million Forecast, by Number of Stages 2019 & 2032
- Table 6: Global APAC Centrifugal Pumps Market Volume K Unit Forecast, by Number of Stages 2019 & 2032
- Table 7: Global APAC Centrifugal Pumps Market Revenue Million Forecast, by End-User Industry 2019 & 2032
- Table 8: Global APAC Centrifugal Pumps Market Volume K Unit Forecast, by End-User Industry 2019 & 2032
- Table 9: Global APAC Centrifugal Pumps Market Revenue Million Forecast, by Region 2019 & 2032
- Table 10: Global APAC Centrifugal Pumps Market Volume K Unit Forecast, by Region 2019 & 2032
- Table 11: Global APAC Centrifugal Pumps Market Revenue Million Forecast, by Country 2019 & 2032
- Table 12: Global APAC Centrifugal Pumps Market Volume K Unit Forecast, by Country 2019 & 2032
- Table 13: APAC Centrifugal Pumps Market Revenue (Million) Forecast, by Application 2019 & 2032
- Table 14: APAC Centrifugal Pumps Market Volume (K Unit) Forecast, by Application 2019 & 2032
- Table 15: Global APAC Centrifugal Pumps Market Revenue Million Forecast, by Country 2019 & 2032
- Table 16: Global APAC Centrifugal Pumps Market Volume K Unit Forecast, by Country 2019 & 2032
- Table 17: APAC Centrifugal Pumps Market Revenue (Million) Forecast, by Application 2019 & 2032
- Table 18: APAC Centrifugal Pumps Market Volume (K Unit) Forecast, by Application 2019 & 2032
- Table 19: Global APAC Centrifugal Pumps Market Revenue Million Forecast, by Country 2019 & 2032
- Table 20: Global APAC Centrifugal Pumps Market Volume K Unit Forecast, by Country 2019 & 2032
- Table 21: APAC Centrifugal Pumps Market Revenue (Million) Forecast, by Application 2019 & 2032
- Table 22: APAC Centrifugal Pumps Market Volume (K Unit) Forecast, by Application 2019 & 2032
- Table 23: Global APAC Centrifugal Pumps Market Revenue Million Forecast, by Country 2019 & 2032
- Table 24: Global APAC Centrifugal Pumps Market Volume K Unit Forecast, by Country 2019 & 2032
- Table 25: APAC Centrifugal Pumps Market Revenue (Million) Forecast, by Application 2019 & 2032
- Table 26: APAC Centrifugal Pumps Market Volume (K Unit) Forecast, by Application 2019 & 2032
- Table 27: Global APAC Centrifugal Pumps Market Revenue Million Forecast, by Country 2019 & 2032
- Table 28: Global APAC Centrifugal Pumps Market Volume K Unit Forecast, by Country 2019 & 2032
- Table 29: APAC Centrifugal Pumps Market Revenue (Million) Forecast, by Application 2019 & 2032
- Table 30: APAC Centrifugal Pumps Market Volume (K Unit) Forecast, by Application 2019 & 2032
- Table 31: Global APAC Centrifugal Pumps Market Revenue Million Forecast, by Flow Type 2019 & 2032
- Table 32: Global APAC Centrifugal Pumps Market Volume K Unit Forecast, by Flow Type 2019 & 2032
- Table 33: Global APAC Centrifugal Pumps Market Revenue Million Forecast, by Number of Stages 2019 & 2032
- Table 34: Global APAC Centrifugal Pumps Market Volume K Unit Forecast, by Number of Stages 2019 & 2032
- Table 35: Global APAC Centrifugal Pumps Market Revenue Million Forecast, by End-User Industry 2019 & 2032
- Table 36: Global APAC Centrifugal Pumps Market Volume K Unit Forecast, by End-User Industry 2019 & 2032
- Table 37: Global APAC Centrifugal Pumps Market Revenue Million Forecast, by Country 2019 & 2032
- Table 38: Global APAC Centrifugal Pumps Market Volume K Unit Forecast, by Country 2019 & 2032
- Table 39: United States APAC Centrifugal Pumps Market Revenue (Million) Forecast, by Application 2019 & 2032
- Table 40: United States APAC Centrifugal Pumps Market Volume (K Unit) Forecast, by Application 2019 & 2032
- Table 41: Canada APAC Centrifugal Pumps Market Revenue (Million) Forecast, by Application 2019 & 2032
- Table 42: Canada APAC Centrifugal Pumps Market Volume (K Unit) Forecast, by Application 2019 & 2032
- Table 43: Mexico APAC Centrifugal Pumps Market Revenue (Million) Forecast, by Application 2019 & 2032
- Table 44: Mexico APAC Centrifugal Pumps Market Volume (K Unit) Forecast, by Application 2019 & 2032
- Table 45: Global APAC Centrifugal Pumps Market Revenue Million Forecast, by Flow Type 2019 & 2032
- Table 46: Global APAC Centrifugal Pumps Market Volume K Unit Forecast, by Flow Type 2019 & 2032
- Table 47: Global APAC Centrifugal Pumps Market Revenue Million Forecast, by Number of Stages 2019 & 2032
- Table 48: Global APAC Centrifugal Pumps Market Volume K Unit Forecast, by Number of Stages 2019 & 2032
- Table 49: Global APAC Centrifugal Pumps Market Revenue Million Forecast, by End-User Industry 2019 & 2032
- Table 50: Global APAC Centrifugal Pumps Market Volume K Unit Forecast, by End-User Industry 2019 & 2032
- Table 51: Global APAC Centrifugal Pumps Market Revenue Million Forecast, by Country 2019 & 2032
- Table 52: Global APAC Centrifugal Pumps Market Volume K Unit Forecast, by Country 2019 & 2032
- Table 53: Brazil APAC Centrifugal Pumps Market Revenue (Million) Forecast, by Application 2019 & 2032
- Table 54: Brazil APAC Centrifugal Pumps Market Volume (K Unit) Forecast, by Application 2019 & 2032
- Table 55: Argentina APAC Centrifugal Pumps Market Revenue (Million) Forecast, by Application 2019 & 2032
- Table 56: Argentina APAC Centrifugal Pumps Market Volume (K Unit) Forecast, by Application 2019 & 2032
- Table 57: Rest of South America APAC Centrifugal Pumps Market Revenue (Million) Forecast, by Application 2019 & 2032
- Table 58: Rest of South America APAC Centrifugal Pumps Market Volume (K Unit) Forecast, by Application 2019 & 2032
- Table 59: Global APAC Centrifugal Pumps Market Revenue Million Forecast, by Flow Type 2019 & 2032
- Table 60: Global APAC Centrifugal Pumps Market Volume K Unit Forecast, by Flow Type 2019 & 2032
- Table 61: Global APAC Centrifugal Pumps Market Revenue Million Forecast, by Number of Stages 2019 & 2032
- Table 62: Global APAC Centrifugal Pumps Market Volume K Unit Forecast, by Number of Stages 2019 & 2032
- Table 63: Global APAC Centrifugal Pumps Market Revenue Million Forecast, by End-User Industry 2019 & 2032
- Table 64: Global APAC Centrifugal Pumps Market Volume K Unit Forecast, by End-User Industry 2019 & 2032
- Table 65: Global APAC Centrifugal Pumps Market Revenue Million Forecast, by Country 2019 & 2032
- Table 66: Global APAC Centrifugal Pumps Market Volume K Unit Forecast, by Country 2019 & 2032
- Table 67: United Kingdom APAC Centrifugal Pumps Market Revenue (Million) Forecast, by Application 2019 & 2032
- Table 68: United Kingdom APAC Centrifugal Pumps Market Volume (K Unit) Forecast, by Application 2019 & 2032
- Table 69: Germany APAC Centrifugal Pumps Market Revenue (Million) Forecast, by Application 2019 & 2032
- Table 70: Germany APAC Centrifugal Pumps Market Volume (K Unit) Forecast, by Application 2019 & 2032
- Table 71: France APAC Centrifugal Pumps Market Revenue (Million) Forecast, by Application 2019 & 2032
- Table 72: France APAC Centrifugal Pumps Market Volume (K Unit) Forecast, by Application 2019 & 2032
- Table 73: Italy APAC Centrifugal Pumps Market Revenue (Million) Forecast, by Application 2019 & 2032
- Table 74: Italy APAC Centrifugal Pumps Market Volume (K Unit) Forecast, by Application 2019 & 2032
- Table 75: Spain APAC Centrifugal Pumps Market Revenue (Million) Forecast, by Application 2019 & 2032
- Table 76: Spain APAC Centrifugal Pumps Market Volume (K Unit) Forecast, by Application 2019 & 2032
- Table 77: Russia APAC Centrifugal Pumps Market Revenue (Million) Forecast, by Application 2019 & 2032
- Table 78: Russia APAC Centrifugal Pumps Market Volume (K Unit) Forecast, by Application 2019 & 2032
- Table 79: Benelux APAC Centrifugal Pumps Market Revenue (Million) Forecast, by Application 2019 & 2032
- Table 80: Benelux APAC Centrifugal Pumps Market Volume (K Unit) Forecast, by Application 2019 & 2032
- Table 81: Nordics APAC Centrifugal Pumps Market Revenue (Million) Forecast, by Application 2019 & 2032
- Table 82: Nordics APAC Centrifugal Pumps Market Volume (K Unit) Forecast, by Application 2019 & 2032
- Table 83: Rest of Europe APAC Centrifugal Pumps Market Revenue (Million) Forecast, by Application 2019 & 2032
- Table 84: Rest of Europe APAC Centrifugal Pumps Market Volume (K Unit) Forecast, by Application 2019 & 2032
- Table 85: Global APAC Centrifugal Pumps Market Revenue Million Forecast, by Flow Type 2019 & 2032
- Table 86: Global APAC Centrifugal Pumps Market Volume K Unit Forecast, by Flow Type 2019 & 2032
- Table 87: Global APAC Centrifugal Pumps Market Revenue Million Forecast, by Number of Stages 2019 & 2032
- Table 88: Global APAC Centrifugal Pumps Market Volume K Unit Forecast, by Number of Stages 2019 & 2032
- Table 89: Global APAC Centrifugal Pumps Market Revenue Million Forecast, by End-User Industry 2019 & 2032
- Table 90: Global APAC Centrifugal Pumps Market Volume K Unit Forecast, by End-User Industry 2019 & 2032
- Table 91: Global APAC Centrifugal Pumps Market Revenue Million Forecast, by Country 2019 & 2032
- Table 92: Global APAC Centrifugal Pumps Market Volume K Unit Forecast, by Country 2019 & 2032
- Table 93: Turkey APAC Centrifugal Pumps Market Revenue (Million) Forecast, by Application 2019 & 2032
- Table 94: Turkey APAC Centrifugal Pumps Market Volume (K Unit) Forecast, by Application 2019 & 2032
- Table 95: Israel APAC Centrifugal Pumps Market Revenue (Million) Forecast, by Application 2019 & 2032
- Table 96: Israel APAC Centrifugal Pumps Market Volume (K Unit) Forecast, by Application 2019 & 2032
- Table 97: GCC APAC Centrifugal Pumps Market Revenue (Million) Forecast, by Application 2019 & 2032
- Table 98: GCC APAC Centrifugal Pumps Market Volume (K Unit) Forecast, by Application 2019 & 2032
- Table 99: North Africa APAC Centrifugal Pumps Market Revenue (Million) Forecast, by Application 2019 & 2032
- Table 100: North Africa APAC Centrifugal Pumps Market Volume (K Unit) Forecast, by Application 2019 & 2032
- Table 101: South Africa APAC Centrifugal Pumps Market Revenue (Million) Forecast, by Application 2019 & 2032
- Table 102: South Africa APAC Centrifugal Pumps Market Volume (K Unit) Forecast, by Application 2019 & 2032
- Table 103: Rest of Middle East & Africa APAC Centrifugal Pumps Market Revenue (Million) Forecast, by Application 2019 & 2032
- Table 104: Rest of Middle East & Africa APAC Centrifugal Pumps Market Volume (K Unit) Forecast, by Application 2019 & 2032
- Table 105: Global APAC Centrifugal Pumps Market Revenue Million Forecast, by Flow Type 2019 & 2032
- Table 106: Global APAC Centrifugal Pumps Market Volume K Unit Forecast, by Flow Type 2019 & 2032
- Table 107: Global APAC Centrifugal Pumps Market Revenue Million Forecast, by Number of Stages 2019 & 2032
- Table 108: Global APAC Centrifugal Pumps Market Volume K Unit Forecast, by Number of Stages 2019 & 2032
- Table 109: Global APAC Centrifugal Pumps Market Revenue Million Forecast, by End-User Industry 2019 & 2032
- Table 110: Global APAC Centrifugal Pumps Market Volume K Unit Forecast, by End-User Industry 2019 & 2032
- Table 111: Global APAC Centrifugal Pumps Market Revenue Million Forecast, by Country 2019 & 2032
- Table 112: Global APAC Centrifugal Pumps Market Volume K Unit Forecast, by Country 2019 & 2032
- Table 113: China APAC Centrifugal Pumps Market Revenue (Million) Forecast, by Application 2019 & 2032
- Table 114: China APAC Centrifugal Pumps Market Volume (K Unit) Forecast, by Application 2019 & 2032
- Table 115: India APAC Centrifugal Pumps Market Revenue (Million) Forecast, by Application 2019 & 2032
- Table 116: India APAC Centrifugal Pumps Market Volume (K Unit) Forecast, by Application 2019 & 2032
- Table 117: Japan APAC Centrifugal Pumps Market Revenue (Million) Forecast, by Application 2019 & 2032
- Table 118: Japan APAC Centrifugal Pumps Market Volume (K Unit) Forecast, by Application 2019 & 2032
- Table 119: South Korea APAC Centrifugal Pumps Market Revenue (Million) Forecast, by Application 2019 & 2032
- Table 120: South Korea APAC Centrifugal Pumps Market Volume (K Unit) Forecast, by Application 2019 & 2032
- Table 121: ASEAN APAC Centrifugal Pumps Market Revenue (Million) Forecast, by Application 2019 & 2032
- Table 122: ASEAN APAC Centrifugal Pumps Market Volume (K Unit) Forecast, by Application 2019 & 2032
- Table 123: Oceania APAC Centrifugal Pumps Market Revenue (Million) Forecast, by Application 2019 & 2032
- Table 124: Oceania APAC Centrifugal Pumps Market Volume (K Unit) Forecast, by Application 2019 & 2032
- Table 125: Rest of Asia Pacific APAC Centrifugal Pumps Market Revenue (Million) Forecast, by Application 2019 & 2032
- Table 126: Rest of Asia Pacific APAC Centrifugal Pumps Market Volume (K Unit) Forecast, by Application 2019 & 2032
Frequently Asked Questions
1. What is the projected Compound Annual Growth Rate (CAGR) of the APAC Centrifugal Pumps Market?
The projected CAGR is approximately 5.70%.
2. Which companies are prominent players in the APAC Centrifugal Pumps Market?
Key companies in the market include Sulzer Ltd, Flowserve Corporation, The Weir Group PLC, EBARA Pumps Europe S p A, Ruhrpumpen Group, Xylem, KSB SE & Co, Dover Corporation, Baker Hughes Company, Schlumberger Limited.
3. What are the main segments of the APAC Centrifugal Pumps Market?
The market segments include Flow Type, Number of Stages, End-User Industry.
4. Can you provide details about the market size?
The market size is estimated to be USD XX Million as of 2022.
5. What are some drivers contributing to market growth?
Rapid Industrialization and Urbanization; Increasing Investments in Urban Waste-Water Sector; Demand for Energy-efficient Pumps.
6. What are the notable trends driving market growth?
Increasing Government Focus on Energy Efficient products to Drive the Market Growth.
7. Are there any restraints impacting market growth?
High Acquisition and Maintenace Cost of Industrial CT systems.
8. Can you provide examples of recent developments in the market?
November 2021 - Third-Generation REDA HPS multistage centrifugal pump has a modular design that provides a cost-effective solution for various applications, from simple water injection to more complex refinery services and crude oil transfer. It is an efficient alternative to splitcase, vertical turbine, and positive displacement pumps. Because of the modular design and factory alignment, restarting the pump is a simple procedure. The third-generation REDA HPS surface pump requires no daily maintenance. The consistent performance and low vibration extend equipment life and greatly reduce the chance of leakage from associated piping.
9. What pricing options are available for accessing the report?
Pricing options include single-user, multi-user, and enterprise licenses priced at USD 4750, USD 4950, and USD 6800 respectively.
10. Is the market size provided in terms of value or volume?
The market size is provided in terms of value, measured in Million and volume, measured in K Unit.
11. Are there any specific market keywords associated with the report?
Yes, the market keyword associated with the report is "APAC Centrifugal Pumps Market," which aids in identifying and referencing the specific market segment covered.
12. How do I determine which pricing option suits my needs best?
The pricing options vary based on user requirements and access needs. Individual users may opt for single-user licenses, while businesses requiring broader access may choose multi-user or enterprise licenses for cost-effective access to the report.
13. Are there any additional resources or data provided in the APAC Centrifugal Pumps Market report?
While the report offers comprehensive insights, it's advisable to review the specific contents or supplementary materials provided to ascertain if additional resources or data are available.
14. How can I stay updated on further developments or reports in the APAC Centrifugal Pumps Market?
To stay informed about further developments, trends, and reports in the APAC Centrifugal Pumps Market, consider subscribing to industry newsletters, following relevant companies and organizations, or regularly checking reputable industry news sources and publications.
Methodology
Step 1 - Identification of Relevant Samples Size from Population Database


Step 2 - Approaches for Defining Global Market Size (Value, Volume* & Price*)

Note*: In applicable scenarios
Step 3 - Data Sources
Primary Research
- Web Analytics
- Survey Reports
- Research Institute
- Latest Research Reports
- Opinion Leaders
Secondary Research
- Annual Reports
- White Paper
- Latest Press Release
- Industry Association
- Paid Database
- Investor Presentations

Step 4 - Data Triangulation
Involves using different sources of information in order to increase the validity of a study
These sources are likely to be stakeholders in a program - participants, other researchers, program staff, other community members, and so on.
Then we put all data in single framework & apply various statistical tools to find out the dynamic on the market.
During the analysis stage, feedback from the stakeholder groups would be compared to determine areas of agreement as well as areas of divergence


