
Key Insights
The Asia-Pacific (APAC) alcoholic drinks market, encompassing beer, wine, and spirits, presents a dynamic landscape characterized by robust growth and evolving consumer preferences. Driven by rising disposable incomes, particularly in emerging economies like India and China, and a burgeoning young adult population embracing Western drinking cultures, the market exhibits a significant expansion trajectory. The 5.22% CAGR (Compound Annual Growth Rate) observed globally suggests a substantial market expansion within APAC, potentially exceeding this rate given the region's unique growth drivers. While precise APAC-specific figures are unavailable, the large and growing populations coupled with increasing urbanization and a shift towards premiumization (consumers opting for higher-quality products) point towards considerable growth. The on-trade segment (bars, restaurants) benefits from increased social gatherings and tourism, while the off-trade (retail stores) experiences significant growth due to e-commerce expansion and the convenience factor. However, challenges include government regulations concerning alcohol consumption, varying cultural attitudes towards alcohol, and health consciousness initiatives promoting responsible drinking, which could act as restraints on the market's overall growth. The segment breakdown within APAC will likely see spirits and beer dominating, given their established presence and cultural acceptance, although wine consumption is expected to rise with increasing Western influence. Key players like Diageo, Pernod Ricard, and local breweries are strategically investing to capture this growth, focusing on innovative product offerings and targeted marketing campaigns to specific demographic segments.
The growth in the APAC alcoholic drinks market is not uniform across countries. China and India, with their vast populations and developing economies, are expected to contribute significantly to the overall market value. However, other countries in Southeast Asia (e.g., Thailand, Singapore) also exhibit strong growth potential driven by increasing tourism and a rising middle class. Market penetration strategies are vital for success, focusing on regional preferences and cultural nuances. Furthermore, sustainability initiatives and ethical sourcing are gaining traction among consumers, prompting companies to adopt responsible practices throughout their supply chains. This heightened consumer awareness presents both an opportunity and a challenge – a need to balance profit maximization with ethical considerations to sustain long-term growth. While regulatory hurdles remain a factor, proactive adaptation to regional regulations and fostering partnerships with local distributors are crucial for successful market navigation.
APAC Alcoholic Drinks Industry: 2019-2033 Market Analysis & Forecast Report
This comprehensive report provides a detailed analysis of the Asia-Pacific (APAC) alcoholic drinks market, covering the period 2019-2033. It offers invaluable insights into market dynamics, growth trends, key players, and future opportunities within the beer, wine, and spirits sectors across on-trade and off-trade distribution channels. The report is essential for industry professionals, investors, and anyone seeking a deep understanding of this dynamic and lucrative market.
APAC Alcoholic Drinks Industry Market Dynamics & Structure
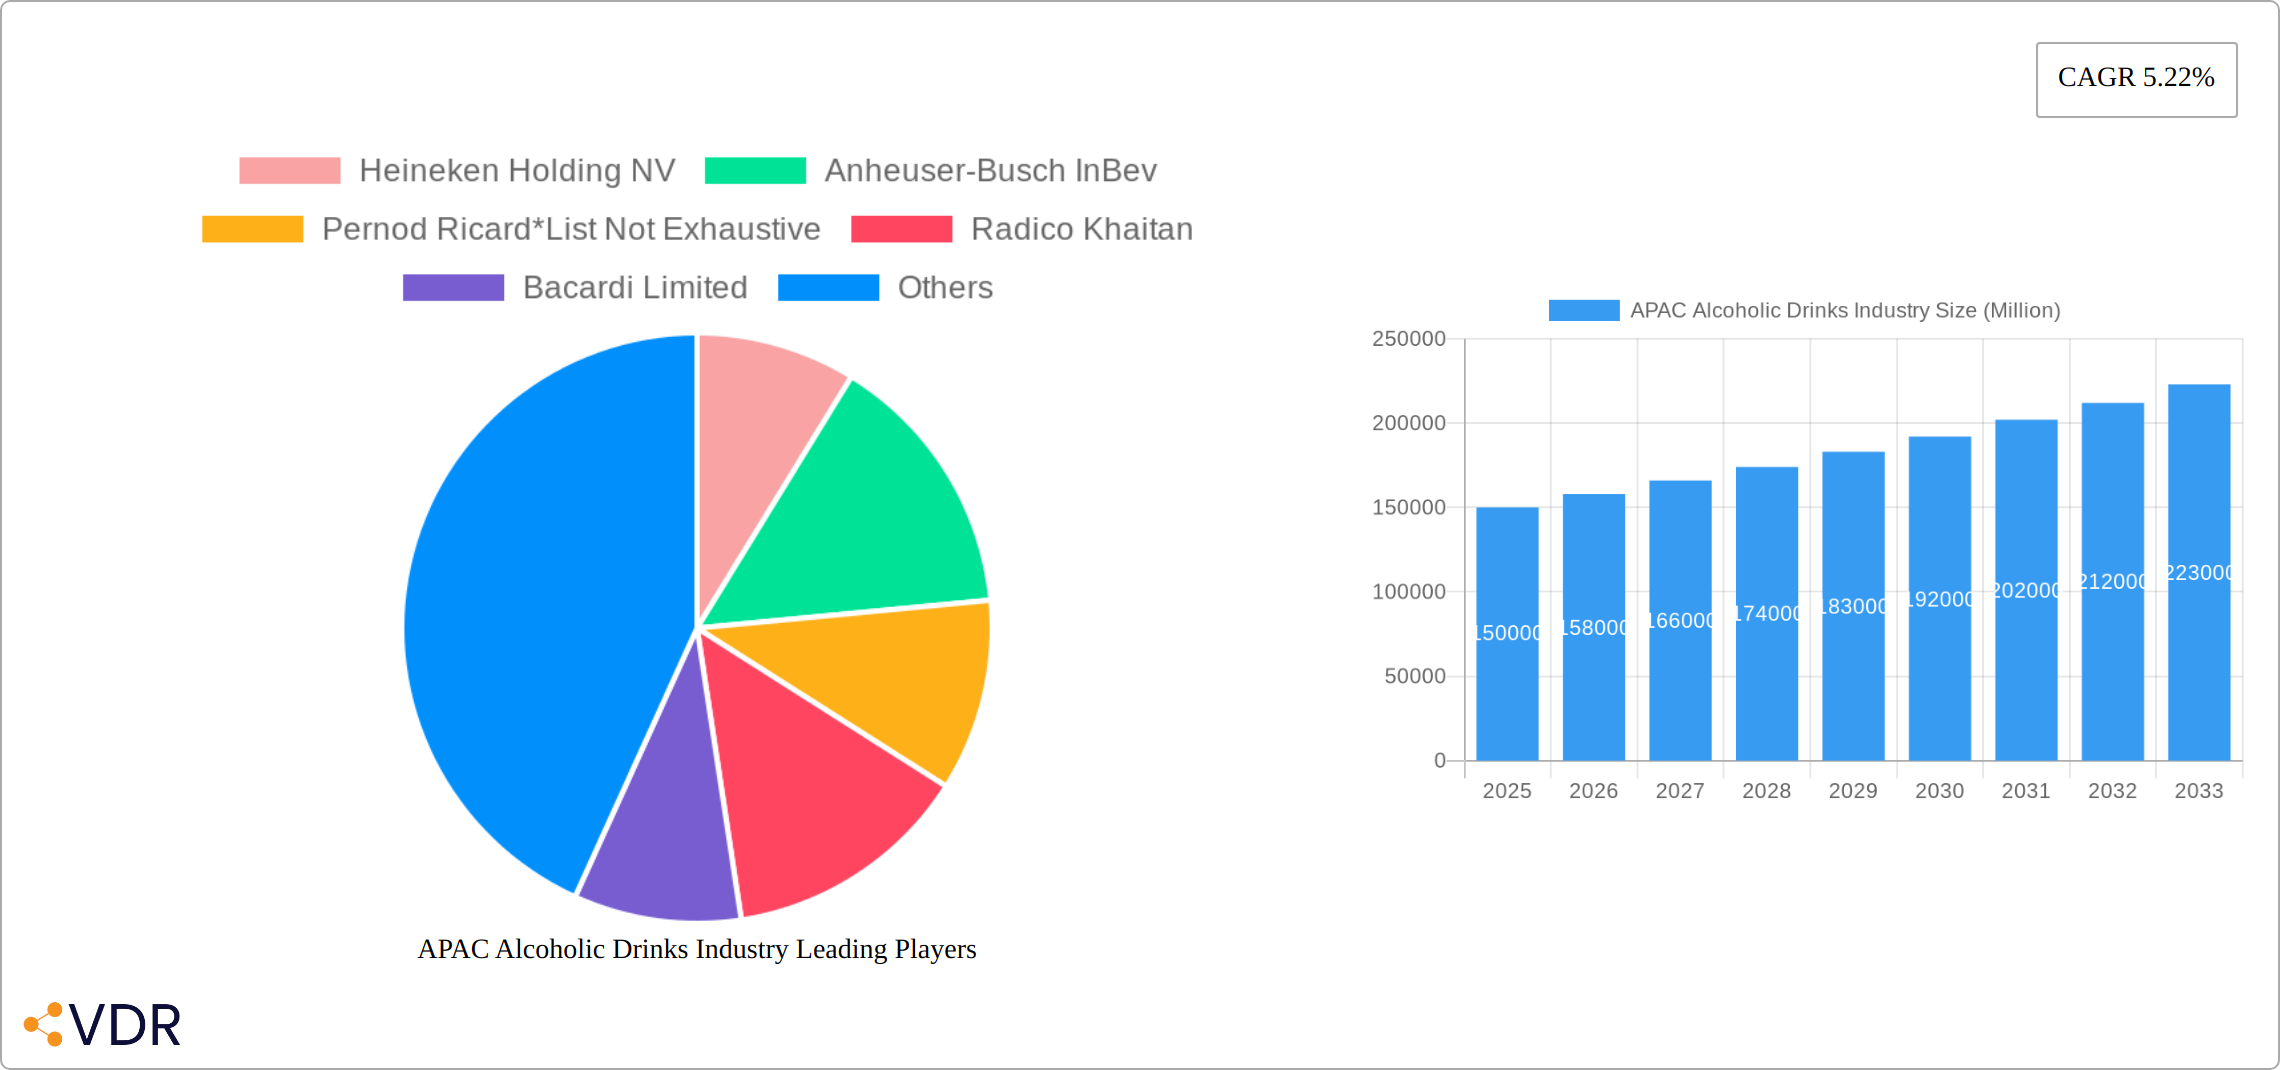
The APAC alcoholic drinks market is characterized by a complex interplay of factors influencing its structure and growth. Market concentration varies significantly across segments, with established global players like Heineken Holding NV, Anheuser-Busch InBev, and Pernod Ricard dominating certain segments. However, regional players such as Radico Khaitan, Bacardi Limited, Suntory Beverages & Food Limited, Brown-Forman, Molson Coors Brewing Company, Diageo PLC, and The Wine Group LLC also hold significant market share, particularly within specific product categories and geographic areas.
- Market Concentration: The market exhibits high concentration in some segments (e.g., premium spirits) and fragmented competition in others (e.g., craft beer). XX% of the market is controlled by the top 5 players in 2025.
- Technological Innovation: Automation in brewing and distilling, improved packaging, and digital marketing are driving innovation. However, traditional production methods and consumer preferences present barriers to widespread adoption of new technologies.
- Regulatory Frameworks: Varying alcohol regulations across APAC countries create complexities for manufacturers and distributors. Tax policies and licensing requirements impact pricing and distribution strategies.
- Competitive Product Substitutes: Non-alcoholic beverages, ready-to-drink (RTD) cocktails, and functional drinks pose increasing competition. The growth of health-conscious consumers drives the demand for substitutes.
- End-User Demographics: The burgeoning middle class and changing consumption patterns (e.g., increasing preference for premium products) are key drivers of market growth. Young adult consumers are a significant target group.
- M&A Trends: Consolidation is prevalent, with larger players acquiring smaller breweries, wineries, and distilleries to expand their product portfolios and market reach. XX M&A deals were recorded in the APAC alcoholic drinks industry between 2019 and 2024.
APAC Alcoholic Drinks Industry Growth Trends & Insights
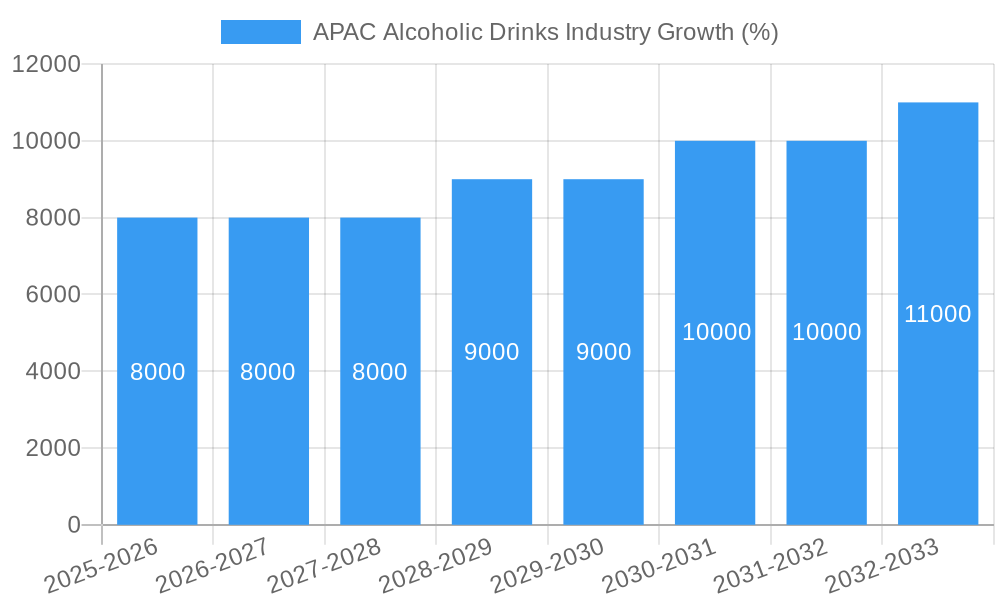
The APAC alcoholic drinks market is expected to experience robust growth during the forecast period (2025-2033). Driven by rising disposable incomes, urbanization, and changing consumer preferences, the market size is projected to reach xx Million units by 2033, exhibiting a CAGR of xx% from 2025 to 2033. Beer remains the dominant segment, followed by spirits and wine. However, the RTD segment is experiencing rapid growth, fueled by its convenience and diverse flavor profiles. The increasing preference for premium and craft products contributes significantly to market expansion. Technological advancements, such as personalized marketing and e-commerce platforms, further enhance market penetration. Shifting consumer behavior towards experiences and premiumization is altering the landscape, creating opportunities for niche players and innovative product offerings. Furthermore, increasing disposable income and changing lifestyles in developing economies like India and China are driving consumption. The adoption of e-commerce platforms is also influencing market growth, facilitating direct-to-consumer sales. Technological disruptions, such as personalized recommendations and online delivery services, enhance the customer experience and promote market growth. The market penetration rate for premium alcoholic beverages is steadily rising, indicating a shift towards higher-value products.
Dominant Regions, Countries, or Segments in APAC Alcoholic Drinks Industry
China and India are the leading markets in the APAC alcoholic drinks industry, driving significant growth across beer, spirits, and wine segments. The on-trade channel, particularly in urban areas, dominates distribution.
- China: High per capita consumption, a burgeoning middle class, and a robust on-trade sector contribute to China's dominance. Favorable economic policies and infrastructure development support market growth.
- India: Growing disposable incomes, a large young population, and rising demand for premium spirits drive market expansion. The robust off-trade channel also plays a key role in market penetration.
- Segment Dominance: Beer holds the largest market share, followed by spirits and wine. The on-trade segment accounts for the majority of sales, although off-trade is catching up. Growth is fueled by factors like increasing urbanization, tourism, and changing lifestyles.
APAC Alcoholic Drinks Industry Product Landscape
The APAC alcoholic drinks market displays a diverse product landscape, encompassing traditional and innovative offerings. Product innovations include craft beers, premium spirits, flavored wines, and ready-to-drink (RTD) cocktails. These products cater to evolving consumer preferences for diverse flavors, unique experiences, and convenience. Technological advancements, such as improved brewing and distilling techniques, ensure high-quality products and enhance efficiency. The focus is on differentiation through unique flavor profiles, premium ingredients, and sophisticated packaging to appeal to discerning consumers.
Key Drivers, Barriers & Challenges in APAC Alcoholic Drinks Industry
Key Drivers: Rising disposable incomes, increasing urbanization, changing consumer preferences (premiumization, health-conscious options), and technological advancements (e.g., improved brewing techniques, online sales) propel market growth. Government initiatives to promote local industries and tourism also contribute positively.
Challenges: Stringent alcohol regulations, varying tax policies across different countries, and intense competition from established and emerging players pose significant challenges. Supply chain disruptions, particularly during the pandemic, highlighted the need for resilient supply networks. Moreover, the rising health consciousness among consumers creates a need to adapt to changing demands for healthier alternatives.
Emerging Opportunities in APAP Alcoholic Drinks Industry
Untapped potential exists in rural markets, where alcohol consumption is growing. The rise of e-commerce provides opportunities for direct-to-consumer sales. Furthermore, opportunities lie in developing innovative products that cater to health-conscious consumers (e.g., low-alcohol beverages) and explore emerging trends like cannabis-infused drinks (where legally permissible).
Growth Accelerators in the APAC Alcoholic Drinks Industry
Strategic partnerships between international and local players can fuel growth by leveraging expertise and market access. Technological breakthroughs in brewing, distilling, and packaging further enhance efficiency and product quality. Expansion into new markets and product categories contributes to growth.
Key Players Shaping the APAC Alcoholic Drinks Industry Market
- Heineken Holding NV
- Anheuser-Busch InBev
- Pernod Ricard
- Radico Khaitan
- Bacardi Limited
- Suntory Beverages & Food Limited
- Brown-Forman
- Molson Coors Brewing Company
- Diageo PLC
- The Wine Group LLC
Notable Milestones in APAC Alcoholic Drinks Industry Sector
- April 2022: Diageo India launched a new single malt whisky and mixers, leveraging local ingredients and appealing to premium consumers.
- February 2022: Bacardi GTR introduced a new travel-retail exclusive Teeling Whiskey line in partnership with China Duty-Free Group (CDFG), expanding its reach in the luxury segment.
- July 2021: The Boston Beer Company and Beam Suntory formed a strategic partnership to expand into RTD and bottled spirits, highlighting the trend of collaborations in expanding product portfolios.
In-Depth APAC Alcoholic Drinks Industry Market Outlook
The APAC alcoholic drinks market presents significant long-term growth potential, driven by continuing urbanization, rising disposable incomes, and shifting consumer preferences. Strategic partnerships, technological advancements, and product diversification will play a key role in shaping the market's future. Companies that adapt to evolving consumer needs and regulatory landscapes will be best positioned to capitalize on the emerging opportunities. The premiumization trend and the growth of the RTD segment will continue to drive market expansion.
APAC Alcoholic Drinks Industry Segmentation
-
1. Product Type
- 1.1. Beer
- 1.2. Wine
- 1.3. Spirits
-
2. Distribution Channel
- 2.1. On-trade
-
2.2. Off-trade
- 2.2.1. Supermarkets/Hypermarkets
- 2.2.2. Specialist Stores
- 2.2.3. Online Retail Stores
- 2.2.4. Other Off-trade Channels
-
3. Geography
- 3.1. China
- 3.2. Japan
- 3.3. India
- 3.4. Australia
- 3.5. Rest of Asia-Pacific
APAC Alcoholic Drinks Industry Segmentation By Geography
- 1. China
- 2. Japan
- 3. India
- 4. Australia
- 5. Rest of Asia Pacific
APAC Alcoholic Drinks Industry REPORT HIGHLIGHTS
| Aspects | Details |
|---|---|
| Study Period | 2019-2033 |
| Base Year | 2024 |
| Estimated Year | 2025 |
| Forecast Period | 2025-2033 |
| Historical Period | 2019-2024 |
| Growth Rate | CAGR of 5.22% from 2019-2033 |
| Segmentation |
|
Table of Contents
- 1. Introduction
- 1.1. Research Scope
- 1.2. Market Segmentation
- 1.3. Research Methodology
- 1.4. Definitions and Assumptions
- 2. Executive Summary
- 2.1. Introduction
- 3. Market Dynamics
- 3.1. Introduction
- 3.2. Market Drivers
- 3.2.1. Convenience Offered By Online Food Delivery Services; Attractive Offers And Memberships Along With Advertisements And Marketing By Players
- 3.3. Market Restrains
- 3.3.1. Consumers Desire For Fine Dining Experience
- 3.4. Market Trends
- 3.4.1. Rising Demand for Cocktails and Other Mixed Drinks
- 4. Market Factor Analysis
- 4.1. Porters Five Forces
- 4.2. Supply/Value Chain
- 4.3. PESTEL analysis
- 4.4. Market Entropy
- 4.5. Patent/Trademark Analysis
- 5. Global APAC Alcoholic Drinks Industry Analysis, Insights and Forecast, 2019-2031
- 5.1. Market Analysis, Insights and Forecast - by Product Type
- 5.1.1. Beer
- 5.1.2. Wine
- 5.1.3. Spirits
- 5.2. Market Analysis, Insights and Forecast - by Distribution Channel
- 5.2.1. On-trade
- 5.2.2. Off-trade
- 5.2.2.1. Supermarkets/Hypermarkets
- 5.2.2.2. Specialist Stores
- 5.2.2.3. Online Retail Stores
- 5.2.2.4. Other Off-trade Channels
- 5.3. Market Analysis, Insights and Forecast - by Geography
- 5.3.1. China
- 5.3.2. Japan
- 5.3.3. India
- 5.3.4. Australia
- 5.3.5. Rest of Asia-Pacific
- 5.4. Market Analysis, Insights and Forecast - by Region
- 5.4.1. China
- 5.4.2. Japan
- 5.4.3. India
- 5.4.4. Australia
- 5.4.5. Rest of Asia Pacific
- 5.1. Market Analysis, Insights and Forecast - by Product Type
- 6. China APAC Alcoholic Drinks Industry Analysis, Insights and Forecast, 2019-2031
- 6.1. Market Analysis, Insights and Forecast - by Product Type
- 6.1.1. Beer
- 6.1.2. Wine
- 6.1.3. Spirits
- 6.2. Market Analysis, Insights and Forecast - by Distribution Channel
- 6.2.1. On-trade
- 6.2.2. Off-trade
- 6.2.2.1. Supermarkets/Hypermarkets
- 6.2.2.2. Specialist Stores
- 6.2.2.3. Online Retail Stores
- 6.2.2.4. Other Off-trade Channels
- 6.3. Market Analysis, Insights and Forecast - by Geography
- 6.3.1. China
- 6.3.2. Japan
- 6.3.3. India
- 6.3.4. Australia
- 6.3.5. Rest of Asia-Pacific
- 6.1. Market Analysis, Insights and Forecast - by Product Type
- 7. Japan APAC Alcoholic Drinks Industry Analysis, Insights and Forecast, 2019-2031
- 7.1. Market Analysis, Insights and Forecast - by Product Type
- 7.1.1. Beer
- 7.1.2. Wine
- 7.1.3. Spirits
- 7.2. Market Analysis, Insights and Forecast - by Distribution Channel
- 7.2.1. On-trade
- 7.2.2. Off-trade
- 7.2.2.1. Supermarkets/Hypermarkets
- 7.2.2.2. Specialist Stores
- 7.2.2.3. Online Retail Stores
- 7.2.2.4. Other Off-trade Channels
- 7.3. Market Analysis, Insights and Forecast - by Geography
- 7.3.1. China
- 7.3.2. Japan
- 7.3.3. India
- 7.3.4. Australia
- 7.3.5. Rest of Asia-Pacific
- 7.1. Market Analysis, Insights and Forecast - by Product Type
- 8. India APAC Alcoholic Drinks Industry Analysis, Insights and Forecast, 2019-2031
- 8.1. Market Analysis, Insights and Forecast - by Product Type
- 8.1.1. Beer
- 8.1.2. Wine
- 8.1.3. Spirits
- 8.2. Market Analysis, Insights and Forecast - by Distribution Channel
- 8.2.1. On-trade
- 8.2.2. Off-trade
- 8.2.2.1. Supermarkets/Hypermarkets
- 8.2.2.2. Specialist Stores
- 8.2.2.3. Online Retail Stores
- 8.2.2.4. Other Off-trade Channels
- 8.3. Market Analysis, Insights and Forecast - by Geography
- 8.3.1. China
- 8.3.2. Japan
- 8.3.3. India
- 8.3.4. Australia
- 8.3.5. Rest of Asia-Pacific
- 8.1. Market Analysis, Insights and Forecast - by Product Type
- 9. Australia APAC Alcoholic Drinks Industry Analysis, Insights and Forecast, 2019-2031
- 9.1. Market Analysis, Insights and Forecast - by Product Type
- 9.1.1. Beer
- 9.1.2. Wine
- 9.1.3. Spirits
- 9.2. Market Analysis, Insights and Forecast - by Distribution Channel
- 9.2.1. On-trade
- 9.2.2. Off-trade
- 9.2.2.1. Supermarkets/Hypermarkets
- 9.2.2.2. Specialist Stores
- 9.2.2.3. Online Retail Stores
- 9.2.2.4. Other Off-trade Channels
- 9.3. Market Analysis, Insights and Forecast - by Geography
- 9.3.1. China
- 9.3.2. Japan
- 9.3.3. India
- 9.3.4. Australia
- 9.3.5. Rest of Asia-Pacific
- 9.1. Market Analysis, Insights and Forecast - by Product Type
- 10. Rest of Asia Pacific APAC Alcoholic Drinks Industry Analysis, Insights and Forecast, 2019-2031
- 10.1. Market Analysis, Insights and Forecast - by Product Type
- 10.1.1. Beer
- 10.1.2. Wine
- 10.1.3. Spirits
- 10.2. Market Analysis, Insights and Forecast - by Distribution Channel
- 10.2.1. On-trade
- 10.2.2. Off-trade
- 10.2.2.1. Supermarkets/Hypermarkets
- 10.2.2.2. Specialist Stores
- 10.2.2.3. Online Retail Stores
- 10.2.2.4. Other Off-trade Channels
- 10.3. Market Analysis, Insights and Forecast - by Geography
- 10.3.1. China
- 10.3.2. Japan
- 10.3.3. India
- 10.3.4. Australia
- 10.3.5. Rest of Asia-Pacific
- 10.1. Market Analysis, Insights and Forecast - by Product Type
- 11. North America APAC Alcoholic Drinks Industry Analysis, Insights and Forecast, 2019-2031
- 11.1. Market Analysis, Insights and Forecast - By Country/Sub-region
- 11.1.1 United States
- 11.1.2 Canada
- 11.1.3 Mexico
- 12. Europe APAC Alcoholic Drinks Industry Analysis, Insights and Forecast, 2019-2031
- 12.1. Market Analysis, Insights and Forecast - By Country/Sub-region
- 12.1.1 Germany
- 12.1.2 United Kingdom
- 12.1.3 France
- 12.1.4 Spain
- 12.1.5 Italy
- 12.1.6 Spain
- 12.1.7 Belgium
- 12.1.8 Netherland
- 12.1.9 Nordics
- 12.1.10 Rest of Europe
- 13. Asia Pacific APAC Alcoholic Drinks Industry Analysis, Insights and Forecast, 2019-2031
- 13.1. Market Analysis, Insights and Forecast - By Country/Sub-region
- 13.1.1 China
- 13.1.2 Japan
- 13.1.3 India
- 13.1.4 South Korea
- 13.1.5 Southeast Asia
- 13.1.6 Australia
- 13.1.7 Indonesia
- 13.1.8 Phillipes
- 13.1.9 Singapore
- 13.1.10 Thailandc
- 13.1.11 Rest of Asia Pacific
- 14. South America APAC Alcoholic Drinks Industry Analysis, Insights and Forecast, 2019-2031
- 14.1. Market Analysis, Insights and Forecast - By Country/Sub-region
- 14.1.1 Brazil
- 14.1.2 Argentina
- 14.1.3 Peru
- 14.1.4 Chile
- 14.1.5 Colombia
- 14.1.6 Ecuador
- 14.1.7 Venezuela
- 14.1.8 Rest of South America
- 15. North America APAC Alcoholic Drinks Industry Analysis, Insights and Forecast, 2019-2031
- 15.1. Market Analysis, Insights and Forecast - By Country/Sub-region
- 15.1.1 United States
- 15.1.2 Canada
- 15.1.3 Mexico
- 16. MEA APAC Alcoholic Drinks Industry Analysis, Insights and Forecast, 2019-2031
- 16.1. Market Analysis, Insights and Forecast - By Country/Sub-region
- 16.1.1 United Arab Emirates
- 16.1.2 Saudi Arabia
- 16.1.3 South Africa
- 16.1.4 Rest of Middle East and Africa
- 17. Competitive Analysis
- 17.1. Global Market Share Analysis 2024
- 17.2. Company Profiles
- 17.2.1 Heineken Holding NV
- 17.2.1.1. Overview
- 17.2.1.2. Products
- 17.2.1.3. SWOT Analysis
- 17.2.1.4. Recent Developments
- 17.2.1.5. Financials (Based on Availability)
- 17.2.2 Anheuser-Busch InBev
- 17.2.2.1. Overview
- 17.2.2.2. Products
- 17.2.2.3. SWOT Analysis
- 17.2.2.4. Recent Developments
- 17.2.2.5. Financials (Based on Availability)
- 17.2.3 Pernod Ricard*List Not Exhaustive
- 17.2.3.1. Overview
- 17.2.3.2. Products
- 17.2.3.3. SWOT Analysis
- 17.2.3.4. Recent Developments
- 17.2.3.5. Financials (Based on Availability)
- 17.2.4 Radico Khaitan
- 17.2.4.1. Overview
- 17.2.4.2. Products
- 17.2.4.3. SWOT Analysis
- 17.2.4.4. Recent Developments
- 17.2.4.5. Financials (Based on Availability)
- 17.2.5 Bacardi Limited
- 17.2.5.1. Overview
- 17.2.5.2. Products
- 17.2.5.3. SWOT Analysis
- 17.2.5.4. Recent Developments
- 17.2.5.5. Financials (Based on Availability)
- 17.2.6 Suntory Beverages & Food Limited
- 17.2.6.1. Overview
- 17.2.6.2. Products
- 17.2.6.3. SWOT Analysis
- 17.2.6.4. Recent Developments
- 17.2.6.5. Financials (Based on Availability)
- 17.2.7 Brown-Forman
- 17.2.7.1. Overview
- 17.2.7.2. Products
- 17.2.7.3. SWOT Analysis
- 17.2.7.4. Recent Developments
- 17.2.7.5. Financials (Based on Availability)
- 17.2.8 Molson Coors Brewing Company
- 17.2.8.1. Overview
- 17.2.8.2. Products
- 17.2.8.3. SWOT Analysis
- 17.2.8.4. Recent Developments
- 17.2.8.5. Financials (Based on Availability)
- 17.2.9 Diageo PLC
- 17.2.9.1. Overview
- 17.2.9.2. Products
- 17.2.9.3. SWOT Analysis
- 17.2.9.4. Recent Developments
- 17.2.9.5. Financials (Based on Availability)
- 17.2.10 The Wine Group LLC
- 17.2.10.1. Overview
- 17.2.10.2. Products
- 17.2.10.3. SWOT Analysis
- 17.2.10.4. Recent Developments
- 17.2.10.5. Financials (Based on Availability)
- 17.2.1 Heineken Holding NV
List of Figures
- Figure 1: Global APAC Alcoholic Drinks Industry Revenue Breakdown (Million, %) by Region 2024 & 2032
- Figure 2: North America APAC Alcoholic Drinks Industry Revenue (Million), by Country 2024 & 2032
- Figure 3: North America APAC Alcoholic Drinks Industry Revenue Share (%), by Country 2024 & 2032
- Figure 4: Europe APAC Alcoholic Drinks Industry Revenue (Million), by Country 2024 & 2032
- Figure 5: Europe APAC Alcoholic Drinks Industry Revenue Share (%), by Country 2024 & 2032
- Figure 6: Asia Pacific APAC Alcoholic Drinks Industry Revenue (Million), by Country 2024 & 2032
- Figure 7: Asia Pacific APAC Alcoholic Drinks Industry Revenue Share (%), by Country 2024 & 2032
- Figure 8: South America APAC Alcoholic Drinks Industry Revenue (Million), by Country 2024 & 2032
- Figure 9: South America APAC Alcoholic Drinks Industry Revenue Share (%), by Country 2024 & 2032
- Figure 10: North America APAC Alcoholic Drinks Industry Revenue (Million), by Country 2024 & 2032
- Figure 11: North America APAC Alcoholic Drinks Industry Revenue Share (%), by Country 2024 & 2032
- Figure 12: MEA APAC Alcoholic Drinks Industry Revenue (Million), by Country 2024 & 2032
- Figure 13: MEA APAC Alcoholic Drinks Industry Revenue Share (%), by Country 2024 & 2032
- Figure 14: China APAC Alcoholic Drinks Industry Revenue (Million), by Product Type 2024 & 2032
- Figure 15: China APAC Alcoholic Drinks Industry Revenue Share (%), by Product Type 2024 & 2032
- Figure 16: China APAC Alcoholic Drinks Industry Revenue (Million), by Distribution Channel 2024 & 2032
- Figure 17: China APAC Alcoholic Drinks Industry Revenue Share (%), by Distribution Channel 2024 & 2032
- Figure 18: China APAC Alcoholic Drinks Industry Revenue (Million), by Geography 2024 & 2032
- Figure 19: China APAC Alcoholic Drinks Industry Revenue Share (%), by Geography 2024 & 2032
- Figure 20: China APAC Alcoholic Drinks Industry Revenue (Million), by Country 2024 & 2032
- Figure 21: China APAC Alcoholic Drinks Industry Revenue Share (%), by Country 2024 & 2032
- Figure 22: Japan APAC Alcoholic Drinks Industry Revenue (Million), by Product Type 2024 & 2032
- Figure 23: Japan APAC Alcoholic Drinks Industry Revenue Share (%), by Product Type 2024 & 2032
- Figure 24: Japan APAC Alcoholic Drinks Industry Revenue (Million), by Distribution Channel 2024 & 2032
- Figure 25: Japan APAC Alcoholic Drinks Industry Revenue Share (%), by Distribution Channel 2024 & 2032
- Figure 26: Japan APAC Alcoholic Drinks Industry Revenue (Million), by Geography 2024 & 2032
- Figure 27: Japan APAC Alcoholic Drinks Industry Revenue Share (%), by Geography 2024 & 2032
- Figure 28: Japan APAC Alcoholic Drinks Industry Revenue (Million), by Country 2024 & 2032
- Figure 29: Japan APAC Alcoholic Drinks Industry Revenue Share (%), by Country 2024 & 2032
- Figure 30: India APAC Alcoholic Drinks Industry Revenue (Million), by Product Type 2024 & 2032
- Figure 31: India APAC Alcoholic Drinks Industry Revenue Share (%), by Product Type 2024 & 2032
- Figure 32: India APAC Alcoholic Drinks Industry Revenue (Million), by Distribution Channel 2024 & 2032
- Figure 33: India APAC Alcoholic Drinks Industry Revenue Share (%), by Distribution Channel 2024 & 2032
- Figure 34: India APAC Alcoholic Drinks Industry Revenue (Million), by Geography 2024 & 2032
- Figure 35: India APAC Alcoholic Drinks Industry Revenue Share (%), by Geography 2024 & 2032
- Figure 36: India APAC Alcoholic Drinks Industry Revenue (Million), by Country 2024 & 2032
- Figure 37: India APAC Alcoholic Drinks Industry Revenue Share (%), by Country 2024 & 2032
- Figure 38: Australia APAC Alcoholic Drinks Industry Revenue (Million), by Product Type 2024 & 2032
- Figure 39: Australia APAC Alcoholic Drinks Industry Revenue Share (%), by Product Type 2024 & 2032
- Figure 40: Australia APAC Alcoholic Drinks Industry Revenue (Million), by Distribution Channel 2024 & 2032
- Figure 41: Australia APAC Alcoholic Drinks Industry Revenue Share (%), by Distribution Channel 2024 & 2032
- Figure 42: Australia APAC Alcoholic Drinks Industry Revenue (Million), by Geography 2024 & 2032
- Figure 43: Australia APAC Alcoholic Drinks Industry Revenue Share (%), by Geography 2024 & 2032
- Figure 44: Australia APAC Alcoholic Drinks Industry Revenue (Million), by Country 2024 & 2032
- Figure 45: Australia APAC Alcoholic Drinks Industry Revenue Share (%), by Country 2024 & 2032
- Figure 46: Rest of Asia Pacific APAC Alcoholic Drinks Industry Revenue (Million), by Product Type 2024 & 2032
- Figure 47: Rest of Asia Pacific APAC Alcoholic Drinks Industry Revenue Share (%), by Product Type 2024 & 2032
- Figure 48: Rest of Asia Pacific APAC Alcoholic Drinks Industry Revenue (Million), by Distribution Channel 2024 & 2032
- Figure 49: Rest of Asia Pacific APAC Alcoholic Drinks Industry Revenue Share (%), by Distribution Channel 2024 & 2032
- Figure 50: Rest of Asia Pacific APAC Alcoholic Drinks Industry Revenue (Million), by Geography 2024 & 2032
- Figure 51: Rest of Asia Pacific APAC Alcoholic Drinks Industry Revenue Share (%), by Geography 2024 & 2032
- Figure 52: Rest of Asia Pacific APAC Alcoholic Drinks Industry Revenue (Million), by Country 2024 & 2032
- Figure 53: Rest of Asia Pacific APAC Alcoholic Drinks Industry Revenue Share (%), by Country 2024 & 2032
List of Tables
- Table 1: Global APAC Alcoholic Drinks Industry Revenue Million Forecast, by Region 2019 & 2032
- Table 2: Global APAC Alcoholic Drinks Industry Revenue Million Forecast, by Product Type 2019 & 2032
- Table 3: Global APAC Alcoholic Drinks Industry Revenue Million Forecast, by Distribution Channel 2019 & 2032
- Table 4: Global APAC Alcoholic Drinks Industry Revenue Million Forecast, by Geography 2019 & 2032
- Table 5: Global APAC Alcoholic Drinks Industry Revenue Million Forecast, by Region 2019 & 2032
- Table 6: Global APAC Alcoholic Drinks Industry Revenue Million Forecast, by Country 2019 & 2032
- Table 7: United States APAC Alcoholic Drinks Industry Revenue (Million) Forecast, by Application 2019 & 2032
- Table 8: Canada APAC Alcoholic Drinks Industry Revenue (Million) Forecast, by Application 2019 & 2032
- Table 9: Mexico APAC Alcoholic Drinks Industry Revenue (Million) Forecast, by Application 2019 & 2032
- Table 10: Global APAC Alcoholic Drinks Industry Revenue Million Forecast, by Country 2019 & 2032
- Table 11: Germany APAC Alcoholic Drinks Industry Revenue (Million) Forecast, by Application 2019 & 2032
- Table 12: United Kingdom APAC Alcoholic Drinks Industry Revenue (Million) Forecast, by Application 2019 & 2032
- Table 13: France APAC Alcoholic Drinks Industry Revenue (Million) Forecast, by Application 2019 & 2032
- Table 14: Spain APAC Alcoholic Drinks Industry Revenue (Million) Forecast, by Application 2019 & 2032
- Table 15: Italy APAC Alcoholic Drinks Industry Revenue (Million) Forecast, by Application 2019 & 2032
- Table 16: Spain APAC Alcoholic Drinks Industry Revenue (Million) Forecast, by Application 2019 & 2032
- Table 17: Belgium APAC Alcoholic Drinks Industry Revenue (Million) Forecast, by Application 2019 & 2032
- Table 18: Netherland APAC Alcoholic Drinks Industry Revenue (Million) Forecast, by Application 2019 & 2032
- Table 19: Nordics APAC Alcoholic Drinks Industry Revenue (Million) Forecast, by Application 2019 & 2032
- Table 20: Rest of Europe APAC Alcoholic Drinks Industry Revenue (Million) Forecast, by Application 2019 & 2032
- Table 21: Global APAC Alcoholic Drinks Industry Revenue Million Forecast, by Country 2019 & 2032
- Table 22: China APAC Alcoholic Drinks Industry Revenue (Million) Forecast, by Application 2019 & 2032
- Table 23: Japan APAC Alcoholic Drinks Industry Revenue (Million) Forecast, by Application 2019 & 2032
- Table 24: India APAC Alcoholic Drinks Industry Revenue (Million) Forecast, by Application 2019 & 2032
- Table 25: South Korea APAC Alcoholic Drinks Industry Revenue (Million) Forecast, by Application 2019 & 2032
- Table 26: Southeast Asia APAC Alcoholic Drinks Industry Revenue (Million) Forecast, by Application 2019 & 2032
- Table 27: Australia APAC Alcoholic Drinks Industry Revenue (Million) Forecast, by Application 2019 & 2032
- Table 28: Indonesia APAC Alcoholic Drinks Industry Revenue (Million) Forecast, by Application 2019 & 2032
- Table 29: Phillipes APAC Alcoholic Drinks Industry Revenue (Million) Forecast, by Application 2019 & 2032
- Table 30: Singapore APAC Alcoholic Drinks Industry Revenue (Million) Forecast, by Application 2019 & 2032
- Table 31: Thailandc APAC Alcoholic Drinks Industry Revenue (Million) Forecast, by Application 2019 & 2032
- Table 32: Rest of Asia Pacific APAC Alcoholic Drinks Industry Revenue (Million) Forecast, by Application 2019 & 2032
- Table 33: Global APAC Alcoholic Drinks Industry Revenue Million Forecast, by Country 2019 & 2032
- Table 34: Brazil APAC Alcoholic Drinks Industry Revenue (Million) Forecast, by Application 2019 & 2032
- Table 35: Argentina APAC Alcoholic Drinks Industry Revenue (Million) Forecast, by Application 2019 & 2032
- Table 36: Peru APAC Alcoholic Drinks Industry Revenue (Million) Forecast, by Application 2019 & 2032
- Table 37: Chile APAC Alcoholic Drinks Industry Revenue (Million) Forecast, by Application 2019 & 2032
- Table 38: Colombia APAC Alcoholic Drinks Industry Revenue (Million) Forecast, by Application 2019 & 2032
- Table 39: Ecuador APAC Alcoholic Drinks Industry Revenue (Million) Forecast, by Application 2019 & 2032
- Table 40: Venezuela APAC Alcoholic Drinks Industry Revenue (Million) Forecast, by Application 2019 & 2032
- Table 41: Rest of South America APAC Alcoholic Drinks Industry Revenue (Million) Forecast, by Application 2019 & 2032
- Table 42: Global APAC Alcoholic Drinks Industry Revenue Million Forecast, by Country 2019 & 2032
- Table 43: United States APAC Alcoholic Drinks Industry Revenue (Million) Forecast, by Application 2019 & 2032
- Table 44: Canada APAC Alcoholic Drinks Industry Revenue (Million) Forecast, by Application 2019 & 2032
- Table 45: Mexico APAC Alcoholic Drinks Industry Revenue (Million) Forecast, by Application 2019 & 2032
- Table 46: Global APAC Alcoholic Drinks Industry Revenue Million Forecast, by Country 2019 & 2032
- Table 47: United Arab Emirates APAC Alcoholic Drinks Industry Revenue (Million) Forecast, by Application 2019 & 2032
- Table 48: Saudi Arabia APAC Alcoholic Drinks Industry Revenue (Million) Forecast, by Application 2019 & 2032
- Table 49: South Africa APAC Alcoholic Drinks Industry Revenue (Million) Forecast, by Application 2019 & 2032
- Table 50: Rest of Middle East and Africa APAC Alcoholic Drinks Industry Revenue (Million) Forecast, by Application 2019 & 2032
- Table 51: Global APAC Alcoholic Drinks Industry Revenue Million Forecast, by Product Type 2019 & 2032
- Table 52: Global APAC Alcoholic Drinks Industry Revenue Million Forecast, by Distribution Channel 2019 & 2032
- Table 53: Global APAC Alcoholic Drinks Industry Revenue Million Forecast, by Geography 2019 & 2032
- Table 54: Global APAC Alcoholic Drinks Industry Revenue Million Forecast, by Country 2019 & 2032
- Table 55: Global APAC Alcoholic Drinks Industry Revenue Million Forecast, by Product Type 2019 & 2032
- Table 56: Global APAC Alcoholic Drinks Industry Revenue Million Forecast, by Distribution Channel 2019 & 2032
- Table 57: Global APAC Alcoholic Drinks Industry Revenue Million Forecast, by Geography 2019 & 2032
- Table 58: Global APAC Alcoholic Drinks Industry Revenue Million Forecast, by Country 2019 & 2032
- Table 59: Global APAC Alcoholic Drinks Industry Revenue Million Forecast, by Product Type 2019 & 2032
- Table 60: Global APAC Alcoholic Drinks Industry Revenue Million Forecast, by Distribution Channel 2019 & 2032
- Table 61: Global APAC Alcoholic Drinks Industry Revenue Million Forecast, by Geography 2019 & 2032
- Table 62: Global APAC Alcoholic Drinks Industry Revenue Million Forecast, by Country 2019 & 2032
- Table 63: Global APAC Alcoholic Drinks Industry Revenue Million Forecast, by Product Type 2019 & 2032
- Table 64: Global APAC Alcoholic Drinks Industry Revenue Million Forecast, by Distribution Channel 2019 & 2032
- Table 65: Global APAC Alcoholic Drinks Industry Revenue Million Forecast, by Geography 2019 & 2032
- Table 66: Global APAC Alcoholic Drinks Industry Revenue Million Forecast, by Country 2019 & 2032
- Table 67: Global APAC Alcoholic Drinks Industry Revenue Million Forecast, by Product Type 2019 & 2032
- Table 68: Global APAC Alcoholic Drinks Industry Revenue Million Forecast, by Distribution Channel 2019 & 2032
- Table 69: Global APAC Alcoholic Drinks Industry Revenue Million Forecast, by Geography 2019 & 2032
- Table 70: Global APAC Alcoholic Drinks Industry Revenue Million Forecast, by Country 2019 & 2032
Frequently Asked Questions
1. What is the projected Compound Annual Growth Rate (CAGR) of the APAC Alcoholic Drinks Industry?
The projected CAGR is approximately 5.22%.
2. Which companies are prominent players in the APAC Alcoholic Drinks Industry?
Key companies in the market include Heineken Holding NV, Anheuser-Busch InBev, Pernod Ricard*List Not Exhaustive, Radico Khaitan, Bacardi Limited, Suntory Beverages & Food Limited, Brown-Forman, Molson Coors Brewing Company, Diageo PLC, The Wine Group LLC.
3. What are the main segments of the APAC Alcoholic Drinks Industry?
The market segments include Product Type, Distribution Channel, Geography.
4. Can you provide details about the market size?
The market size is estimated to be USD XX Million as of 2022.
5. What are some drivers contributing to market growth?
Convenience Offered By Online Food Delivery Services; Attractive Offers And Memberships Along With Advertisements And Marketing By Players.
6. What are the notable trends driving market growth?
Rising Demand for Cocktails and Other Mixed Drinks.
7. Are there any restraints impacting market growth?
Consumers Desire For Fine Dining Experience.
8. Can you provide examples of recent developments in the market?
In April 2022, Diageo India launched a new single malt whisky and two mixers for its Johnnie Walker and Black & White Scotch brands. The new whisky was created using Rajasthan-specific six-row barley grains and was aged at a heat of more than 100°F.
9. What pricing options are available for accessing the report?
Pricing options include single-user, multi-user, and enterprise licenses priced at USD 4750, USD 5250, and USD 8750 respectively.
10. Is the market size provided in terms of value or volume?
The market size is provided in terms of value, measured in Million.
11. Are there any specific market keywords associated with the report?
Yes, the market keyword associated with the report is "APAC Alcoholic Drinks Industry," which aids in identifying and referencing the specific market segment covered.
12. How do I determine which pricing option suits my needs best?
The pricing options vary based on user requirements and access needs. Individual users may opt for single-user licenses, while businesses requiring broader access may choose multi-user or enterprise licenses for cost-effective access to the report.
13. Are there any additional resources or data provided in the APAC Alcoholic Drinks Industry report?
While the report offers comprehensive insights, it's advisable to review the specific contents or supplementary materials provided to ascertain if additional resources or data are available.
14. How can I stay updated on further developments or reports in the APAC Alcoholic Drinks Industry?
To stay informed about further developments, trends, and reports in the APAC Alcoholic Drinks Industry, consider subscribing to industry newsletters, following relevant companies and organizations, or regularly checking reputable industry news sources and publications.
Methodology
Step 1 - Identification of Relevant Samples Size from Population Database


Step 2 - Approaches for Defining Global Market Size (Value, Volume* & Price*)

Note*: In applicable scenarios
Step 3 - Data Sources
Primary Research
- Web Analytics
- Survey Reports
- Research Institute
- Latest Research Reports
- Opinion Leaders
Secondary Research
- Annual Reports
- White Paper
- Latest Press Release
- Industry Association
- Paid Database
- Investor Presentations

Step 4 - Data Triangulation
Involves using different sources of information in order to increase the validity of a study
These sources are likely to be stakeholders in a program - participants, other researchers, program staff, other community members, and so on.
Then we put all data in single framework & apply various statistical tools to find out the dynamic on the market.
During the analysis stage, feedback from the stakeholder groups would be compared to determine areas of agreement as well as areas of divergence


