
Key Insights
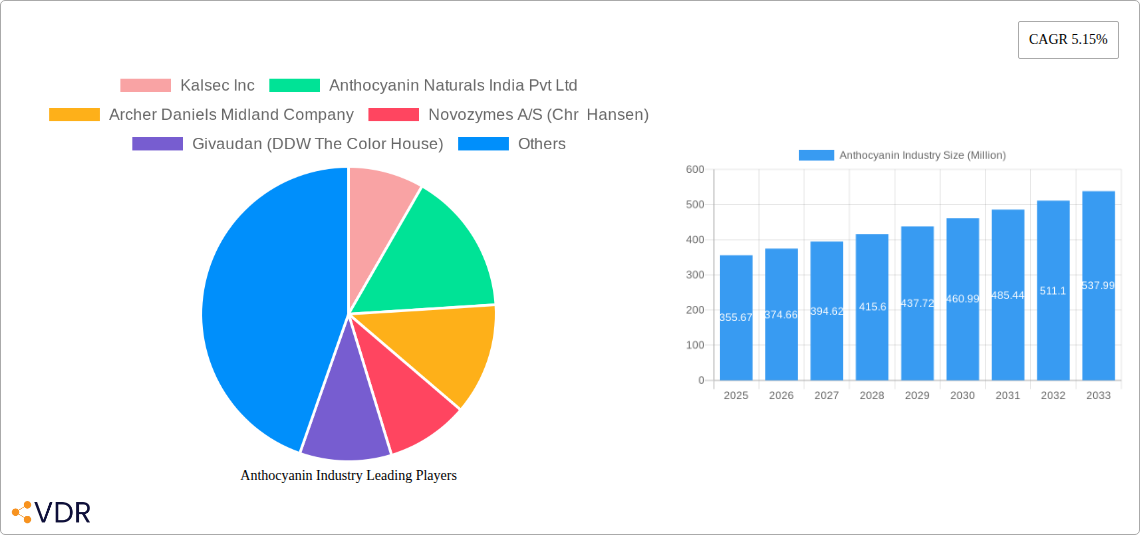
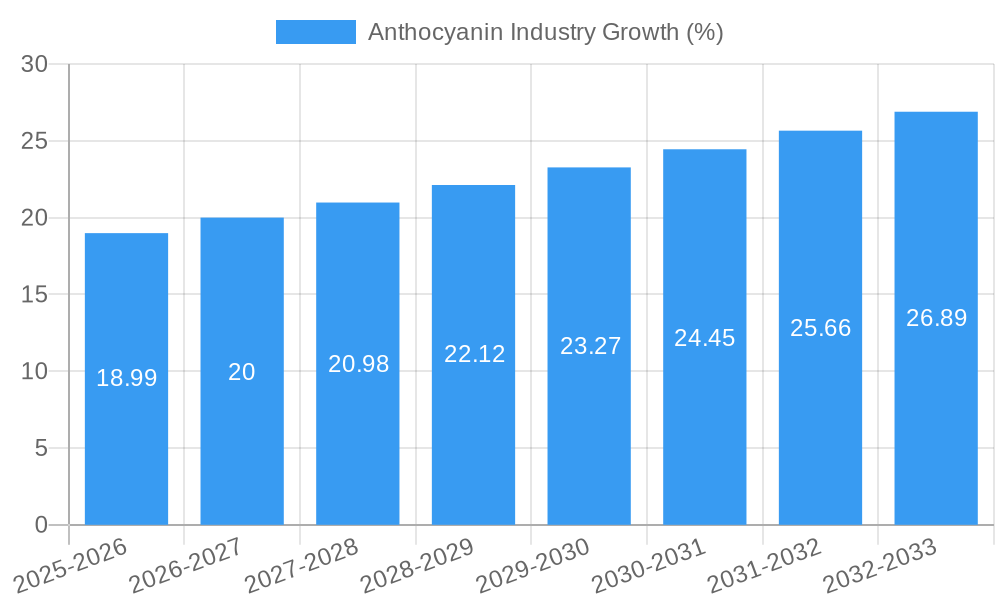
The global anthocyanin market, valued at $355.67 million in 2025, is projected to experience robust growth, driven by increasing demand across diverse sectors. The compound annual growth rate (CAGR) of 5.15% from 2025 to 2033 reflects a consistent upward trajectory fueled by several key factors. The burgeoning food and beverage industry is a primary driver, with anthocyanins increasingly utilized as natural colorants and antioxidants in various products, catering to consumer preferences for clean-label ingredients. Furthermore, the pharmaceutical and personal care sectors are emerging as significant growth avenues, leveraging anthocyanins' potent antioxidant and anti-inflammatory properties in nutraceuticals, cosmetics, and skincare products. The growing awareness of health benefits and the rising adoption of natural ingredients are bolstering market expansion. Specific anthocyanin types, such as cyanidin and malvidin, are experiencing higher demand due to their specific functionalities and bioavailability. While regulatory hurdles and price fluctuations in raw materials may pose some challenges, the overall market outlook remains positive, with significant opportunities for expansion across different geographical regions.
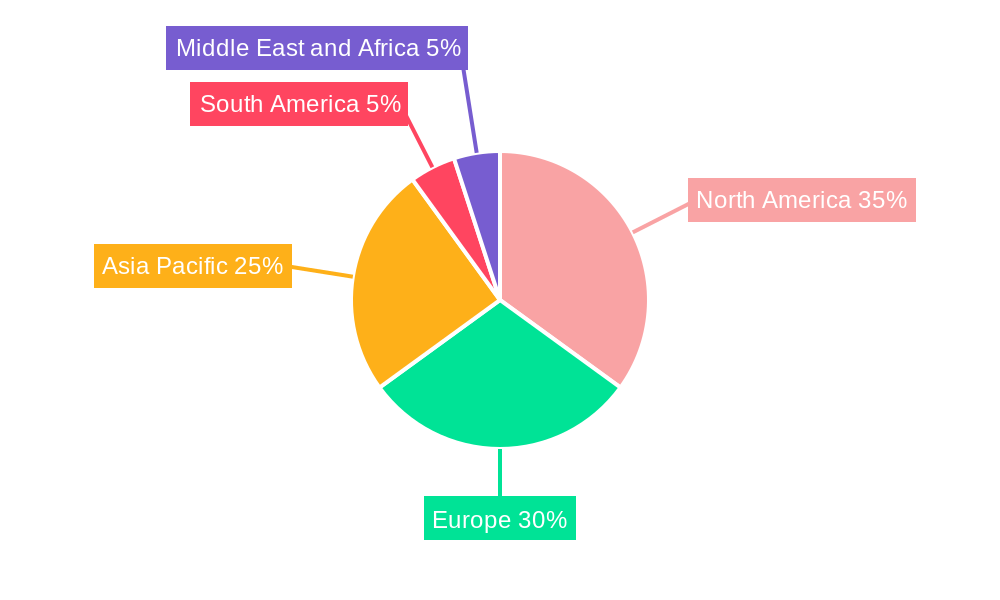
Regional variations in market penetration are anticipated, with North America and Europe currently holding substantial shares due to established markets and high consumer awareness. However, the Asia-Pacific region is poised for significant growth, driven by rising disposable incomes, changing dietary habits, and increasing adoption of natural food ingredients in rapidly developing economies such as China and India. Competitive landscape analysis indicates that key players like Kalsec Inc., Archer Daniels Midland Company, and Givaudan are strategically positioning themselves through research and development, partnerships, and product diversification to maintain their market positions. This robust competitive landscape is expected to further accelerate innovation and market expansion, creating attractive opportunities for both established players and new entrants in the global anthocyanin market.
Anthocyanin Industry Market Report: 2019-2033
This comprehensive report provides a detailed analysis of the Anthocyanin industry, encompassing market dynamics, growth trends, regional dominance, product landscape, and key players. The study period covers 2019-2033, with 2025 as the base and estimated year. This report is crucial for industry professionals, investors, and researchers seeking a deep understanding of this rapidly evolving market. The report's parent market is the natural colorants market, and its child markets include food & beverage, pharmaceuticals, personal care, and animal feed.
Anthocyanin Industry Market Dynamics & Structure
The Anthocyanin industry exhibits a moderately consolidated market structure, with several key players holding significant market share. Technological innovation, particularly in extraction and purification methods, is a major driver, while stringent regulatory frameworks concerning food safety and purity influence market dynamics. Competitive pressure from synthetic colorants exists, but the growing consumer preference for natural and clean-label products presents significant opportunities. Mergers and acquisitions (M&A) activity is moderate, reflecting industry consolidation and the pursuit of scale and technological capabilities.
- Market Concentration: Moderately consolidated, with top 10 players holding approximately xx% of the market share in 2024.
- Technological Innovation: Focus on sustainable extraction, improved stability, and wider application range.
- Regulatory Framework: Stringent regulations regarding purity, safety, and labeling in various regions.
- Competitive Substitutes: Synthetic colorants pose a challenge, but consumer demand for natural alternatives is increasing.
- End-User Demographics: Growing health-conscious consumers and demand for natural ingredients drive market growth.
- M&A Trends: Moderate M&A activity, driven by expansion and technological acquisition. xx deals were recorded between 2019 and 2024.
Anthocyanin Industry Growth Trends & Insights
The global Anthocyanin market is experiencing robust growth, driven by the increasing demand for natural food colorants across various applications. The market size reached xx Million in 2024 and is projected to reach xx Million by 2033, exhibiting a CAGR of xx% during the forecast period (2025-2033). This growth is fueled by the rising consumer awareness of the health benefits associated with natural ingredients, coupled with stricter regulations on synthetic colorants in multiple geographies. Technological advancements in extraction and stabilization methods are further accelerating market penetration. Shifting consumer preferences toward clean-label products and a growing demand for functional foods are key factors propelling market adoption.
Dominant Regions, Countries, or Segments in Anthocyanin Industry
North America and Europe currently dominate the Anthocyanin market, driven by high consumer awareness and demand for natural ingredients. However, the Asia-Pacific region is exhibiting the fastest growth, owing to increasing disposable incomes, changing dietary habits, and expanding food and beverage industries. Within segments, the Food & Beverage application holds the largest market share, followed by the Pharmaceutical and Personal Care sectors. Cyanidin and Malvidin are the dominant types, accounting for xx% of the total market in 2024.
- Key Drivers: Rising disposable incomes, increasing health awareness, growing demand for natural food colorants.
- Dominance Factors: Established regulatory frameworks, robust food processing industries, high consumer spending power.
- Growth Potential: Asia-Pacific region displays the highest growth potential due to rapidly expanding food and beverage industries and increasing consumer demand.
Anthocyanin Industry Product Landscape
The Anthocyanin product landscape is characterized by diverse product forms, including powders, liquids, and extracts, each tailored to specific application requirements. Innovations focus on improving color stability, enhancing solubility, and expanding the range of achievable hues. Key selling propositions include natural origin, clean label appeal, and health-promoting properties. Technological advancements in extraction techniques, such as supercritical fluid extraction, ensure high purity and consistent quality.
Key Drivers, Barriers & Challenges in Anthocyanin Industry
Key Drivers: Growing demand for natural colors in food & beverages, increasing health consciousness, stringent regulations on synthetic dyes, and advancements in extraction technologies drive market growth.
Challenges & Restraints: Price volatility of raw materials, inconsistent color stability, relatively high production costs compared to synthetic alternatives, and complex regulatory landscape in certain regions present challenges. The impact of these restraints is estimated to reduce market growth by approximately xx% during the forecast period.
Emerging Opportunities in Anthocyanin Industry
Emerging opportunities lie in expanding into untapped markets, particularly in developing economies. Innovative applications in nutraceuticals and cosmeceuticals present significant potential. Consumer demand for personalized nutrition and functional foods creates a burgeoning market for Anthocyanin-enriched products. Further opportunities exist in developing more sustainable and eco-friendly extraction methods.
Growth Accelerators in the Anthocyanin Industry
Technological breakthroughs in extraction and stabilization are crucial growth catalysts. Strategic partnerships between Anthocyanin producers and food & beverage companies will unlock market access and accelerate product innovation. Expanding into new applications like animal feed and pharmaceuticals presents significant growth opportunities.
Key Players Shaping the Anthocyanin Industry Market
- Kalsec Inc
- Anthocyanin Naturals India Pvt Ltd
- Archer Daniels Midland Company
- Novozymes A/S (Chr Hansen)
- Givaudan (DDW The Color House)
- GNT Group B V
- Synthite Industries Ltd
- Symrise AG
- Sensient Technologies Corporation
- Döhler Group SE
*List Not Exhaustive
Notable Milestones in Anthocyanin Industry Sector
- September 2022: Givaudan Active Beauty launched New Purple 2364, a vegan and sustainable makeup pigment.
- October 2021: GNT Group invested USD 30 million to expand its North American operations.
- April 2021: Chr. Hansen acquired SECNA Natural Ingredients Group S.L., expanding its natural color portfolio.
In-Depth Anthocyanin Industry Market Outlook
The Anthocyanin industry is poised for continued robust growth, driven by escalating demand for natural colors, coupled with technological advancements that enhance product quality and expand application possibilities. Strategic partnerships and investments in research and development will further fuel market expansion. Exploring untapped markets and developing innovative product formulations will unlock significant long-term growth potential.
Anthocyanin Industry Segmentation
-
1. Type
- 1.1. Cyanidin
- 1.2. Malvidin
- 1.3. Delphinidin
- 1.4. Peonidin
- 1.5. Other Types
-
2. Application
-
2.1. Food & Beverage
- 2.1.1. Bakery & Confectionery
- 2.1.2. Dairy-based products
- 2.1.3. Beverages
- 2.1.4. Other Applications
- 2.2. Pharmaceutical
- 2.3. Personal Care
- 2.4. Animal Feed
-
2.1. Food & Beverage
Anthocyanin Industry Segmentation By Geography
-
1. North America
- 1.1. United States
- 1.2. Canada
- 1.3. Mexico
- 1.4. Rest of North America
-
2. Europe
- 2.1. Spain
- 2.2. United Kingdom
- 2.3. Germany
- 2.4. France
- 2.5. Italy
- 2.6. Russia
- 2.7. Rest of Europe
-
3. Asia Pacific
- 3.1. China
- 3.2. Japan
- 3.3. India
- 3.4. Australia
- 3.5. Rest of Asia Pacific
-
4. South America
- 4.1. Brazil
- 4.2. Argentina
- 4.3. Rest of South America
-
5. Middle East and Africa
- 5.1. South Africa
- 5.2. Saudi Arabia
- 5.3. Rest of Middle East and Africa
Anthocyanin Industry REPORT HIGHLIGHTS
| Aspects | Details |
|---|---|
| Study Period | 2019-2033 |
| Base Year | 2024 |
| Estimated Year | 2025 |
| Forecast Period | 2025-2033 |
| Historical Period | 2019-2024 |
| Growth Rate | CAGR of 5.15% from 2019-2033 |
| Segmentation |
|
Table of Contents
- 1. Introduction
- 1.1. Research Scope
- 1.2. Market Segmentation
- 1.3. Research Methodology
- 1.4. Definitions and Assumptions
- 2. Executive Summary
- 2.1. Introduction
- 3. Market Dynamics
- 3.1. Introduction
- 3.2. Market Drivers
- 3.2.1. Increasing Consumer Awareness Regarding Natural Products; Growing Demand for Anthocyanin in Pharmaceutical Industry
- 3.3. Market Restrains
- 3.3.1. Easy Availability of Synthetic Food Colorant
- 3.4. Market Trends
- 3.4.1. Increasing Consumer Awareness Regarding Natural Products
- 4. Market Factor Analysis
- 4.1. Porters Five Forces
- 4.2. Supply/Value Chain
- 4.3. PESTEL analysis
- 4.4. Market Entropy
- 4.5. Patent/Trademark Analysis
- 5. Global Anthocyanin Industry Analysis, Insights and Forecast, 2019-2031
- 5.1. Market Analysis, Insights and Forecast - by Type
- 5.1.1. Cyanidin
- 5.1.2. Malvidin
- 5.1.3. Delphinidin
- 5.1.4. Peonidin
- 5.1.5. Other Types
- 5.2. Market Analysis, Insights and Forecast - by Application
- 5.2.1. Food & Beverage
- 5.2.1.1. Bakery & Confectionery
- 5.2.1.2. Dairy-based products
- 5.2.1.3. Beverages
- 5.2.1.4. Other Applications
- 5.2.2. Pharmaceutical
- 5.2.3. Personal Care
- 5.2.4. Animal Feed
- 5.2.1. Food & Beverage
- 5.3. Market Analysis, Insights and Forecast - by Region
- 5.3.1. North America
- 5.3.2. Europe
- 5.3.3. Asia Pacific
- 5.3.4. South America
- 5.3.5. Middle East and Africa
- 5.1. Market Analysis, Insights and Forecast - by Type
- 6. North America Anthocyanin Industry Analysis, Insights and Forecast, 2019-2031
- 6.1. Market Analysis, Insights and Forecast - by Type
- 6.1.1. Cyanidin
- 6.1.2. Malvidin
- 6.1.3. Delphinidin
- 6.1.4. Peonidin
- 6.1.5. Other Types
- 6.2. Market Analysis, Insights and Forecast - by Application
- 6.2.1. Food & Beverage
- 6.2.1.1. Bakery & Confectionery
- 6.2.1.2. Dairy-based products
- 6.2.1.3. Beverages
- 6.2.1.4. Other Applications
- 6.2.2. Pharmaceutical
- 6.2.3. Personal Care
- 6.2.4. Animal Feed
- 6.2.1. Food & Beverage
- 6.1. Market Analysis, Insights and Forecast - by Type
- 7. Europe Anthocyanin Industry Analysis, Insights and Forecast, 2019-2031
- 7.1. Market Analysis, Insights and Forecast - by Type
- 7.1.1. Cyanidin
- 7.1.2. Malvidin
- 7.1.3. Delphinidin
- 7.1.4. Peonidin
- 7.1.5. Other Types
- 7.2. Market Analysis, Insights and Forecast - by Application
- 7.2.1. Food & Beverage
- 7.2.1.1. Bakery & Confectionery
- 7.2.1.2. Dairy-based products
- 7.2.1.3. Beverages
- 7.2.1.4. Other Applications
- 7.2.2. Pharmaceutical
- 7.2.3. Personal Care
- 7.2.4. Animal Feed
- 7.2.1. Food & Beverage
- 7.1. Market Analysis, Insights and Forecast - by Type
- 8. Asia Pacific Anthocyanin Industry Analysis, Insights and Forecast, 2019-2031
- 8.1. Market Analysis, Insights and Forecast - by Type
- 8.1.1. Cyanidin
- 8.1.2. Malvidin
- 8.1.3. Delphinidin
- 8.1.4. Peonidin
- 8.1.5. Other Types
- 8.2. Market Analysis, Insights and Forecast - by Application
- 8.2.1. Food & Beverage
- 8.2.1.1. Bakery & Confectionery
- 8.2.1.2. Dairy-based products
- 8.2.1.3. Beverages
- 8.2.1.4. Other Applications
- 8.2.2. Pharmaceutical
- 8.2.3. Personal Care
- 8.2.4. Animal Feed
- 8.2.1. Food & Beverage
- 8.1. Market Analysis, Insights and Forecast - by Type
- 9. South America Anthocyanin Industry Analysis, Insights and Forecast, 2019-2031
- 9.1. Market Analysis, Insights and Forecast - by Type
- 9.1.1. Cyanidin
- 9.1.2. Malvidin
- 9.1.3. Delphinidin
- 9.1.4. Peonidin
- 9.1.5. Other Types
- 9.2. Market Analysis, Insights and Forecast - by Application
- 9.2.1. Food & Beverage
- 9.2.1.1. Bakery & Confectionery
- 9.2.1.2. Dairy-based products
- 9.2.1.3. Beverages
- 9.2.1.4. Other Applications
- 9.2.2. Pharmaceutical
- 9.2.3. Personal Care
- 9.2.4. Animal Feed
- 9.2.1. Food & Beverage
- 9.1. Market Analysis, Insights and Forecast - by Type
- 10. Middle East and Africa Anthocyanin Industry Analysis, Insights and Forecast, 2019-2031
- 10.1. Market Analysis, Insights and Forecast - by Type
- 10.1.1. Cyanidin
- 10.1.2. Malvidin
- 10.1.3. Delphinidin
- 10.1.4. Peonidin
- 10.1.5. Other Types
- 10.2. Market Analysis, Insights and Forecast - by Application
- 10.2.1. Food & Beverage
- 10.2.1.1. Bakery & Confectionery
- 10.2.1.2. Dairy-based products
- 10.2.1.3. Beverages
- 10.2.1.4. Other Applications
- 10.2.2. Pharmaceutical
- 10.2.3. Personal Care
- 10.2.4. Animal Feed
- 10.2.1. Food & Beverage
- 10.1. Market Analysis, Insights and Forecast - by Type
- 11. North America Anthocyanin Industry Analysis, Insights and Forecast, 2019-2031
- 11.1. Market Analysis, Insights and Forecast - By Country/Sub-region
- 11.1.1 United States
- 11.1.2 Canada
- 11.1.3 Mexico
- 11.1.4 Rest of North America
- 12. Europe Anthocyanin Industry Analysis, Insights and Forecast, 2019-2031
- 12.1. Market Analysis, Insights and Forecast - By Country/Sub-region
- 12.1.1 Spain
- 12.1.2 United Kingdom
- 12.1.3 Germany
- 12.1.4 France
- 12.1.5 Italy
- 12.1.6 Russia
- 12.1.7 Rest of Europe
- 13. Asia Pacific Anthocyanin Industry Analysis, Insights and Forecast, 2019-2031
- 13.1. Market Analysis, Insights and Forecast - By Country/Sub-region
- 13.1.1 China
- 13.1.2 Japan
- 13.1.3 India
- 13.1.4 Australia
- 13.1.5 Rest of Asia Pacific
- 14. South America Anthocyanin Industry Analysis, Insights and Forecast, 2019-2031
- 14.1. Market Analysis, Insights and Forecast - By Country/Sub-region
- 14.1.1 Brazil
- 14.1.2 Argentina
- 14.1.3 Rest of South America
- 15. Middle East and Africa Anthocyanin Industry Analysis, Insights and Forecast, 2019-2031
- 15.1. Market Analysis, Insights and Forecast - By Country/Sub-region
- 15.1.1 South Africa
- 15.1.2 Saudi Arabia
- 15.1.3 Rest of Middle East and Africa
- 16. Competitive Analysis
- 16.1. Global Market Share Analysis 2024
- 16.2. Company Profiles
- 16.2.1 Kalsec Inc
- 16.2.1.1. Overview
- 16.2.1.2. Products
- 16.2.1.3. SWOT Analysis
- 16.2.1.4. Recent Developments
- 16.2.1.5. Financials (Based on Availability)
- 16.2.2 Anthocyanin Naturals India Pvt Ltd
- 16.2.2.1. Overview
- 16.2.2.2. Products
- 16.2.2.3. SWOT Analysis
- 16.2.2.4. Recent Developments
- 16.2.2.5. Financials (Based on Availability)
- 16.2.3 Archer Daniels Midland Company
- 16.2.3.1. Overview
- 16.2.3.2. Products
- 16.2.3.3. SWOT Analysis
- 16.2.3.4. Recent Developments
- 16.2.3.5. Financials (Based on Availability)
- 16.2.4 Novozymes A/S (Chr Hansen)
- 16.2.4.1. Overview
- 16.2.4.2. Products
- 16.2.4.3. SWOT Analysis
- 16.2.4.4. Recent Developments
- 16.2.4.5. Financials (Based on Availability)
- 16.2.5 Givaudan (DDW The Color House)
- 16.2.5.1. Overview
- 16.2.5.2. Products
- 16.2.5.3. SWOT Analysis
- 16.2.5.4. Recent Developments
- 16.2.5.5. Financials (Based on Availability)
- 16.2.6 GNT Group B V
- 16.2.6.1. Overview
- 16.2.6.2. Products
- 16.2.6.3. SWOT Analysis
- 16.2.6.4. Recent Developments
- 16.2.6.5. Financials (Based on Availability)
- 16.2.7 Synthite Industries Ltd
- 16.2.7.1. Overview
- 16.2.7.2. Products
- 16.2.7.3. SWOT Analysis
- 16.2.7.4. Recent Developments
- 16.2.7.5. Financials (Based on Availability)
- 16.2.8 Symrise AG
- 16.2.8.1. Overview
- 16.2.8.2. Products
- 16.2.8.3. SWOT Analysis
- 16.2.8.4. Recent Developments
- 16.2.8.5. Financials (Based on Availability)
- 16.2.9 Sensient Technologies Corporation
- 16.2.9.1. Overview
- 16.2.9.2. Products
- 16.2.9.3. SWOT Analysis
- 16.2.9.4. Recent Developments
- 16.2.9.5. Financials (Based on Availability)
- 16.2.10 Döhler Group SE*List Not Exhaustive
- 16.2.10.1. Overview
- 16.2.10.2. Products
- 16.2.10.3. SWOT Analysis
- 16.2.10.4. Recent Developments
- 16.2.10.5. Financials (Based on Availability)
- 16.2.1 Kalsec Inc
List of Figures
- Figure 1: Global Anthocyanin Industry Revenue Breakdown (Million, %) by Region 2024 & 2032
- Figure 2: North America Anthocyanin Industry Revenue (Million), by Country 2024 & 2032
- Figure 3: North America Anthocyanin Industry Revenue Share (%), by Country 2024 & 2032
- Figure 4: Europe Anthocyanin Industry Revenue (Million), by Country 2024 & 2032
- Figure 5: Europe Anthocyanin Industry Revenue Share (%), by Country 2024 & 2032
- Figure 6: Asia Pacific Anthocyanin Industry Revenue (Million), by Country 2024 & 2032
- Figure 7: Asia Pacific Anthocyanin Industry Revenue Share (%), by Country 2024 & 2032
- Figure 8: South America Anthocyanin Industry Revenue (Million), by Country 2024 & 2032
- Figure 9: South America Anthocyanin Industry Revenue Share (%), by Country 2024 & 2032
- Figure 10: Middle East and Africa Anthocyanin Industry Revenue (Million), by Country 2024 & 2032
- Figure 11: Middle East and Africa Anthocyanin Industry Revenue Share (%), by Country 2024 & 2032
- Figure 12: North America Anthocyanin Industry Revenue (Million), by Type 2024 & 2032
- Figure 13: North America Anthocyanin Industry Revenue Share (%), by Type 2024 & 2032
- Figure 14: North America Anthocyanin Industry Revenue (Million), by Application 2024 & 2032
- Figure 15: North America Anthocyanin Industry Revenue Share (%), by Application 2024 & 2032
- Figure 16: North America Anthocyanin Industry Revenue (Million), by Country 2024 & 2032
- Figure 17: North America Anthocyanin Industry Revenue Share (%), by Country 2024 & 2032
- Figure 18: Europe Anthocyanin Industry Revenue (Million), by Type 2024 & 2032
- Figure 19: Europe Anthocyanin Industry Revenue Share (%), by Type 2024 & 2032
- Figure 20: Europe Anthocyanin Industry Revenue (Million), by Application 2024 & 2032
- Figure 21: Europe Anthocyanin Industry Revenue Share (%), by Application 2024 & 2032
- Figure 22: Europe Anthocyanin Industry Revenue (Million), by Country 2024 & 2032
- Figure 23: Europe Anthocyanin Industry Revenue Share (%), by Country 2024 & 2032
- Figure 24: Asia Pacific Anthocyanin Industry Revenue (Million), by Type 2024 & 2032
- Figure 25: Asia Pacific Anthocyanin Industry Revenue Share (%), by Type 2024 & 2032
- Figure 26: Asia Pacific Anthocyanin Industry Revenue (Million), by Application 2024 & 2032
- Figure 27: Asia Pacific Anthocyanin Industry Revenue Share (%), by Application 2024 & 2032
- Figure 28: Asia Pacific Anthocyanin Industry Revenue (Million), by Country 2024 & 2032
- Figure 29: Asia Pacific Anthocyanin Industry Revenue Share (%), by Country 2024 & 2032
- Figure 30: South America Anthocyanin Industry Revenue (Million), by Type 2024 & 2032
- Figure 31: South America Anthocyanin Industry Revenue Share (%), by Type 2024 & 2032
- Figure 32: South America Anthocyanin Industry Revenue (Million), by Application 2024 & 2032
- Figure 33: South America Anthocyanin Industry Revenue Share (%), by Application 2024 & 2032
- Figure 34: South America Anthocyanin Industry Revenue (Million), by Country 2024 & 2032
- Figure 35: South America Anthocyanin Industry Revenue Share (%), by Country 2024 & 2032
- Figure 36: Middle East and Africa Anthocyanin Industry Revenue (Million), by Type 2024 & 2032
- Figure 37: Middle East and Africa Anthocyanin Industry Revenue Share (%), by Type 2024 & 2032
- Figure 38: Middle East and Africa Anthocyanin Industry Revenue (Million), by Application 2024 & 2032
- Figure 39: Middle East and Africa Anthocyanin Industry Revenue Share (%), by Application 2024 & 2032
- Figure 40: Middle East and Africa Anthocyanin Industry Revenue (Million), by Country 2024 & 2032
- Figure 41: Middle East and Africa Anthocyanin Industry Revenue Share (%), by Country 2024 & 2032
List of Tables
- Table 1: Global Anthocyanin Industry Revenue Million Forecast, by Region 2019 & 2032
- Table 2: Global Anthocyanin Industry Revenue Million Forecast, by Type 2019 & 2032
- Table 3: Global Anthocyanin Industry Revenue Million Forecast, by Application 2019 & 2032
- Table 4: Global Anthocyanin Industry Revenue Million Forecast, by Region 2019 & 2032
- Table 5: Global Anthocyanin Industry Revenue Million Forecast, by Country 2019 & 2032
- Table 6: United States Anthocyanin Industry Revenue (Million) Forecast, by Application 2019 & 2032
- Table 7: Canada Anthocyanin Industry Revenue (Million) Forecast, by Application 2019 & 2032
- Table 8: Mexico Anthocyanin Industry Revenue (Million) Forecast, by Application 2019 & 2032
- Table 9: Rest of North America Anthocyanin Industry Revenue (Million) Forecast, by Application 2019 & 2032
- Table 10: Global Anthocyanin Industry Revenue Million Forecast, by Country 2019 & 2032
- Table 11: Spain Anthocyanin Industry Revenue (Million) Forecast, by Application 2019 & 2032
- Table 12: United Kingdom Anthocyanin Industry Revenue (Million) Forecast, by Application 2019 & 2032
- Table 13: Germany Anthocyanin Industry Revenue (Million) Forecast, by Application 2019 & 2032
- Table 14: France Anthocyanin Industry Revenue (Million) Forecast, by Application 2019 & 2032
- Table 15: Italy Anthocyanin Industry Revenue (Million) Forecast, by Application 2019 & 2032
- Table 16: Russia Anthocyanin Industry Revenue (Million) Forecast, by Application 2019 & 2032
- Table 17: Rest of Europe Anthocyanin Industry Revenue (Million) Forecast, by Application 2019 & 2032
- Table 18: Global Anthocyanin Industry Revenue Million Forecast, by Country 2019 & 2032
- Table 19: China Anthocyanin Industry Revenue (Million) Forecast, by Application 2019 & 2032
- Table 20: Japan Anthocyanin Industry Revenue (Million) Forecast, by Application 2019 & 2032
- Table 21: India Anthocyanin Industry Revenue (Million) Forecast, by Application 2019 & 2032
- Table 22: Australia Anthocyanin Industry Revenue (Million) Forecast, by Application 2019 & 2032
- Table 23: Rest of Asia Pacific Anthocyanin Industry Revenue (Million) Forecast, by Application 2019 & 2032
- Table 24: Global Anthocyanin Industry Revenue Million Forecast, by Country 2019 & 2032
- Table 25: Brazil Anthocyanin Industry Revenue (Million) Forecast, by Application 2019 & 2032
- Table 26: Argentina Anthocyanin Industry Revenue (Million) Forecast, by Application 2019 & 2032
- Table 27: Rest of South America Anthocyanin Industry Revenue (Million) Forecast, by Application 2019 & 2032
- Table 28: Global Anthocyanin Industry Revenue Million Forecast, by Country 2019 & 2032
- Table 29: South Africa Anthocyanin Industry Revenue (Million) Forecast, by Application 2019 & 2032
- Table 30: Saudi Arabia Anthocyanin Industry Revenue (Million) Forecast, by Application 2019 & 2032
- Table 31: Rest of Middle East and Africa Anthocyanin Industry Revenue (Million) Forecast, by Application 2019 & 2032
- Table 32: Global Anthocyanin Industry Revenue Million Forecast, by Type 2019 & 2032
- Table 33: Global Anthocyanin Industry Revenue Million Forecast, by Application 2019 & 2032
- Table 34: Global Anthocyanin Industry Revenue Million Forecast, by Country 2019 & 2032
- Table 35: United States Anthocyanin Industry Revenue (Million) Forecast, by Application 2019 & 2032
- Table 36: Canada Anthocyanin Industry Revenue (Million) Forecast, by Application 2019 & 2032
- Table 37: Mexico Anthocyanin Industry Revenue (Million) Forecast, by Application 2019 & 2032
- Table 38: Rest of North America Anthocyanin Industry Revenue (Million) Forecast, by Application 2019 & 2032
- Table 39: Global Anthocyanin Industry Revenue Million Forecast, by Type 2019 & 2032
- Table 40: Global Anthocyanin Industry Revenue Million Forecast, by Application 2019 & 2032
- Table 41: Global Anthocyanin Industry Revenue Million Forecast, by Country 2019 & 2032
- Table 42: Spain Anthocyanin Industry Revenue (Million) Forecast, by Application 2019 & 2032
- Table 43: United Kingdom Anthocyanin Industry Revenue (Million) Forecast, by Application 2019 & 2032
- Table 44: Germany Anthocyanin Industry Revenue (Million) Forecast, by Application 2019 & 2032
- Table 45: France Anthocyanin Industry Revenue (Million) Forecast, by Application 2019 & 2032
- Table 46: Italy Anthocyanin Industry Revenue (Million) Forecast, by Application 2019 & 2032
- Table 47: Russia Anthocyanin Industry Revenue (Million) Forecast, by Application 2019 & 2032
- Table 48: Rest of Europe Anthocyanin Industry Revenue (Million) Forecast, by Application 2019 & 2032
- Table 49: Global Anthocyanin Industry Revenue Million Forecast, by Type 2019 & 2032
- Table 50: Global Anthocyanin Industry Revenue Million Forecast, by Application 2019 & 2032
- Table 51: Global Anthocyanin Industry Revenue Million Forecast, by Country 2019 & 2032
- Table 52: China Anthocyanin Industry Revenue (Million) Forecast, by Application 2019 & 2032
- Table 53: Japan Anthocyanin Industry Revenue (Million) Forecast, by Application 2019 & 2032
- Table 54: India Anthocyanin Industry Revenue (Million) Forecast, by Application 2019 & 2032
- Table 55: Australia Anthocyanin Industry Revenue (Million) Forecast, by Application 2019 & 2032
- Table 56: Rest of Asia Pacific Anthocyanin Industry Revenue (Million) Forecast, by Application 2019 & 2032
- Table 57: Global Anthocyanin Industry Revenue Million Forecast, by Type 2019 & 2032
- Table 58: Global Anthocyanin Industry Revenue Million Forecast, by Application 2019 & 2032
- Table 59: Global Anthocyanin Industry Revenue Million Forecast, by Country 2019 & 2032
- Table 60: Brazil Anthocyanin Industry Revenue (Million) Forecast, by Application 2019 & 2032
- Table 61: Argentina Anthocyanin Industry Revenue (Million) Forecast, by Application 2019 & 2032
- Table 62: Rest of South America Anthocyanin Industry Revenue (Million) Forecast, by Application 2019 & 2032
- Table 63: Global Anthocyanin Industry Revenue Million Forecast, by Type 2019 & 2032
- Table 64: Global Anthocyanin Industry Revenue Million Forecast, by Application 2019 & 2032
- Table 65: Global Anthocyanin Industry Revenue Million Forecast, by Country 2019 & 2032
- Table 66: South Africa Anthocyanin Industry Revenue (Million) Forecast, by Application 2019 & 2032
- Table 67: Saudi Arabia Anthocyanin Industry Revenue (Million) Forecast, by Application 2019 & 2032
- Table 68: Rest of Middle East and Africa Anthocyanin Industry Revenue (Million) Forecast, by Application 2019 & 2032
Frequently Asked Questions
1. What is the projected Compound Annual Growth Rate (CAGR) of the Anthocyanin Industry?
The projected CAGR is approximately 5.15%.
2. Which companies are prominent players in the Anthocyanin Industry?
Key companies in the market include Kalsec Inc, Anthocyanin Naturals India Pvt Ltd, Archer Daniels Midland Company, Novozymes A/S (Chr Hansen), Givaudan (DDW The Color House), GNT Group B V, Synthite Industries Ltd, Symrise AG, Sensient Technologies Corporation, Döhler Group SE*List Not Exhaustive.
3. What are the main segments of the Anthocyanin Industry?
The market segments include Type, Application.
4. Can you provide details about the market size?
The market size is estimated to be USD 355.67 Million as of 2022.
5. What are some drivers contributing to market growth?
Increasing Consumer Awareness Regarding Natural Products; Growing Demand for Anthocyanin in Pharmaceutical Industry.
6. What are the notable trends driving market growth?
Increasing Consumer Awareness Regarding Natural Products.
7. Are there any restraints impacting market growth?
Easy Availability of Synthetic Food Colorant.
8. Can you provide examples of recent developments in the market?
September 2022: Givaudan Active Beauty introduced New Purple 2364, a vegan pigment specifically designed for use in makeup formulations. This sustainable pigment is derived through green fractionation from Raphanus sativus L., adding to Givaudan's portfolio of sustainable alternatives to synthetic pigments. The company initially launched this portfolio in 2020 with the introduction of New Red 1805.
9. What pricing options are available for accessing the report?
Pricing options include single-user, multi-user, and enterprise licenses priced at USD 4750, USD 5250, and USD 8750 respectively.
10. Is the market size provided in terms of value or volume?
The market size is provided in terms of value, measured in Million.
11. Are there any specific market keywords associated with the report?
Yes, the market keyword associated with the report is "Anthocyanin Industry," which aids in identifying and referencing the specific market segment covered.
12. How do I determine which pricing option suits my needs best?
The pricing options vary based on user requirements and access needs. Individual users may opt for single-user licenses, while businesses requiring broader access may choose multi-user or enterprise licenses for cost-effective access to the report.
13. Are there any additional resources or data provided in the Anthocyanin Industry report?
While the report offers comprehensive insights, it's advisable to review the specific contents or supplementary materials provided to ascertain if additional resources or data are available.
14. How can I stay updated on further developments or reports in the Anthocyanin Industry?
To stay informed about further developments, trends, and reports in the Anthocyanin Industry, consider subscribing to industry newsletters, following relevant companies and organizations, or regularly checking reputable industry news sources and publications.
Methodology
Step 1 - Identification of Relevant Samples Size from Population Database


Step 2 - Approaches for Defining Global Market Size (Value, Volume* & Price*)

Note*: In applicable scenarios
Step 3 - Data Sources
Primary Research
- Web Analytics
- Survey Reports
- Research Institute
- Latest Research Reports
- Opinion Leaders
Secondary Research
- Annual Reports
- White Paper
- Latest Press Release
- Industry Association
- Paid Database
- Investor Presentations

Step 4 - Data Triangulation
Involves using different sources of information in order to increase the validity of a study
These sources are likely to be stakeholders in a program - participants, other researchers, program staff, other community members, and so on.
Then we put all data in single framework & apply various statistical tools to find out the dynamic on the market.
During the analysis stage, feedback from the stakeholder groups would be compared to determine areas of agreement as well as areas of divergence


