

Key Insights
The African renewable energy market is experiencing robust growth, driven by increasing energy demand, limited access to reliable electricity grids, and a commitment to sustainable development across the continent. A compound annual growth rate (CAGR) exceeding 8% from 2019 to 2033 indicates a significant expansion of this sector. Key drivers include supportive government policies promoting renewable energy adoption, decreasing costs of renewable energy technologies (particularly solar and wind), and substantial foreign direct investment flowing into large-scale projects. The market is segmented by renewable energy type (solar, wind, hydropower, and others) and application (residential, commercial, industrial, and utilities), with solar and wind power leading the charge due to their scalability and adaptability to diverse geographical locations. While hydropower remains a significant contributor, its development is constrained by environmental concerns and the need for substantial upfront capital investment. Growth is not uniform across the continent, with countries like South Africa, Kenya, and Tanzania leading the way due to their relatively developed infrastructure and proactive regulatory environments. However, substantial potential exists in other regions, highlighting opportunities for further expansion. Challenges remain, including financing constraints for smaller projects, grid infrastructure limitations, and the need for skilled workforce development. Despite these hurdles, the market’s positive trajectory suggests a promising future for renewable energy in Africa.
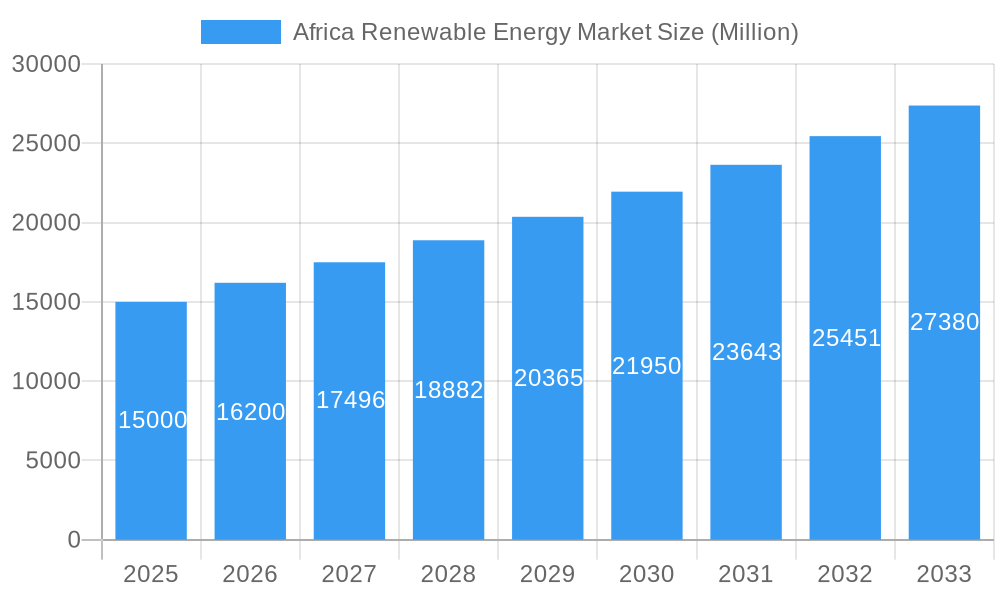
Africa Renewable Energy Market Market Size (In Billion)
The significant growth in the African renewable energy sector is fueled by several key factors. The increasing affordability and efficiency of solar and wind technologies are making them increasingly competitive compared to traditional fossil fuel-based energy sources. Furthermore, the continent's abundant solar and wind resources provide a naturally advantageous environment for renewable energy projects. Major international players are actively investing in the development of large-scale renewable energy projects, contributing significantly to market expansion. This influx of capital is stimulating innovation and fostering the development of a robust renewable energy supply chain within Africa. The growing awareness of climate change and the global push for decarbonization are also creating favorable regulatory environments that support renewable energy development. Specific regional variations in growth are driven by factors such as government policy, economic development levels, and geographical suitability for different renewable energy technologies. Future growth will depend on continued technological advancements, strategic investments, and effective policy frameworks that address challenges like grid integration and financing.
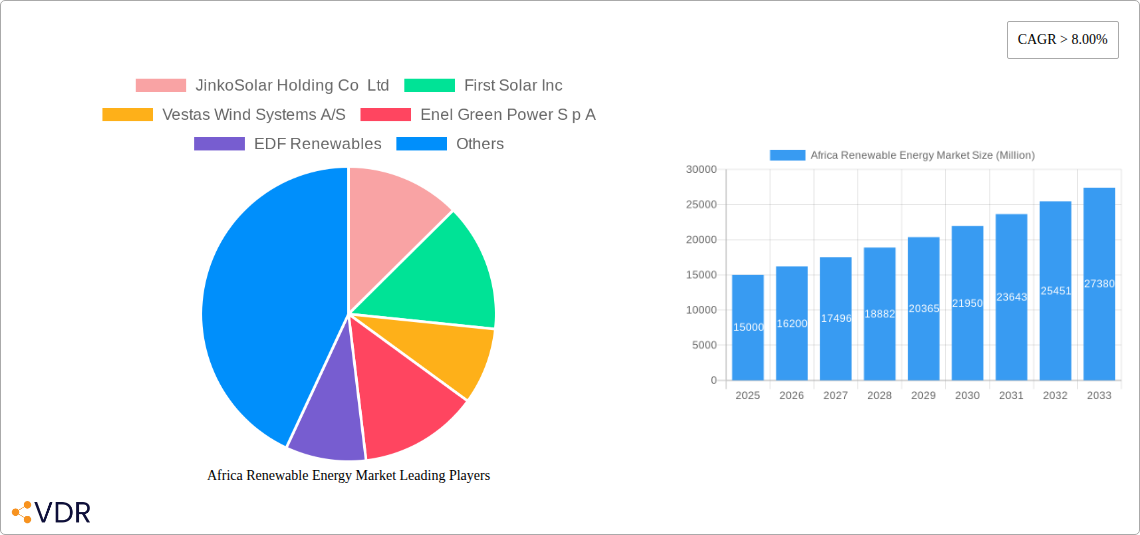
Africa Renewable Energy Market Company Market Share
Africa Renewable Energy Market: A Comprehensive Report (2019-2033)
This in-depth report provides a comprehensive analysis of the burgeoning Africa renewable energy market, encompassing market dynamics, growth trends, key players, and future outlook. With a focus on solar, wind, hydropower, and other renewable energy sources, this report serves as an invaluable resource for investors, industry professionals, and policymakers seeking to navigate this rapidly evolving landscape. The report covers the period 2019-2033, with 2025 as the base year and forecasts extending to 2033. The total market size in 2025 is estimated at xx Million.
Africa Renewable Energy Market Market Dynamics & Structure
The Africa Renewable Energy Market is a dynamic and rapidly evolving landscape characterized by significant growth potential and increasing investment. This section delves into the core aspects of the market's competitive environment, technological progress, regulatory influences, and overarching trends. While historically fragmented, the African renewable energy sector is undergoing substantial consolidation, a trend clearly demonstrated by a rising number of mergers and acquisitions. A confluence of supportive government policies and the pressing need for energy diversification is fueling a surge in both domestic and international investments. The increasing demand for clean, reliable, and affordable energy solutions across the continent underscores the strategic importance of this market.
- Market Concentration: The market is currently characterized by a diverse array of participants, with no single entity holding a dominant position. However, the influence of larger multinational corporations is growing, as they actively engage in acquiring smaller, local players, thereby driving market consolidation. While exact figures fluctuate, the top players are anticipated to hold a significant, though not monopolistic, market share.
- Technological Innovation: Advancements in renewable energy technologies are a primary driver of market expansion. Innovations in solar photovoltaic (PV) efficiency, wind turbine performance, and advanced energy storage solutions are crucial. These innovations are not only reducing the levelized cost of energy (LCOE) but also enhancing the reliability and dispatchability of renewable power, making it increasingly competitive with conventional energy sources.
- Regulatory Frameworks: Government policies and regulations are pivotal in shaping the trajectory of the African renewable energy market. Many African nations have proactively implemented supportive measures such as feed-in tariffs, ambitious renewable energy targets, and streamlined permitting processes. Nevertheless, ensuring regulatory consistency and predictability across different jurisdictions remains a key area for improvement to attract sustained investment.
- Competitive Product Substitutes: The primary substitute for renewable energy sources is still fossil fuel-based electricity generation. However, the escalating costs, environmental impact, and price volatility associated with fossil fuels are increasingly tilting the economic and environmental balance in favor of renewable energy alternatives, particularly solar and wind power.
- End-User Demographics: The demand for renewable energy in Africa is multifaceted, emanating from a broad spectrum of end-users including residential consumers, commercial enterprises, industrial facilities, and utility-scale projects. The specific contribution of each segment is influenced by factors such as the level of economic development, the robustness of existing grid infrastructure, and the accessibility of diverse financing mechanisms.
- M&A Trends: The African renewable energy sector is experiencing a robust wave of mergers and acquisitions (M&A). This heightened M&A activity signifies the burgeoning attractiveness of the market and reflects the strategic intent of both local and international stakeholders to expand their operational footprint and capitalize on emerging opportunities. The total value of M&A deals in recent periods highlights the significant capital flowing into the sector.
Africa Renewable Energy Market Growth Trends & Insights
The African renewable energy market is experiencing robust growth, driven by several factors including increasing energy demand, declining renewable energy costs, supportive government policies, and growing awareness of climate change. The market exhibits a significant growth potential, with considerable untapped capacity across various segments and geographies. Between 2019 and 2024, the market witnessed a CAGR of xx%, and is projected to grow at a CAGR of xx% from 2025 to 2033, reaching xx Million by 2033. This growth is fueled by expanding grid infrastructure, technological advancements, and the increasing adoption of renewable energy solutions across diverse sectors. Technological disruptions such as improvements in battery storage technology are facilitating the wider adoption of intermittent renewable energy sources like solar and wind power.
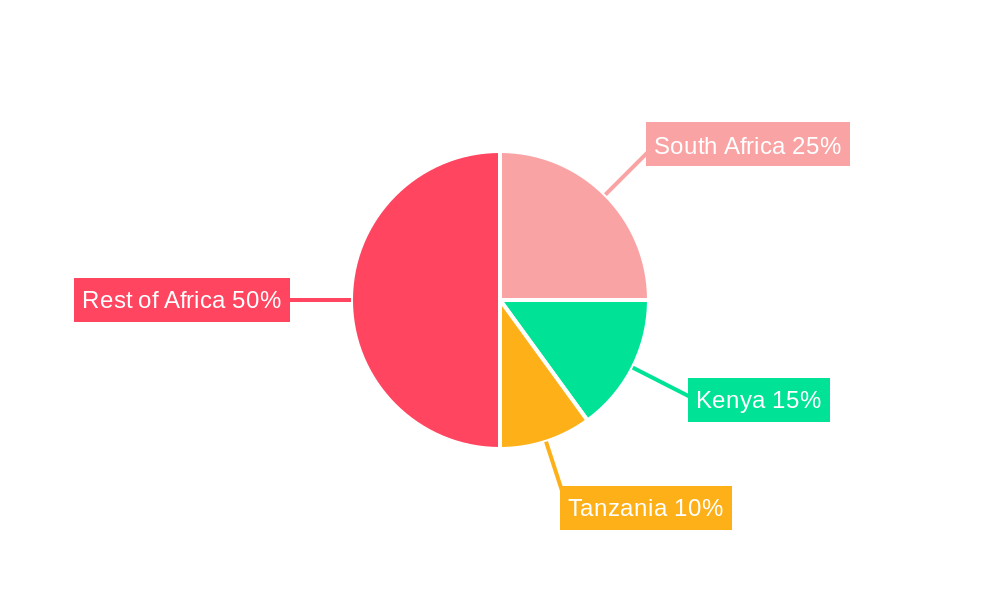
Dominant Regions, Countries, or Segments in Africa Renewable Energy Market
South Africa, Kenya, Egypt, and Morocco are currently leading the African renewable energy market, driven by significant investments in renewable energy projects, supportive government policies, and substantial untapped potential. South Africa, in particular, is a key market due to its well-established regulatory framework, abundant solar and wind resources, and ambitious renewable energy targets.
- Type: Solar PV currently dominates the market, accounting for xx% of the total installed capacity in 2025, followed by wind power with xx% and hydropower with xx%. The "others" segment encompasses geothermal, biomass, and other renewable energy sources, and represents xx% of the total market.
- Application: The utility sector is the largest consumer of renewable energy, followed by the industrial and commercial sectors. Residential applications are also witnessing increased adoption, driven by falling costs and government incentives.
- Key Drivers: Government policies and incentives are playing a significant role in accelerating market growth, while favorable economic conditions, and readily available resources contribute to the overall growth. The need for energy security and improved energy access also act as compelling drivers.
Africa Renewable Energy Market Product Landscape
The product landscape is characterized by diverse technologies, including solar PV, wind turbines, hydropower plants, and various energy storage solutions. Recent technological advancements have focused on improving efficiency, reducing costs, and enhancing reliability. Products are increasingly tailored to specific end-user needs and geographical conditions, showcasing innovations in PV module design, wind turbine technology, and smart grid integration.
Key Drivers, Barriers & Challenges in Africa Renewable Energy Market
Key Drivers:
- Declining costs of renewable energy technologies.
- Increasing energy demand and need for energy security.
- Government policies and incentives promoting renewable energy adoption.
- Growing awareness of climate change and environmental sustainability.
Key Barriers & Challenges:
- High upfront capital costs of renewable energy projects.
- Limited access to financing and investment.
- Inadequate grid infrastructure and transmission capacity.
- Regulatory uncertainty and inconsistencies across different countries.
- Intermittency of renewable energy sources (requiring robust energy storage solutions). This represents approximately xx% of current project delays.
Emerging Opportunities in Africa Renewable Energy Market
- Expansion of mini-grid and off-grid solutions to accelerate rural electrification and enhance energy access for underserved populations.
- Development and deployment of hybrid renewable energy systems that synergistically combine multiple technologies (e.g., solar PV with wind, or storage) to optimize energy generation and reliability.
- Growing demand and investment in advanced energy storage solutions to mitigate the intermittency of renewable sources and ensure grid stability.
- Pioneering the development of green hydrogen and other novel clean energy technologies to further decarbonize the energy mix and create new industrial opportunities.
- Increased focus and funding for renewable energy research and development (R&D) to foster local innovation, adapt technologies to African conditions, and enhance cost-effectiveness.
Growth Accelerators in the Africa Renewable Energy Market Industry
Technological advancements in solar PV and wind turbine technologies continue to be pivotal growth accelerators, driving down costs and enhancing operational efficiency. The formation of strategic partnerships between established international entities and local African companies is instrumental in facilitating technology transfer, building local capacity, and fostering sustainable growth. Furthermore, the expansion and modernization of grid infrastructure, coupled with improved access to diverse and affordable financing options, are critical catalysts that are underpinning the long-term growth trajectory of the Africa renewable energy market.
Key Players Shaping the Africa Renewable Energy Market Market
- JinkoSolar Holding Co Ltd
- First Solar Inc
- Vestas Wind Systems A/S
- Enel Green Power S p A
- EDF Renewables
- Canadian Solar Inc
- Juwi Holding AG
- Hidroeléctrica de Cahora Bassa S A
- Acciona SA
- ACWA Power
Notable Milestones in Africa Renewable Energy Market Sector
- July 2022: Infinity Group and AFC successfully acquired Lekela Power for USD 1.5 billion, thereby establishing Africa's largest renewable energy company and signaling significant investor confidence.
- February 2022: Magnora ASA's acquisition of 92% of African Green Ventures (AGV) significantly expanded its African renewables project pipeline to approximately 1.7 GW, demonstrating strategic expansion in the region.
- September 2021: Eskom unveiled an ambitious USD 7.3 billion investment plan for renewable energy over nine years, including substantial additions of solar and wind power capacity, indicating a major commitment to the energy transition from a key utility.
In-Depth Africa Renewable Energy Market Market Outlook
The African renewable energy market is poised for substantial growth, driven by a confluence of factors including supportive government policies, abundant renewable resources, and increasing energy demand. The market's future potential is particularly significant in areas with limited grid access, where decentralized renewable energy solutions can play a crucial role in improving energy access and fostering economic development. Strategic partnerships, technological breakthroughs, and a continued focus on addressing challenges related to financing and infrastructure will be crucial for realizing the market's full potential.
Africa Renewable Energy Market Segmentation
-
1. Type
- 1.1. Solar
- 1.2. Wind
- 1.3. Hydropower
- 1.4. Others
-
2. Geography
- 2.1. South Africa
- 2.2. Egypt
- 2.3. Nigeria
- 2.4. Morocco
- 2.5. Algeria
- 2.6. Ethiopia
- 2.7. Rest of Africa
Africa Renewable Energy Market Segmentation By Geography
- 1. South Africa
- 2. Egypt
- 3. Nigeria
- 4. Morocco
- 5. Algeria
- 6. Ethiopia
- 7. Rest of Africa
Africa Renewable Energy Market Regional Market Share
Geographic Coverage of Africa Renewable Energy Market
Africa Renewable Energy Market REPORT HIGHLIGHTS
| Aspects | Details |
|---|---|
| Study Period | 2020-2034 |
| Base Year | 2025 |
| Estimated Year | 2026 |
| Forecast Period | 2026-2034 |
| Historical Period | 2020-2025 |
| Growth Rate | CAGR of 14.7% from 2020-2034 |
| Segmentation |
|
Table of Contents
- 1. Introduction
- 1.1. Research Scope
- 1.2. Market Segmentation
- 1.3. Research Objective
- 1.4. Definitions and Assumptions
- 2. Executive Summary
- 2.1. Market Snapshot
- 3. Market Dynamics
- 3.1. Market Drivers
- 3.2. Market Restrains
- 3.3. Market Trends
- 3.4. Market Opportunities
- 4. Market Factor Analysis
- 4.1. Porters Five Forces
- 4.1.1. Bargaining Power of Suppliers
- 4.1.2. Bargaining Power of Buyers
- 4.1.3. Threat of New Entrants
- 4.1.4. Threat of Substitutes
- 4.1.5. Competitive Rivalry
- 4.2. PESTEL analysis
- 4.3. BCG Analysis
- 4.3.1. Stars (High Growth, High Market Share)
- 4.3.2. Cash Cows (Low Growth, High Market Share)
- 4.3.3. Question Mark (High Growth, Low Market Share)
- 4.3.4. Dogs (Low Growth, Low Market Share)
- 4.4. Ansoff Matrix Analysis
- 4.5. Supply Chain Analysis
- 4.6. Regulatory Landscape
- 4.7. Current Market Potential and Opportunity Assessment (TAM–SAM–SOM Framework)
- 4.8. VDR Analyst Note
- 4.1. Porters Five Forces
- 5. Market Analysis, Insights and Forecast 2021-2033
- 5.1. Market Analysis, Insights and Forecast - by Type
- 5.1.1. Solar
- 5.1.2. Wind
- 5.1.3. Hydropower
- 5.1.4. Others
- 5.2. Market Analysis, Insights and Forecast - by Geography
- 5.2.1. South Africa
- 5.2.2. Egypt
- 5.2.3. Nigeria
- 5.2.4. Morocco
- 5.2.5. Algeria
- 5.2.6. Ethiopia
- 5.2.7. Rest of Africa
- 5.3. Market Analysis, Insights and Forecast - by Region
- 5.3.1. South Africa
- 5.3.2. Egypt
- 5.3.3. Nigeria
- 5.3.4. Morocco
- 5.3.5. Algeria
- 5.3.6. Ethiopia
- 5.3.7. Rest of Africa
- 5.1. Market Analysis, Insights and Forecast - by Type
- 6. Africa Renewable Energy Market Analysis, Insights and Forecast, 2021-2033
- 6.1. Market Analysis, Insights and Forecast - by Type
- 6.1.1. Solar
- 6.1.2. Wind
- 6.1.3. Hydropower
- 6.1.4. Others
- 6.2. Market Analysis, Insights and Forecast - by Geography
- 6.2.1. South Africa
- 6.2.2. Egypt
- 6.2.3. Nigeria
- 6.2.4. Morocco
- 6.2.5. Algeria
- 6.2.6. Ethiopia
- 6.2.7. Rest of Africa
- 6.1. Market Analysis, Insights and Forecast - by Type
- 7. South Africa Africa Renewable Energy Market Analysis, Insights and Forecast, 2021-2033
- 7.1. Market Analysis, Insights and Forecast - by Type
- 7.1.1. Solar
- 7.1.2. Wind
- 7.1.3. Hydropower
- 7.1.4. Others
- 7.2. Market Analysis, Insights and Forecast - by Geography
- 7.2.1. South Africa
- 7.2.2. Egypt
- 7.2.3. Nigeria
- 7.2.4. Morocco
- 7.2.5. Algeria
- 7.2.6. Ethiopia
- 7.2.7. Rest of Africa
- 7.1. Market Analysis, Insights and Forecast - by Type
- 8. Egypt Africa Renewable Energy Market Analysis, Insights and Forecast, 2021-2033
- 8.1. Market Analysis, Insights and Forecast - by Type
- 8.1.1. Solar
- 8.1.2. Wind
- 8.1.3. Hydropower
- 8.1.4. Others
- 8.2. Market Analysis, Insights and Forecast - by Geography
- 8.2.1. South Africa
- 8.2.2. Egypt
- 8.2.3. Nigeria
- 8.2.4. Morocco
- 8.2.5. Algeria
- 8.2.6. Ethiopia
- 8.2.7. Rest of Africa
- 8.1. Market Analysis, Insights and Forecast - by Type
- 9. Nigeria Africa Renewable Energy Market Analysis, Insights and Forecast, 2021-2033
- 9.1. Market Analysis, Insights and Forecast - by Type
- 9.1.1. Solar
- 9.1.2. Wind
- 9.1.3. Hydropower
- 9.1.4. Others
- 9.2. Market Analysis, Insights and Forecast - by Geography
- 9.2.1. South Africa
- 9.2.2. Egypt
- 9.2.3. Nigeria
- 9.2.4. Morocco
- 9.2.5. Algeria
- 9.2.6. Ethiopia
- 9.2.7. Rest of Africa
- 9.1. Market Analysis, Insights and Forecast - by Type
- 10. Morocco Africa Renewable Energy Market Analysis, Insights and Forecast, 2021-2033
- 10.1. Market Analysis, Insights and Forecast - by Type
- 10.1.1. Solar
- 10.1.2. Wind
- 10.1.3. Hydropower
- 10.1.4. Others
- 10.2. Market Analysis, Insights and Forecast - by Geography
- 10.2.1. South Africa
- 10.2.2. Egypt
- 10.2.3. Nigeria
- 10.2.4. Morocco
- 10.2.5. Algeria
- 10.2.6. Ethiopia
- 10.2.7. Rest of Africa
- 10.1. Market Analysis, Insights and Forecast - by Type
- 11. Algeria Africa Renewable Energy Market Analysis, Insights and Forecast, 2021-2033
- 11.1. Market Analysis, Insights and Forecast - by Type
- 11.1.1. Solar
- 11.1.2. Wind
- 11.1.3. Hydropower
- 11.1.4. Others
- 11.2. Market Analysis, Insights and Forecast - by Geography
- 11.2.1. South Africa
- 11.2.2. Egypt
- 11.2.3. Nigeria
- 11.2.4. Morocco
- 11.2.5. Algeria
- 11.2.6. Ethiopia
- 11.2.7. Rest of Africa
- 11.1. Market Analysis, Insights and Forecast - by Type
- 12. Ethiopia Africa Renewable Energy Market Analysis, Insights and Forecast, 2021-2033
- 12.1. Market Analysis, Insights and Forecast - by Type
- 12.1.1. Solar
- 12.1.2. Wind
- 12.1.3. Hydropower
- 12.1.4. Others
- 12.2. Market Analysis, Insights and Forecast - by Geography
- 12.2.1. South Africa
- 12.2.2. Egypt
- 12.2.3. Nigeria
- 12.2.4. Morocco
- 12.2.5. Algeria
- 12.2.6. Ethiopia
- 12.2.7. Rest of Africa
- 12.1. Market Analysis, Insights and Forecast - by Type
- 13. Rest of Africa Africa Renewable Energy Market Analysis, Insights and Forecast, 2021-2033
- 13.1. Market Analysis, Insights and Forecast - by Type
- 13.1.1. Solar
- 13.1.2. Wind
- 13.1.3. Hydropower
- 13.1.4. Others
- 13.2. Market Analysis, Insights and Forecast - by Geography
- 13.2.1. South Africa
- 13.2.2. Egypt
- 13.2.3. Nigeria
- 13.2.4. Morocco
- 13.2.5. Algeria
- 13.2.6. Ethiopia
- 13.2.7. Rest of Africa
- 13.1. Market Analysis, Insights and Forecast - by Type
- 14. Competitive Analysis
- 14.1. Company Profiles
- 14.1.1 JinkoSolar Holding Co Ltd
- 14.1.1.1. Company Overview
- 14.1.1.2. Products
- 14.1.1.3. Company Financials
- 14.1.1.4. SWOT Analysis
- 14.1.2 First Solar Inc
- 14.1.2.1. Company Overview
- 14.1.2.2. Products
- 14.1.2.3. Company Financials
- 14.1.2.4. SWOT Analysis
- 14.1.3 Vestas Wind Systems A/S
- 14.1.3.1. Company Overview
- 14.1.3.2. Products
- 14.1.3.3. Company Financials
- 14.1.3.4. SWOT Analysis
- 14.1.4 Enel Green Power S p A
- 14.1.4.1. Company Overview
- 14.1.4.2. Products
- 14.1.4.3. Company Financials
- 14.1.4.4. SWOT Analysis
- 14.1.5 EDF Renewables
- 14.1.5.1. Company Overview
- 14.1.5.2. Products
- 14.1.5.3. Company Financials
- 14.1.5.4. SWOT Analysis
- 14.1.6 Canadian Solar Inc
- 14.1.6.1. Company Overview
- 14.1.6.2. Products
- 14.1.6.3. Company Financials
- 14.1.6.4. SWOT Analysis
- 14.1.7 Juwi Holding AG
- 14.1.7.1. Company Overview
- 14.1.7.2. Products
- 14.1.7.3. Company Financials
- 14.1.7.4. SWOT Analysis
- 14.1.8 Hidroeléctrica de Cahora Bassa S A *List Not Exhaustive
- 14.1.8.1. Company Overview
- 14.1.8.2. Products
- 14.1.8.3. Company Financials
- 14.1.8.4. SWOT Analysis
- 14.1.9 Acciona SA
- 14.1.9.1. Company Overview
- 14.1.9.2. Products
- 14.1.9.3. Company Financials
- 14.1.9.4. SWOT Analysis
- 14.1.10 ACWA Power
- 14.1.10.1. Company Overview
- 14.1.10.2. Products
- 14.1.10.3. Company Financials
- 14.1.10.4. SWOT Analysis
- 14.1.1 JinkoSolar Holding Co Ltd
- 14.2. Market Entropy
- 14.2.1 Company's Key Areas Served
- 14.2.2 Recent Developments
- 14.3. Company Market Share Analysis 2025
- 14.3.1 Top 5 Companies Market Share Analysis
- 14.3.2 Top 3 Companies Market Share Analysis
- 14.4. List of Potential Customers
- 15. Research Methodology
List of Figures
- Figure 1: Africa Renewable Energy Market Revenue Breakdown (undefined, %) by Product 2025 & 2033
- Figure 2: Africa Renewable Energy Market Share (%) by Company 2025
List of Tables
- Table 1: Africa Renewable Energy Market Revenue undefined Forecast, by Type 2020 & 2033
- Table 2: Africa Renewable Energy Market Volume gigawatt Forecast, by Type 2020 & 2033
- Table 3: Africa Renewable Energy Market Revenue undefined Forecast, by Geography 2020 & 2033
- Table 4: Africa Renewable Energy Market Volume gigawatt Forecast, by Geography 2020 & 2033
- Table 5: Africa Renewable Energy Market Revenue undefined Forecast, by Region 2020 & 2033
- Table 6: Africa Renewable Energy Market Volume gigawatt Forecast, by Region 2020 & 2033
- Table 7: Africa Renewable Energy Market Revenue undefined Forecast, by Type 2020 & 2033
- Table 8: Africa Renewable Energy Market Volume gigawatt Forecast, by Type 2020 & 2033
- Table 9: Africa Renewable Energy Market Revenue undefined Forecast, by Geography 2020 & 2033
- Table 10: Africa Renewable Energy Market Volume gigawatt Forecast, by Geography 2020 & 2033
- Table 11: Africa Renewable Energy Market Revenue undefined Forecast, by Country 2020 & 2033
- Table 12: Africa Renewable Energy Market Volume gigawatt Forecast, by Country 2020 & 2033
- Table 13: Africa Renewable Energy Market Revenue undefined Forecast, by Type 2020 & 2033
- Table 14: Africa Renewable Energy Market Volume gigawatt Forecast, by Type 2020 & 2033
- Table 15: Africa Renewable Energy Market Revenue undefined Forecast, by Geography 2020 & 2033
- Table 16: Africa Renewable Energy Market Volume gigawatt Forecast, by Geography 2020 & 2033
- Table 17: Africa Renewable Energy Market Revenue undefined Forecast, by Country 2020 & 2033
- Table 18: Africa Renewable Energy Market Volume gigawatt Forecast, by Country 2020 & 2033
- Table 19: Africa Renewable Energy Market Revenue undefined Forecast, by Type 2020 & 2033
- Table 20: Africa Renewable Energy Market Volume gigawatt Forecast, by Type 2020 & 2033
- Table 21: Africa Renewable Energy Market Revenue undefined Forecast, by Geography 2020 & 2033
- Table 22: Africa Renewable Energy Market Volume gigawatt Forecast, by Geography 2020 & 2033
- Table 23: Africa Renewable Energy Market Revenue undefined Forecast, by Country 2020 & 2033
- Table 24: Africa Renewable Energy Market Volume gigawatt Forecast, by Country 2020 & 2033
- Table 25: Africa Renewable Energy Market Revenue undefined Forecast, by Type 2020 & 2033
- Table 26: Africa Renewable Energy Market Volume gigawatt Forecast, by Type 2020 & 2033
- Table 27: Africa Renewable Energy Market Revenue undefined Forecast, by Geography 2020 & 2033
- Table 28: Africa Renewable Energy Market Volume gigawatt Forecast, by Geography 2020 & 2033
- Table 29: Africa Renewable Energy Market Revenue undefined Forecast, by Country 2020 & 2033
- Table 30: Africa Renewable Energy Market Volume gigawatt Forecast, by Country 2020 & 2033
- Table 31: Africa Renewable Energy Market Revenue undefined Forecast, by Type 2020 & 2033
- Table 32: Africa Renewable Energy Market Volume gigawatt Forecast, by Type 2020 & 2033
- Table 33: Africa Renewable Energy Market Revenue undefined Forecast, by Geography 2020 & 2033
- Table 34: Africa Renewable Energy Market Volume gigawatt Forecast, by Geography 2020 & 2033
- Table 35: Africa Renewable Energy Market Revenue undefined Forecast, by Country 2020 & 2033
- Table 36: Africa Renewable Energy Market Volume gigawatt Forecast, by Country 2020 & 2033
- Table 37: Africa Renewable Energy Market Revenue undefined Forecast, by Type 2020 & 2033
- Table 38: Africa Renewable Energy Market Volume gigawatt Forecast, by Type 2020 & 2033
- Table 39: Africa Renewable Energy Market Revenue undefined Forecast, by Geography 2020 & 2033
- Table 40: Africa Renewable Energy Market Volume gigawatt Forecast, by Geography 2020 & 2033
- Table 41: Africa Renewable Energy Market Revenue undefined Forecast, by Country 2020 & 2033
- Table 42: Africa Renewable Energy Market Volume gigawatt Forecast, by Country 2020 & 2033
- Table 43: Africa Renewable Energy Market Revenue undefined Forecast, by Type 2020 & 2033
- Table 44: Africa Renewable Energy Market Volume gigawatt Forecast, by Type 2020 & 2033
- Table 45: Africa Renewable Energy Market Revenue undefined Forecast, by Geography 2020 & 2033
- Table 46: Africa Renewable Energy Market Volume gigawatt Forecast, by Geography 2020 & 2033
- Table 47: Africa Renewable Energy Market Revenue undefined Forecast, by Country 2020 & 2033
- Table 48: Africa Renewable Energy Market Volume gigawatt Forecast, by Country 2020 & 2033
Frequently Asked Questions
1. What is the projected Compound Annual Growth Rate (CAGR) of the Africa Renewable Energy Market?
The projected CAGR is approximately 14.7%.
2. Which companies are prominent players in the Africa Renewable Energy Market?
Key companies in the market include JinkoSolar Holding Co Ltd, First Solar Inc, Vestas Wind Systems A/S, Enel Green Power S p A, EDF Renewables, Canadian Solar Inc, Juwi Holding AG, Hidroeléctrica de Cahora Bassa S A *List Not Exhaustive, Acciona SA, ACWA Power.
3. What are the main segments of the Africa Renewable Energy Market?
The market segments include Type, Geography.
4. Can you provide details about the market size?
The market size is estimated to be USD XXX N/A as of 2022.
5. What are some drivers contributing to market growth?
4.; Increasing Investment in Upcoming Wind Power Projects4.; Favorable Government Policies.
6. What are the notable trends driving market growth?
Solar Energy is Expected to be the Significant Market.
7. Are there any restraints impacting market growth?
4.; The Growing Adoption of Alternative Energy Sources Such as Gas-Based Power.
8. Can you provide examples of recent developments in the market?
In July 2022, Infinity Group and the Africa Finance Corporation (AFC) agreed to purchase Lekela Power, the largest pure-play renewable IPP operating in Africa. The transaction is valued at an enterprise value of approximately USD 1.5 billion, with closing expected to occur later in 2022. The purchase is expected to bring Lekela's portfolio of more than 1GW of wind power across three African countries and its 1.8GW pipeline of greenfield projects into Infinity. It makes Infinity the largest renewable energy company in Africa.
9. What pricing options are available for accessing the report?
Pricing options include single-user, multi-user, and enterprise licenses priced at USD 4750, USD 5250, and USD 8750 respectively.
10. Is the market size provided in terms of value or volume?
The market size is provided in terms of value, measured in N/A and volume, measured in gigawatt.
11. Are there any specific market keywords associated with the report?
Yes, the market keyword associated with the report is "Africa Renewable Energy Market," which aids in identifying and referencing the specific market segment covered.
12. How do I determine which pricing option suits my needs best?
The pricing options vary based on user requirements and access needs. Individual users may opt for single-user licenses, while businesses requiring broader access may choose multi-user or enterprise licenses for cost-effective access to the report.
13. Are there any additional resources or data provided in the Africa Renewable Energy Market report?
While the report offers comprehensive insights, it's advisable to review the specific contents or supplementary materials provided to ascertain if additional resources or data are available.
14. How can I stay updated on further developments or reports in the Africa Renewable Energy Market?
To stay informed about further developments, trends, and reports in the Africa Renewable Energy Market, consider subscribing to industry newsletters, following relevant companies and organizations, or regularly checking reputable industry news sources and publications.
Methodology
Step 1 - Identification of Relevant Samples Size from Population Database


Step 2 - Approaches for Defining Global Market Size (Value, Volume* & Price*)

Note*: In applicable scenarios
Step 3 - Data Sources
Primary Research
- Web Analytics
- Survey Reports
- Research Institute
- Latest Research Reports
- Opinion Leaders
Secondary Research
- Annual Reports
- White Paper
- Latest Press Release
- Industry Association
- Paid Database
- Investor Presentations

Step 4 - Data Triangulation
Involves using different sources of information in order to increase the validity of a study
These sources are likely to be stakeholders in a program - participants, other researchers, program staff, other community members, and so on.
Then we put all data in single framework & apply various statistical tools to find out the dynamic on the market.
During the analysis stage, feedback from the stakeholder groups would be compared to determine areas of agreement as well as areas of divergence