

Key Insights
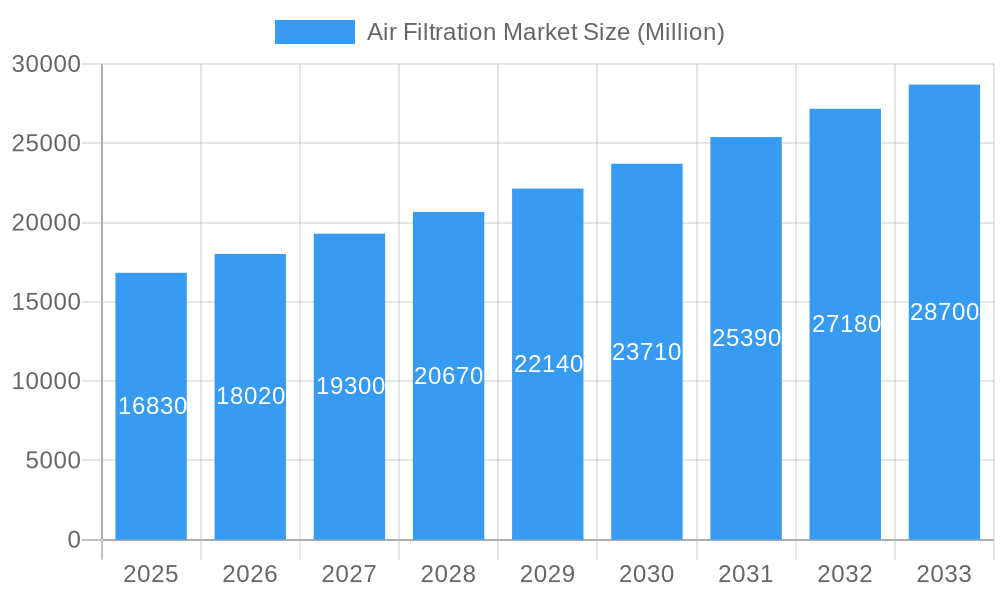
The global air filtration market, valued at $16.83 billion in 2025, is projected to experience robust growth, driven by increasing awareness of indoor air quality (IAQ) and rising prevalence of respiratory illnesses. A compound annual growth rate (CAGR) of 7.00% from 2025 to 2033 indicates a significant expansion, reaching an estimated $28.7 billion by 2033. Key drivers include stringent government regulations on air pollution, growing urbanization leading to increased indoor pollution, and rising disposable incomes enabling consumers to invest in advanced air purification systems. Technological advancements in filtration technologies, such as the development of more efficient HEPA filters and the incorporation of smart features in air purifiers, further fuel market growth. The market is segmented by filtration technology (HEPA, electrostatic precipitators, ionizers, ozone generators), type (stand-alone, in-duct), and end-user (residential, commercial, industrial). The residential segment is expected to dominate, driven by increasing consumer preference for improved home IAQ. However, the commercial and industrial segments are also projected to experience significant growth, fueled by rising demand for clean air in workplaces and manufacturing facilities. Competition is intense, with major players like Daikin, Honeywell, Xiaomi, Coway, and 3M vying for market share through product innovation and strategic partnerships. Geographical expansion, particularly in rapidly developing economies of Asia-Pacific, is also expected to contribute significantly to overall market growth.
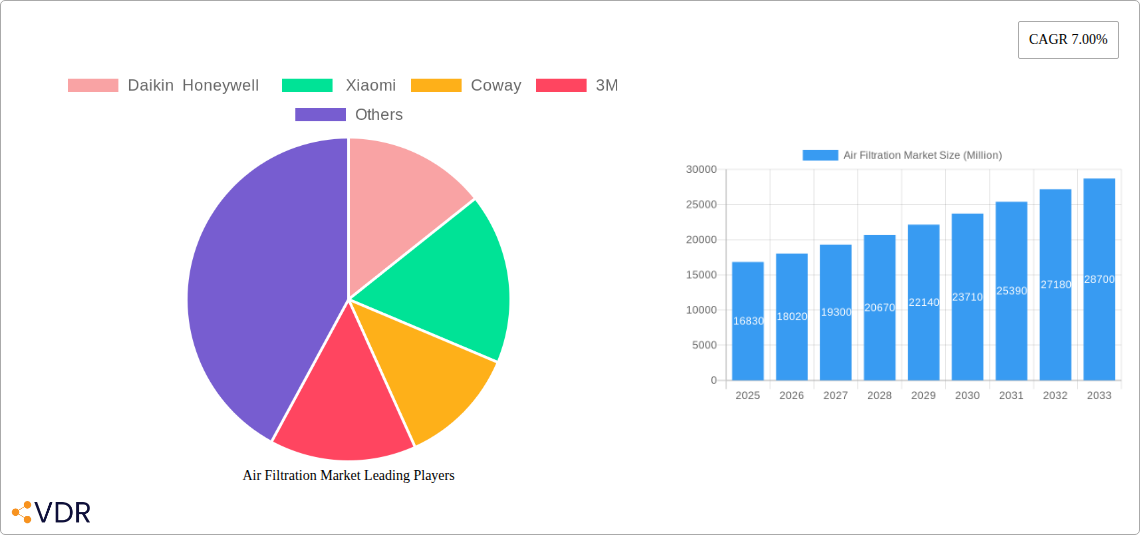
Air Filtration Market Market Size (In Billion)
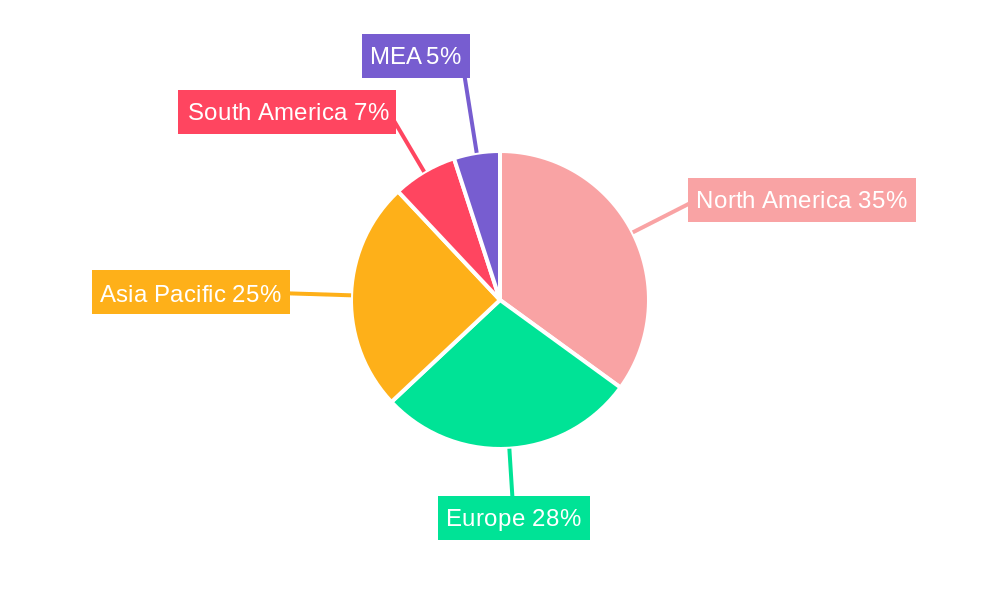
The North American market currently holds a substantial share, attributed to high consumer awareness and established infrastructure. However, the Asia-Pacific region is poised for rapid expansion due to increasing urbanization, rising pollution levels, and growing disposable incomes. Europe also presents a significant market opportunity, driven by stringent environmental regulations and a focus on sustainable living. To maintain competitiveness, manufacturers are focusing on developing energy-efficient, smart, and aesthetically pleasing air filtration systems to cater to diverse consumer preferences and market needs. Challenges include the high initial cost of advanced air filtration systems, which might limit adoption in certain segments, especially in developing economies. Furthermore, maintaining consistent technological advancements and meeting evolving regulatory standards will be crucial for long-term success in this dynamic market.
Air Filtration Market Company Market Share
Air Filtration Market: A Comprehensive Report (2019-2033)
This in-depth report provides a comprehensive analysis of the Air Filtration Market, encompassing its current dynamics, future growth trajectory, and key players. The study period covers 2019-2033, with 2025 as the base and estimated year. We delve into the parent market of HVAC & Refrigeration Equipment and the child market segment of Air Purification Systems, offering granular insights for informed decision-making. The report is valued at xx Million units.
Air Filtration Market Market Dynamics & Structure
This section analyzes the market's competitive landscape, technological advancements, regulatory influences, and market trends. We examine market concentration, identifying leading players and their market share percentages. The analysis includes a detailed exploration of M&A activities within the sector, quantifying deal volumes from the historical period (2019-2024) and projecting trends for the forecast period (2025-2033).
- Market Concentration: The air filtration market is characterized by a mix of large multinational corporations and smaller specialized players. The top 5 players (Daikin, Honeywell, Xiaomi, Coway, 3M) hold an estimated xx% market share in 2025, with a projected xx% by 2033.
- Technological Innovation: Continuous advancements in filtration technologies, such as HEPA and electrostatic precipitators, are key drivers. The emergence of smart air purifiers with IoT integration is significantly impacting market growth. Innovation barriers include high R&D costs and stringent regulatory approvals.
- Regulatory Frameworks: Government regulations regarding air quality and indoor environmental standards are influencing market growth, particularly in regions with stringent emission controls.
- Competitive Product Substitutes: While air filtration systems are increasingly important, natural ventilation and other passive air purification methods provide some level of competition. However, the effectiveness of filtration solutions for removing harmful particulates makes them a dominant solution.
- End-User Demographics: The residential segment currently dominates, driven by growing health consciousness and rising disposable incomes. However, the commercial and industrial segments are expected to experience significant growth due to increasing awareness of indoor air quality and associated productivity benefits.
- M&A Trends: The historical period (2019-2024) witnessed xx M&A deals. The forecast period is projected to see an increase to xx deals, driven by the consolidation of market share and technological integration.
Air Filtration Market Growth Trends & Insights
This section provides a comprehensive overview of the Air Filtration Market's growth trajectory using various analytical tools, providing detailed analysis of the market size evolution from 2019 to 2024 and projecting its expansion until 2033. We will examine the Compound Annual Growth Rate (CAGR) and analyze shifts in consumer behavior and technology adoption rates. The total market size is expected to reach xx Million units by 2033.
Dominant Regions, Countries, or Segments in Air Filtration Market
This section identifies the leading regions, countries, and segments driving market growth. We analyze the market share and growth potential of different filtration technologies (HEPA, ESPs, ionizers), product types (stand-alone, in-duct), and end-user segments (residential, commercial, industrial). North America and Asia-Pacific are expected to be the leading regions.
- Key Drivers (Asia-Pacific): Rapid urbanization, rising disposable incomes, increasing awareness of air pollution, supportive government policies promoting cleaner air initiatives, and expanding industrial sectors.
- Market Share and Growth Potential: HEPA filtration technology currently holds the largest market share due to its high efficiency and established technology. However, other filtration technologies, such as electrostatic precipitators, are gaining traction due to cost-effectiveness and specific application advantages. The residential segment dominates, followed by the commercial and industrial segments that are experiencing increased growth.
Air Filtration Market Product Landscape
The market offers a wide array of air filtration products, ranging from basic stand-alone units to advanced in-duct systems incorporating multiple filtration technologies like HEPA and electrostatic precipitators. Recent innovations include smart features like app connectivity, air quality monitoring, and automated controls. Key features driving sales include energy efficiency, quiet operation, and ease of maintenance.
Key Drivers, Barriers & Challenges in Air Filtration Market
Key Drivers: Growing awareness of indoor air quality, increasing prevalence of respiratory illnesses, stringent government regulations on air pollution, and technological advancements leading to more efficient and affordable air purifiers.
Key Challenges: High initial investment costs for advanced systems, limited awareness in certain regions, fluctuations in raw material prices impacting production costs, and competition from substitute technologies. Supply chain disruptions, particularly seen post-2020, also affected production capabilities.
Emerging Opportunities in Air Filtration Market
Emerging opportunities include the expansion into developing markets, growing demand for portable and compact air purifiers, integration of air purifiers with HVAC systems, and the development of specialized filters targeting specific pollutants. The development of air purifiers tailored to the needs of specific sectors, such as healthcare and education, presents significant opportunities for growth.
Growth Accelerators in the Air Filtration Market Industry
Technological advancements in filtration technology, strategic partnerships between manufacturers and distributors, expansion into new geographical markets, and government incentives promoting cleaner air are significant growth accelerators. The increasing integration of smart technologies is expected to accelerate market growth.
Notable Milestones in Air Filtration Market Sector
- March 2023: Xiaomi Corp. launched the MIJIA full-effect air purifier in China, boasting 12,500 liters/minute air volume and approximately 99% virus removal.
- March 2023: Blueair introduced the Blue Pure Max, a quieter, more robust purifier cleaning 1,524 sq ft rooms in ~30 minutes.
In-Depth Air Filtration Market Market Outlook
The Air Filtration Market is poised for significant growth in the coming years, driven by increasing awareness of air quality and technological innovations. Strategic partnerships, expanding market penetration in developing economies, and the development of next-generation filtration technologies will further propel market expansion. The market presents lucrative opportunities for manufacturers, distributors, and technology providers.
Air Filtration Market Segmentation
-
1. Filtration Technology
- 1.1. High-efficiency Particulate Air (HEPA)
- 1.2. Other Fi
-
2. Type
- 2.1. Stand-alone
- 2.2. In-duct
-
3. End User
- 3.1. Residential
- 3.2. Commercial
- 3.3. Industrial
Air Filtration Market Segmentation By Geography
-
1. North America
- 1.1. United States
- 1.2. Canada
- 1.3. Rest of North America
-
2. Europe
- 2.1. United Kingdom
- 2.2. Germany
- 2.3. Spain
- 2.4. NORDIC
- 2.5. Russia
- 2.6. Turkey
- 2.7. Italy
- 2.8. Rest of Europe
-
3. Asia Pacific
- 3.1. China
- 3.2. India
- 3.3. Japan
- 3.4. Malaysia
- 3.5. Thailand
- 3.6. Indonesia
- 3.7. Vietnam
- 3.8. Rest of Asia Pacific
-
4. South America
- 4.1. Brazil
- 4.2. Argentina
- 4.3. Colombia
- 4.4. Rest of South America
-
5. Middle East and Africa
- 5.1. United Arab Emirates
- 5.2. Saudi Arabia
- 5.3. South Africa
- 5.4. Nigeria
- 5.5. Qatar
- 5.6. Egypt
- 5.7. Rest of Middle East and Africa
Air Filtration Market Regional Market Share
Geographic Coverage of Air Filtration Market
Air Filtration Market REPORT HIGHLIGHTS
| Aspects | Details |
|---|---|
| Study Period | 2020-2034 |
| Base Year | 2025 |
| Estimated Year | 2026 |
| Forecast Period | 2026-2034 |
| Historical Period | 2020-2025 |
| Growth Rate | CAGR of 7.00% from 2020-2034 |
| Segmentation |
|
Table of Contents
- 1. Introduction
- 1.1. Research Scope
- 1.2. Market Segmentation
- 1.3. Research Objective
- 1.4. Definitions and Assumptions
- 2. Executive Summary
- 2.1. Market Snapshot
- 3. Market Dynamics
- 3.1. Market Drivers
- 3.2. Market Restrains
- 3.3. Market Trends
- 3.4. Market Opportunities
- 4. Market Factor Analysis
- 4.1. Porters Five Forces
- 4.1.1. Bargaining Power of Suppliers
- 4.1.2. Bargaining Power of Buyers
- 4.1.3. Threat of New Entrants
- 4.1.4. Threat of Substitutes
- 4.1.5. Competitive Rivalry
- 4.2. PESTEL analysis
- 4.3. BCG Analysis
- 4.3.1. Stars (High Growth, High Market Share)
- 4.3.2. Cash Cows (Low Growth, High Market Share)
- 4.3.3. Question Mark (High Growth, Low Market Share)
- 4.3.4. Dogs (Low Growth, Low Market Share)
- 4.4. Ansoff Matrix Analysis
- 4.5. Supply Chain Analysis
- 4.6. Regulatory Landscape
- 4.7. Current Market Potential and Opportunity Assessment (TAM–SAM–SOM Framework)
- 4.8. VDR Analyst Note
- 4.1. Porters Five Forces
- 5. Market Analysis, Insights and Forecast 2021-2033
- 5.1. Market Analysis, Insights and Forecast - by Filtration Technology
- 5.1.1. High-efficiency Particulate Air (HEPA)
- 5.1.2. Other Fi
- 5.2. Market Analysis, Insights and Forecast - by Type
- 5.2.1. Stand-alone
- 5.2.2. In-duct
- 5.3. Market Analysis, Insights and Forecast - by End User
- 5.3.1. Residential
- 5.3.2. Commercial
- 5.3.3. Industrial
- 5.4. Market Analysis, Insights and Forecast - by Region
- 5.4.1. North America
- 5.4.2. Europe
- 5.4.3. Asia Pacific
- 5.4.4. South America
- 5.4.5. Middle East and Africa
- 5.1. Market Analysis, Insights and Forecast - by Filtration Technology
- 6. Global Air Filtration Market Analysis, Insights and Forecast, 2021-2033
- 6.1. Market Analysis, Insights and Forecast - by Filtration Technology
- 6.1.1. High-efficiency Particulate Air (HEPA)
- 6.1.2. Other Fi
- 6.2. Market Analysis, Insights and Forecast - by Type
- 6.2.1. Stand-alone
- 6.2.2. In-duct
- 6.3. Market Analysis, Insights and Forecast - by End User
- 6.3.1. Residential
- 6.3.2. Commercial
- 6.3.3. Industrial
- 6.1. Market Analysis, Insights and Forecast - by Filtration Technology
- 7. North America Air Filtration Market Analysis, Insights and Forecast, 2021-2033
- 7.1. Market Analysis, Insights and Forecast - by Filtration Technology
- 7.1.1. High-efficiency Particulate Air (HEPA)
- 7.1.2. Other Fi
- 7.2. Market Analysis, Insights and Forecast - by Type
- 7.2.1. Stand-alone
- 7.2.2. In-duct
- 7.3. Market Analysis, Insights and Forecast - by End User
- 7.3.1. Residential
- 7.3.2. Commercial
- 7.3.3. Industrial
- 7.1. Market Analysis, Insights and Forecast - by Filtration Technology
- 8. Europe Air Filtration Market Analysis, Insights and Forecast, 2021-2033
- 8.1. Market Analysis, Insights and Forecast - by Filtration Technology
- 8.1.1. High-efficiency Particulate Air (HEPA)
- 8.1.2. Other Fi
- 8.2. Market Analysis, Insights and Forecast - by Type
- 8.2.1. Stand-alone
- 8.2.2. In-duct
- 8.3. Market Analysis, Insights and Forecast - by End User
- 8.3.1. Residential
- 8.3.2. Commercial
- 8.3.3. Industrial
- 8.1. Market Analysis, Insights and Forecast - by Filtration Technology
- 9. Asia Pacific Air Filtration Market Analysis, Insights and Forecast, 2021-2033
- 9.1. Market Analysis, Insights and Forecast - by Filtration Technology
- 9.1.1. High-efficiency Particulate Air (HEPA)
- 9.1.2. Other Fi
- 9.2. Market Analysis, Insights and Forecast - by Type
- 9.2.1. Stand-alone
- 9.2.2. In-duct
- 9.3. Market Analysis, Insights and Forecast - by End User
- 9.3.1. Residential
- 9.3.2. Commercial
- 9.3.3. Industrial
- 9.1. Market Analysis, Insights and Forecast - by Filtration Technology
- 10. South America Air Filtration Market Analysis, Insights and Forecast, 2021-2033
- 10.1. Market Analysis, Insights and Forecast - by Filtration Technology
- 10.1.1. High-efficiency Particulate Air (HEPA)
- 10.1.2. Other Fi
- 10.2. Market Analysis, Insights and Forecast - by Type
- 10.2.1. Stand-alone
- 10.2.2. In-duct
- 10.3. Market Analysis, Insights and Forecast - by End User
- 10.3.1. Residential
- 10.3.2. Commercial
- 10.3.3. Industrial
- 10.1. Market Analysis, Insights and Forecast - by Filtration Technology
- 11. Middle East and Africa Air Filtration Market Analysis, Insights and Forecast, 2021-2033
- 11.1. Market Analysis, Insights and Forecast - by Filtration Technology
- 11.1.1. High-efficiency Particulate Air (HEPA)
- 11.1.2. Other Fi
- 11.2. Market Analysis, Insights and Forecast - by Type
- 11.2.1. Stand-alone
- 11.2.2. In-duct
- 11.3. Market Analysis, Insights and Forecast - by End User
- 11.3.1. Residential
- 11.3.2. Commercial
- 11.3.3. Industrial
- 11.1. Market Analysis, Insights and Forecast - by Filtration Technology
- 12. Competitive Analysis
- 12.1. Company Profiles
- 12.1.1 Daikin Honeywell
- 12.1.1.1. Company Overview
- 12.1.1.2. Products
- 12.1.1.3. Company Financials
- 12.1.1.4. SWOT Analysis
- 12.1.2 Xiaomi
- 12.1.2.1. Company Overview
- 12.1.2.2. Products
- 12.1.2.3. Company Financials
- 12.1.2.4. SWOT Analysis
- 12.1.3 Coway
- 12.1.3.1. Company Overview
- 12.1.3.2. Products
- 12.1.3.3. Company Financials
- 12.1.3.4. SWOT Analysis
- 12.1.4 3M
- 12.1.4.1. Company Overview
- 12.1.4.2. Products
- 12.1.4.3. Company Financials
- 12.1.4.4. SWOT Analysis
- 12.1.1 Daikin Honeywell
- 12.2. Market Entropy
- 12.2.1 Company's Key Areas Served
- 12.2.2 Recent Developments
- 12.3. Company Market Share Analysis 2025
- 12.3.1 Top 5 Companies Market Share Analysis
- 12.3.2 Top 3 Companies Market Share Analysis
- 12.4. List of Potential Customers
- 13. Research Methodology
List of Figures
- Figure 1: Global Air Filtration Market Revenue Breakdown (Million, %) by Region 2025 & 2033
- Figure 2: Global Air Filtration Market Volume Breakdown (K Unit, %) by Region 2025 & 2033
- Figure 3: North America Air Filtration Market Revenue (Million), by Filtration Technology 2025 & 2033
- Figure 4: North America Air Filtration Market Volume (K Unit), by Filtration Technology 2025 & 2033
- Figure 5: North America Air Filtration Market Revenue Share (%), by Filtration Technology 2025 & 2033
- Figure 6: North America Air Filtration Market Volume Share (%), by Filtration Technology 2025 & 2033
- Figure 7: North America Air Filtration Market Revenue (Million), by Type 2025 & 2033
- Figure 8: North America Air Filtration Market Volume (K Unit), by Type 2025 & 2033
- Figure 9: North America Air Filtration Market Revenue Share (%), by Type 2025 & 2033
- Figure 10: North America Air Filtration Market Volume Share (%), by Type 2025 & 2033
- Figure 11: North America Air Filtration Market Revenue (Million), by End User 2025 & 2033
- Figure 12: North America Air Filtration Market Volume (K Unit), by End User 2025 & 2033
- Figure 13: North America Air Filtration Market Revenue Share (%), by End User 2025 & 2033
- Figure 14: North America Air Filtration Market Volume Share (%), by End User 2025 & 2033
- Figure 15: North America Air Filtration Market Revenue (Million), by Country 2025 & 2033
- Figure 16: North America Air Filtration Market Volume (K Unit), by Country 2025 & 2033
- Figure 17: North America Air Filtration Market Revenue Share (%), by Country 2025 & 2033
- Figure 18: North America Air Filtration Market Volume Share (%), by Country 2025 & 2033
- Figure 19: Europe Air Filtration Market Revenue (Million), by Filtration Technology 2025 & 2033
- Figure 20: Europe Air Filtration Market Volume (K Unit), by Filtration Technology 2025 & 2033
- Figure 21: Europe Air Filtration Market Revenue Share (%), by Filtration Technology 2025 & 2033
- Figure 22: Europe Air Filtration Market Volume Share (%), by Filtration Technology 2025 & 2033
- Figure 23: Europe Air Filtration Market Revenue (Million), by Type 2025 & 2033
- Figure 24: Europe Air Filtration Market Volume (K Unit), by Type 2025 & 2033
- Figure 25: Europe Air Filtration Market Revenue Share (%), by Type 2025 & 2033
- Figure 26: Europe Air Filtration Market Volume Share (%), by Type 2025 & 2033
- Figure 27: Europe Air Filtration Market Revenue (Million), by End User 2025 & 2033
- Figure 28: Europe Air Filtration Market Volume (K Unit), by End User 2025 & 2033
- Figure 29: Europe Air Filtration Market Revenue Share (%), by End User 2025 & 2033
- Figure 30: Europe Air Filtration Market Volume Share (%), by End User 2025 & 2033
- Figure 31: Europe Air Filtration Market Revenue (Million), by Country 2025 & 2033
- Figure 32: Europe Air Filtration Market Volume (K Unit), by Country 2025 & 2033
- Figure 33: Europe Air Filtration Market Revenue Share (%), by Country 2025 & 2033
- Figure 34: Europe Air Filtration Market Volume Share (%), by Country 2025 & 2033
- Figure 35: Asia Pacific Air Filtration Market Revenue (Million), by Filtration Technology 2025 & 2033
- Figure 36: Asia Pacific Air Filtration Market Volume (K Unit), by Filtration Technology 2025 & 2033
- Figure 37: Asia Pacific Air Filtration Market Revenue Share (%), by Filtration Technology 2025 & 2033
- Figure 38: Asia Pacific Air Filtration Market Volume Share (%), by Filtration Technology 2025 & 2033
- Figure 39: Asia Pacific Air Filtration Market Revenue (Million), by Type 2025 & 2033
- Figure 40: Asia Pacific Air Filtration Market Volume (K Unit), by Type 2025 & 2033
- Figure 41: Asia Pacific Air Filtration Market Revenue Share (%), by Type 2025 & 2033
- Figure 42: Asia Pacific Air Filtration Market Volume Share (%), by Type 2025 & 2033
- Figure 43: Asia Pacific Air Filtration Market Revenue (Million), by End User 2025 & 2033
- Figure 44: Asia Pacific Air Filtration Market Volume (K Unit), by End User 2025 & 2033
- Figure 45: Asia Pacific Air Filtration Market Revenue Share (%), by End User 2025 & 2033
- Figure 46: Asia Pacific Air Filtration Market Volume Share (%), by End User 2025 & 2033
- Figure 47: Asia Pacific Air Filtration Market Revenue (Million), by Country 2025 & 2033
- Figure 48: Asia Pacific Air Filtration Market Volume (K Unit), by Country 2025 & 2033
- Figure 49: Asia Pacific Air Filtration Market Revenue Share (%), by Country 2025 & 2033
- Figure 50: Asia Pacific Air Filtration Market Volume Share (%), by Country 2025 & 2033
- Figure 51: South America Air Filtration Market Revenue (Million), by Filtration Technology 2025 & 2033
- Figure 52: South America Air Filtration Market Volume (K Unit), by Filtration Technology 2025 & 2033
- Figure 53: South America Air Filtration Market Revenue Share (%), by Filtration Technology 2025 & 2033
- Figure 54: South America Air Filtration Market Volume Share (%), by Filtration Technology 2025 & 2033
- Figure 55: South America Air Filtration Market Revenue (Million), by Type 2025 & 2033
- Figure 56: South America Air Filtration Market Volume (K Unit), by Type 2025 & 2033
- Figure 57: South America Air Filtration Market Revenue Share (%), by Type 2025 & 2033
- Figure 58: South America Air Filtration Market Volume Share (%), by Type 2025 & 2033
- Figure 59: South America Air Filtration Market Revenue (Million), by End User 2025 & 2033
- Figure 60: South America Air Filtration Market Volume (K Unit), by End User 2025 & 2033
- Figure 61: South America Air Filtration Market Revenue Share (%), by End User 2025 & 2033
- Figure 62: South America Air Filtration Market Volume Share (%), by End User 2025 & 2033
- Figure 63: South America Air Filtration Market Revenue (Million), by Country 2025 & 2033
- Figure 64: South America Air Filtration Market Volume (K Unit), by Country 2025 & 2033
- Figure 65: South America Air Filtration Market Revenue Share (%), by Country 2025 & 2033
- Figure 66: South America Air Filtration Market Volume Share (%), by Country 2025 & 2033
- Figure 67: Middle East and Africa Air Filtration Market Revenue (Million), by Filtration Technology 2025 & 2033
- Figure 68: Middle East and Africa Air Filtration Market Volume (K Unit), by Filtration Technology 2025 & 2033
- Figure 69: Middle East and Africa Air Filtration Market Revenue Share (%), by Filtration Technology 2025 & 2033
- Figure 70: Middle East and Africa Air Filtration Market Volume Share (%), by Filtration Technology 2025 & 2033
- Figure 71: Middle East and Africa Air Filtration Market Revenue (Million), by Type 2025 & 2033
- Figure 72: Middle East and Africa Air Filtration Market Volume (K Unit), by Type 2025 & 2033
- Figure 73: Middle East and Africa Air Filtration Market Revenue Share (%), by Type 2025 & 2033
- Figure 74: Middle East and Africa Air Filtration Market Volume Share (%), by Type 2025 & 2033
- Figure 75: Middle East and Africa Air Filtration Market Revenue (Million), by End User 2025 & 2033
- Figure 76: Middle East and Africa Air Filtration Market Volume (K Unit), by End User 2025 & 2033
- Figure 77: Middle East and Africa Air Filtration Market Revenue Share (%), by End User 2025 & 2033
- Figure 78: Middle East and Africa Air Filtration Market Volume Share (%), by End User 2025 & 2033
- Figure 79: Middle East and Africa Air Filtration Market Revenue (Million), by Country 2025 & 2033
- Figure 80: Middle East and Africa Air Filtration Market Volume (K Unit), by Country 2025 & 2033
- Figure 81: Middle East and Africa Air Filtration Market Revenue Share (%), by Country 2025 & 2033
- Figure 82: Middle East and Africa Air Filtration Market Volume Share (%), by Country 2025 & 2033
List of Tables
- Table 1: Global Air Filtration Market Revenue Million Forecast, by Filtration Technology 2020 & 2033
- Table 2: Global Air Filtration Market Volume K Unit Forecast, by Filtration Technology 2020 & 2033
- Table 3: Global Air Filtration Market Revenue Million Forecast, by Type 2020 & 2033
- Table 4: Global Air Filtration Market Volume K Unit Forecast, by Type 2020 & 2033
- Table 5: Global Air Filtration Market Revenue Million Forecast, by End User 2020 & 2033
- Table 6: Global Air Filtration Market Volume K Unit Forecast, by End User 2020 & 2033
- Table 7: Global Air Filtration Market Revenue Million Forecast, by Region 2020 & 2033
- Table 8: Global Air Filtration Market Volume K Unit Forecast, by Region 2020 & 2033
- Table 9: Global Air Filtration Market Revenue Million Forecast, by Filtration Technology 2020 & 2033
- Table 10: Global Air Filtration Market Volume K Unit Forecast, by Filtration Technology 2020 & 2033
- Table 11: Global Air Filtration Market Revenue Million Forecast, by Type 2020 & 2033
- Table 12: Global Air Filtration Market Volume K Unit Forecast, by Type 2020 & 2033
- Table 13: Global Air Filtration Market Revenue Million Forecast, by End User 2020 & 2033
- Table 14: Global Air Filtration Market Volume K Unit Forecast, by End User 2020 & 2033
- Table 15: Global Air Filtration Market Revenue Million Forecast, by Country 2020 & 2033
- Table 16: Global Air Filtration Market Volume K Unit Forecast, by Country 2020 & 2033
- Table 17: United States Air Filtration Market Revenue (Million) Forecast, by Application 2020 & 2033
- Table 18: United States Air Filtration Market Volume (K Unit) Forecast, by Application 2020 & 2033
- Table 19: Canada Air Filtration Market Revenue (Million) Forecast, by Application 2020 & 2033
- Table 20: Canada Air Filtration Market Volume (K Unit) Forecast, by Application 2020 & 2033
- Table 21: Rest of North America Air Filtration Market Revenue (Million) Forecast, by Application 2020 & 2033
- Table 22: Rest of North America Air Filtration Market Volume (K Unit) Forecast, by Application 2020 & 2033
- Table 23: Global Air Filtration Market Revenue Million Forecast, by Filtration Technology 2020 & 2033
- Table 24: Global Air Filtration Market Volume K Unit Forecast, by Filtration Technology 2020 & 2033
- Table 25: Global Air Filtration Market Revenue Million Forecast, by Type 2020 & 2033
- Table 26: Global Air Filtration Market Volume K Unit Forecast, by Type 2020 & 2033
- Table 27: Global Air Filtration Market Revenue Million Forecast, by End User 2020 & 2033
- Table 28: Global Air Filtration Market Volume K Unit Forecast, by End User 2020 & 2033
- Table 29: Global Air Filtration Market Revenue Million Forecast, by Country 2020 & 2033
- Table 30: Global Air Filtration Market Volume K Unit Forecast, by Country 2020 & 2033
- Table 31: United Kingdom Air Filtration Market Revenue (Million) Forecast, by Application 2020 & 2033
- Table 32: United Kingdom Air Filtration Market Volume (K Unit) Forecast, by Application 2020 & 2033
- Table 33: Germany Air Filtration Market Revenue (Million) Forecast, by Application 2020 & 2033
- Table 34: Germany Air Filtration Market Volume (K Unit) Forecast, by Application 2020 & 2033
- Table 35: Spain Air Filtration Market Revenue (Million) Forecast, by Application 2020 & 2033
- Table 36: Spain Air Filtration Market Volume (K Unit) Forecast, by Application 2020 & 2033
- Table 37: NORDIC Air Filtration Market Revenue (Million) Forecast, by Application 2020 & 2033
- Table 38: NORDIC Air Filtration Market Volume (K Unit) Forecast, by Application 2020 & 2033
- Table 39: Russia Air Filtration Market Revenue (Million) Forecast, by Application 2020 & 2033
- Table 40: Russia Air Filtration Market Volume (K Unit) Forecast, by Application 2020 & 2033
- Table 41: Turkey Air Filtration Market Revenue (Million) Forecast, by Application 2020 & 2033
- Table 42: Turkey Air Filtration Market Volume (K Unit) Forecast, by Application 2020 & 2033
- Table 43: Italy Air Filtration Market Revenue (Million) Forecast, by Application 2020 & 2033
- Table 44: Italy Air Filtration Market Volume (K Unit) Forecast, by Application 2020 & 2033
- Table 45: Rest of Europe Air Filtration Market Revenue (Million) Forecast, by Application 2020 & 2033
- Table 46: Rest of Europe Air Filtration Market Volume (K Unit) Forecast, by Application 2020 & 2033
- Table 47: Global Air Filtration Market Revenue Million Forecast, by Filtration Technology 2020 & 2033
- Table 48: Global Air Filtration Market Volume K Unit Forecast, by Filtration Technology 2020 & 2033
- Table 49: Global Air Filtration Market Revenue Million Forecast, by Type 2020 & 2033
- Table 50: Global Air Filtration Market Volume K Unit Forecast, by Type 2020 & 2033
- Table 51: Global Air Filtration Market Revenue Million Forecast, by End User 2020 & 2033
- Table 52: Global Air Filtration Market Volume K Unit Forecast, by End User 2020 & 2033
- Table 53: Global Air Filtration Market Revenue Million Forecast, by Country 2020 & 2033
- Table 54: Global Air Filtration Market Volume K Unit Forecast, by Country 2020 & 2033
- Table 55: China Air Filtration Market Revenue (Million) Forecast, by Application 2020 & 2033
- Table 56: China Air Filtration Market Volume (K Unit) Forecast, by Application 2020 & 2033
- Table 57: India Air Filtration Market Revenue (Million) Forecast, by Application 2020 & 2033
- Table 58: India Air Filtration Market Volume (K Unit) Forecast, by Application 2020 & 2033
- Table 59: Japan Air Filtration Market Revenue (Million) Forecast, by Application 2020 & 2033
- Table 60: Japan Air Filtration Market Volume (K Unit) Forecast, by Application 2020 & 2033
- Table 61: Malaysia Air Filtration Market Revenue (Million) Forecast, by Application 2020 & 2033
- Table 62: Malaysia Air Filtration Market Volume (K Unit) Forecast, by Application 2020 & 2033
- Table 63: Thailand Air Filtration Market Revenue (Million) Forecast, by Application 2020 & 2033
- Table 64: Thailand Air Filtration Market Volume (K Unit) Forecast, by Application 2020 & 2033
- Table 65: Indonesia Air Filtration Market Revenue (Million) Forecast, by Application 2020 & 2033
- Table 66: Indonesia Air Filtration Market Volume (K Unit) Forecast, by Application 2020 & 2033
- Table 67: Vietnam Air Filtration Market Revenue (Million) Forecast, by Application 2020 & 2033
- Table 68: Vietnam Air Filtration Market Volume (K Unit) Forecast, by Application 2020 & 2033
- Table 69: Rest of Asia Pacific Air Filtration Market Revenue (Million) Forecast, by Application 2020 & 2033
- Table 70: Rest of Asia Pacific Air Filtration Market Volume (K Unit) Forecast, by Application 2020 & 2033
- Table 71: Global Air Filtration Market Revenue Million Forecast, by Filtration Technology 2020 & 2033
- Table 72: Global Air Filtration Market Volume K Unit Forecast, by Filtration Technology 2020 & 2033
- Table 73: Global Air Filtration Market Revenue Million Forecast, by Type 2020 & 2033
- Table 74: Global Air Filtration Market Volume K Unit Forecast, by Type 2020 & 2033
- Table 75: Global Air Filtration Market Revenue Million Forecast, by End User 2020 & 2033
- Table 76: Global Air Filtration Market Volume K Unit Forecast, by End User 2020 & 2033
- Table 77: Global Air Filtration Market Revenue Million Forecast, by Country 2020 & 2033
- Table 78: Global Air Filtration Market Volume K Unit Forecast, by Country 2020 & 2033
- Table 79: Brazil Air Filtration Market Revenue (Million) Forecast, by Application 2020 & 2033
- Table 80: Brazil Air Filtration Market Volume (K Unit) Forecast, by Application 2020 & 2033
- Table 81: Argentina Air Filtration Market Revenue (Million) Forecast, by Application 2020 & 2033
- Table 82: Argentina Air Filtration Market Volume (K Unit) Forecast, by Application 2020 & 2033
- Table 83: Colombia Air Filtration Market Revenue (Million) Forecast, by Application 2020 & 2033
- Table 84: Colombia Air Filtration Market Volume (K Unit) Forecast, by Application 2020 & 2033
- Table 85: Rest of South America Air Filtration Market Revenue (Million) Forecast, by Application 2020 & 2033
- Table 86: Rest of South America Air Filtration Market Volume (K Unit) Forecast, by Application 2020 & 2033
- Table 87: Global Air Filtration Market Revenue Million Forecast, by Filtration Technology 2020 & 2033
- Table 88: Global Air Filtration Market Volume K Unit Forecast, by Filtration Technology 2020 & 2033
- Table 89: Global Air Filtration Market Revenue Million Forecast, by Type 2020 & 2033
- Table 90: Global Air Filtration Market Volume K Unit Forecast, by Type 2020 & 2033
- Table 91: Global Air Filtration Market Revenue Million Forecast, by End User 2020 & 2033
- Table 92: Global Air Filtration Market Volume K Unit Forecast, by End User 2020 & 2033
- Table 93: Global Air Filtration Market Revenue Million Forecast, by Country 2020 & 2033
- Table 94: Global Air Filtration Market Volume K Unit Forecast, by Country 2020 & 2033
- Table 95: United Arab Emirates Air Filtration Market Revenue (Million) Forecast, by Application 2020 & 2033
- Table 96: United Arab Emirates Air Filtration Market Volume (K Unit) Forecast, by Application 2020 & 2033
- Table 97: Saudi Arabia Air Filtration Market Revenue (Million) Forecast, by Application 2020 & 2033
- Table 98: Saudi Arabia Air Filtration Market Volume (K Unit) Forecast, by Application 2020 & 2033
- Table 99: South Africa Air Filtration Market Revenue (Million) Forecast, by Application 2020 & 2033
- Table 100: South Africa Air Filtration Market Volume (K Unit) Forecast, by Application 2020 & 2033
- Table 101: Nigeria Air Filtration Market Revenue (Million) Forecast, by Application 2020 & 2033
- Table 102: Nigeria Air Filtration Market Volume (K Unit) Forecast, by Application 2020 & 2033
- Table 103: Qatar Air Filtration Market Revenue (Million) Forecast, by Application 2020 & 2033
- Table 104: Qatar Air Filtration Market Volume (K Unit) Forecast, by Application 2020 & 2033
- Table 105: Egypt Air Filtration Market Revenue (Million) Forecast, by Application 2020 & 2033
- Table 106: Egypt Air Filtration Market Volume (K Unit) Forecast, by Application 2020 & 2033
- Table 107: Rest of Middle East and Africa Air Filtration Market Revenue (Million) Forecast, by Application 2020 & 2033
- Table 108: Rest of Middle East and Africa Air Filtration Market Volume (K Unit) Forecast, by Application 2020 & 2033
Frequently Asked Questions
1. What is the projected Compound Annual Growth Rate (CAGR) of the Air Filtration Market?
The projected CAGR is approximately 7.00%.
2. Which companies are prominent players in the Air Filtration Market?
Key companies in the market include Daikin Honeywell , Xiaomi, Coway, 3M .
3. What are the main segments of the Air Filtration Market?
The market segments include Filtration Technology, Type, End User.
4. Can you provide details about the market size?
The market size is estimated to be USD 16.83 Million as of 2022.
5. What are some drivers contributing to market growth?
4.; Upcoming New Renewable Projects in the Country4.; Expansions of Transmission and Distribution Network.
6. What are the notable trends driving market growth?
The High-efficiency Particulate Air (HEPA) Segment is Expected to Dominate the Market.
7. Are there any restraints impacting market growth?
4.; Lack of Private Participation in the Country's Power Sector.
8. Can you provide examples of recent developments in the market?
March 2023: Xiaomi Corp. announced the launch of the MIJIA full-effect air purifier for the Chinese market. The equipment can produce 12,500 liters of air volume per minute, with an estimated virus removal capacity of approximately 99%. Such an enhanced product feature is expected to increase the sale of air purifiers during the forecast period.
9. What pricing options are available for accessing the report?
Pricing options include single-user, multi-user, and enterprise licenses priced at USD 4750, USD 5250, and USD 8750 respectively.
10. Is the market size provided in terms of value or volume?
The market size is provided in terms of value, measured in Million and volume, measured in K Unit.
11. Are there any specific market keywords associated with the report?
Yes, the market keyword associated with the report is "Air Filtration Market," which aids in identifying and referencing the specific market segment covered.
12. How do I determine which pricing option suits my needs best?
The pricing options vary based on user requirements and access needs. Individual users may opt for single-user licenses, while businesses requiring broader access may choose multi-user or enterprise licenses for cost-effective access to the report.
13. Are there any additional resources or data provided in the Air Filtration Market report?
While the report offers comprehensive insights, it's advisable to review the specific contents or supplementary materials provided to ascertain if additional resources or data are available.
14. How can I stay updated on further developments or reports in the Air Filtration Market?
To stay informed about further developments, trends, and reports in the Air Filtration Market, consider subscribing to industry newsletters, following relevant companies and organizations, or regularly checking reputable industry news sources and publications.
Methodology
Step 1 - Identification of Relevant Samples Size from Population Database


Step 2 - Approaches for Defining Global Market Size (Value, Volume* & Price*)

Note*: In applicable scenarios
Step 3 - Data Sources
Primary Research
- Web Analytics
- Survey Reports
- Research Institute
- Latest Research Reports
- Opinion Leaders
Secondary Research
- Annual Reports
- White Paper
- Latest Press Release
- Industry Association
- Paid Database
- Investor Presentations

Step 4 - Data Triangulation
Involves using different sources of information in order to increase the validity of a study
These sources are likely to be stakeholders in a program - participants, other researchers, program staff, other community members, and so on.
Then we put all data in single framework & apply various statistical tools to find out the dynamic on the market.
During the analysis stage, feedback from the stakeholder groups would be compared to determine areas of agreement as well as areas of divergence