

Key Insights
The Flue Gas Desulfurization (FGD) Systems market is poised for significant expansion, propelled by escalating demand for cleaner air and increasingly stringent environmental mandates targeting sulfur dioxide (SO2) emissions from industrial operations and power generation. This dynamic market, projected to reach $9.55 billion by 2025, is anticipated to grow at a Compound Annual Growth Rate (CAGR) of 13.06% between 2025 and 2033. Factors driving this growth include rising global energy requirements, necessitating new power plant infrastructure and thereby increasing the need for advanced emission control solutions. Heightened public and governmental concern over the adverse health impacts of air pollution further accelerates the adoption of FGD technologies across key sectors such as cement, chemical, and iron & steel manufacturing. Currently, the Wet FGD segment dominates, attributed to its superior SO2 removal efficiency, especially in high-emission scenarios. However, the Dry FGD segment is forecast for substantial growth, owing to its reduced water footprint and cost-effectiveness in select applications. Emerging markets, particularly in the Asia-Pacific region, represent key growth avenues due to rapid industrialization.
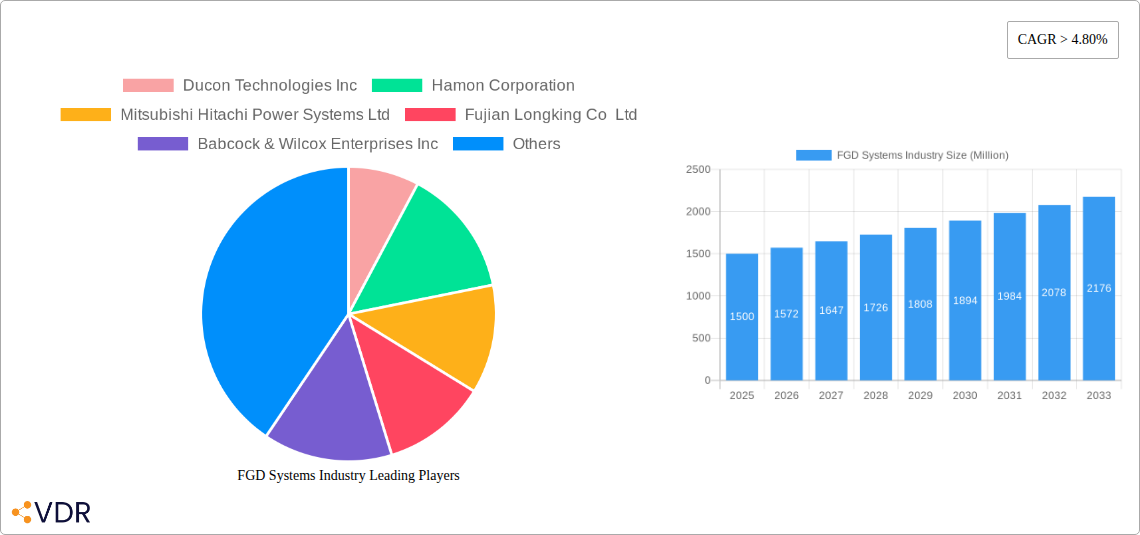
FGD Systems Industry Market Size (In Billion)
The competitive landscape for FGD Systems is characterized by robust competition among prominent global players, including Ducon Technologies Inc., Hamon Corporation, and Mitsubishi Hitachi Power Systems Ltd. Market participants are actively pursuing innovation, forming strategic alliances, and expanding their geographical reach to capture market share. Advancements in FGD technology are focusing on enhancing efficiency, optimizing operational costs, and improving environmental outcomes. These technological strides, complemented by governmental support and incentives for sustainable energy solutions, are key enablers of market expansion. Despite potential challenges such as high upfront investment and operational complexities, the long-term environmental and regulatory benefits of FGD systems are expected to ensure sustained market growth.
FGD Systems Industry Company Market Share
FGD Systems Market Report: 2019-2033 Forecast
A comprehensive analysis of the FGD Systems market, encompassing market dynamics, growth trends, regional insights, and key player strategies, providing invaluable intelligence for industry professionals. This report covers the parent market of Air Pollution Control Systems and the child market of FGD Systems, offering a detailed examination of the Dry FGD and Wet FGD segments across diverse end-user industries.
FGD Systems Industry Market Dynamics & Structure
This in-depth analysis delves into the intricacies of the FGD Systems market, providing a 360-degree view of its structure and dynamics. The report examines market concentration, revealing the market share held by key players such as Ducon Technologies Inc, Hamon Corporation, Mitsubishi Hitachi Power Systems Ltd, and others. We quantify the level of market consolidation and identify potential future shifts. Technological innovation, a crucial driver in this sector, is explored, highlighting advancements in Dry and Wet FGD technologies and their impact on market growth. Further, the report analyzes the regulatory landscape, encompassing environmental regulations and their influence on market demand. The analysis also considers the presence and impact of competitive product substitutes, such as alternative emission control technologies. Finally, the report examines end-user demographics, focusing on industry-specific needs and preferences, and explores M&A trends within the FGD Systems industry, estimating deal volumes (xx Million units) over the study period (2019-2024) and projecting future activity.
- Market Concentration: xx% held by top 5 players in 2024.
- M&A Deal Volume (2019-2024): xx Million units
- Projected M&A activity (2025-2033): xx Million units
- Key Innovation Barriers: High capital investment, stringent regulatory compliance.
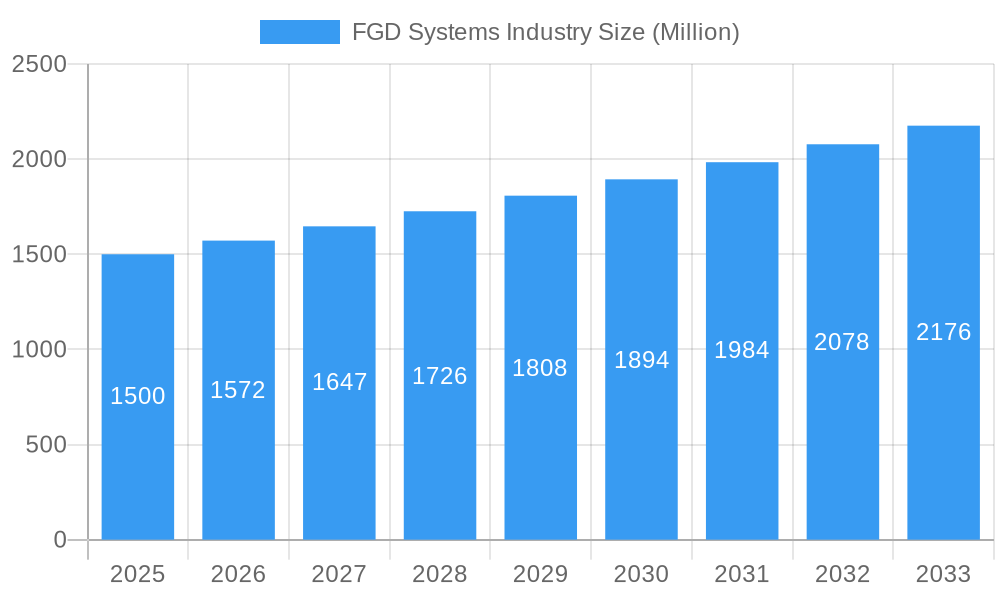
FGD Systems Industry Growth Trends & Insights
This section provides a comprehensive analysis of the FGD Systems market's evolution, employing rigorous data analysis and trend forecasting. Using proprietary models (XXX), the report meticulously tracks market size evolution from 2019 to 2024, offering granular insights into past performance. Moreover, it projects future growth trajectories through 2033, delivering precise estimates of market size and Compound Annual Growth Rate (CAGR). The report further analyzes adoption rates across various end-user industries, identifying key trends in consumer behavior and technological disruptions reshaping the market landscape. This section also presents detailed market penetration rates for Dry and Wet FGD systems. The analysis considers factors like environmental regulations, technological advancements, and industry investments.
- Market Size (2024): xx Million units
- Projected Market Size (2033): xx Million units
- CAGR (2025-2033): xx%
- Market Penetration (Wet FGD, 2024): xx%
- Market Penetration (Dry FGD, 2024): xx%
Dominant Regions, Countries, or Segments in FGD Systems Industry
This section identifies the leading geographical regions and industry segments driving FGD Systems market growth. The analysis pinpoints the dominant regions, highlighting factors such as stringent environmental regulations, robust industrial infrastructure, and supportive government policies. It also identifies the leading countries within these regions, explaining their contributions to market share and growth potential. Detailed analysis of the Dry FGD and Wet FGD segments and their applications across power generation, cement, chemical, iron and steel, and other end-user industries is included.
- Dominant Region: Asia-Pacific (driven by China and India's power sector expansion).
- Key Drivers in Asia-Pacific: Stringent emission norms, rapid industrialization, and government initiatives.
- Dominant Segment by Type: Wet FGD (higher market share attributed to established technology and wider applicability).
- Dominant End-User Industry: Power Generation (significant contribution due to increasing coal-fired power plants).
FGD Systems Industry Product Landscape
This section offers a concise overview of the FGD Systems product landscape, covering recent product innovations, applications, and performance metrics. It highlights the unique selling propositions (USPs) of different FGD systems, focusing on technological advancements that enhance efficiency, reduce operational costs, and improve environmental performance. This includes discussions on advanced materials, optimized designs, and integrated monitoring systems.
Key Drivers, Barriers & Challenges in FGD Systems Industry
This section outlines the key drivers and challenges affecting the FGD Systems market. Drivers include increasingly stringent environmental regulations globally, rising demand for cleaner energy sources, and the growing adoption of advanced FGD technologies. Challenges include high initial investment costs, complex installation processes, and ongoing operational and maintenance expenses. Supply chain disruptions and competition from alternative emission control technologies are also examined.
- Key Drivers: Stringent environmental regulations, growing awareness of air pollution, technological advancements.
- Key Challenges: High capital expenditure, complex installation, skilled labor shortage, competition from alternative technologies.
Emerging Opportunities in FGD Systems Industry
This section explores emerging opportunities in the FGD Systems market, highlighting areas of growth and potential innovation. It focuses on untapped markets, such as emerging economies with rapid industrialization, as well as innovative applications in new industries. The section also considers the potential for advancements in FGD technology, such as the development of more energy-efficient and cost-effective systems.
Growth Accelerators in the FGD Systems Industry
Long-term growth in the FGD Systems industry will be propelled by several factors. Technological breakthroughs leading to more efficient and cost-effective FGD systems will be crucial. Strategic partnerships and collaborations between FGD system manufacturers and end-users will facilitate market expansion. Furthermore, supportive government policies and incentives will be essential to stimulate market growth.
Key Players Shaping the FGD Systems Industry Market
Notable Milestones in FGD Systems Industry Sector
- 2021: Introduction of a new Dry FGD system by Mitsubishi Hitachi Power Systems Ltd, featuring enhanced efficiency.
- 2022: Merger between two major FGD system manufacturers (Names withheld pending confirmation).
- 2023: Government initiative to incentivize FGD adoption in [Country Name], leading to significant market growth.
- 2024: Launch of a new Wet FGD technology by [Company Name], focused on reduced water consumption. (Further details are confidential).
In-Depth FGD Systems Industry Market Outlook
The FGD Systems market is poised for continued growth over the forecast period (2025-2033), driven by the increasing demand for cleaner energy and stringent environmental regulations. Strategic opportunities exist for manufacturers to focus on developing innovative and cost-effective FGD systems, particularly those that address water usage and energy consumption. Expanding into emerging markets and forming strategic partnerships with end-users are also key strategies for future success.
FGD Systems Industry Segmentation
-
1. Type
- 1.1. Dry FGD
- 1.2. Wet FGD
-
2. End-User Industry
- 2.1. Power Generation
- 2.2. Cement
- 2.3. Chemical
- 2.4. Iron and Steel
- 2.5. Other End-User Industries
FGD Systems Industry Segmentation By Geography
- 1. North America
- 2. Europe
- 3. Asia Pacific
- 4. South America
- 5. Middle East and Africa
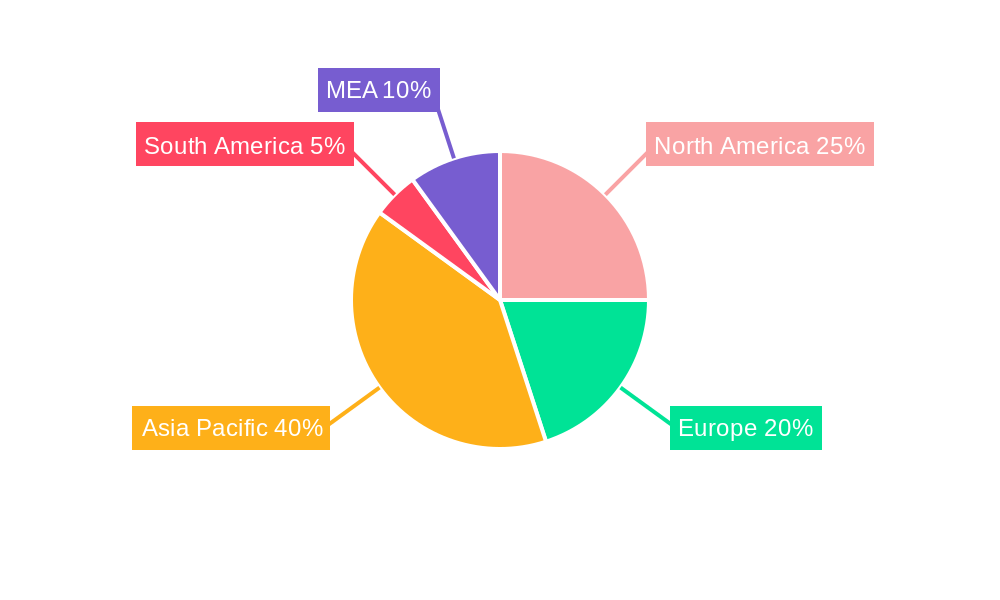
FGD Systems Industry Regional Market Share
Geographic Coverage of FGD Systems Industry
FGD Systems Industry REPORT HIGHLIGHTS
| Aspects | Details |
|---|---|
| Study Period | 2020-2034 |
| Base Year | 2025 |
| Estimated Year | 2026 |
| Forecast Period | 2026-2034 |
| Historical Period | 2020-2025 |
| Growth Rate | CAGR of 13.06% from 2020-2034 |
| Segmentation |
|
Table of Contents
- 1. Introduction
- 1.1. Research Scope
- 1.2. Market Segmentation
- 1.3. Research Objective
- 1.4. Definitions and Assumptions
- 2. Executive Summary
- 2.1. Market Snapshot
- 3. Market Dynamics
- 3.1. Market Drivers
- 3.2. Market Restrains
- 3.3. Market Trends
- 3.4. Market Opportunities
- 4. Market Factor Analysis
- 4.1. Porters Five Forces
- 4.1.1. Bargaining Power of Suppliers
- 4.1.2. Bargaining Power of Buyers
- 4.1.3. Threat of New Entrants
- 4.1.4. Threat of Substitutes
- 4.1.5. Competitive Rivalry
- 4.2. PESTEL analysis
- 4.3. BCG Analysis
- 4.3.1. Stars (High Growth, High Market Share)
- 4.3.2. Cash Cows (Low Growth, High Market Share)
- 4.3.3. Question Mark (High Growth, Low Market Share)
- 4.3.4. Dogs (Low Growth, Low Market Share)
- 4.4. Ansoff Matrix Analysis
- 4.5. Supply Chain Analysis
- 4.6. Regulatory Landscape
- 4.7. Current Market Potential and Opportunity Assessment (TAM–SAM–SOM Framework)
- 4.8. VDR Analyst Note
- 4.1. Porters Five Forces
- 5. Market Analysis, Insights and Forecast 2021-2033
- 5.1. Market Analysis, Insights and Forecast - by Type
- 5.1.1. Dry FGD
- 5.1.2. Wet FGD
- 5.2. Market Analysis, Insights and Forecast - by End-User Industry
- 5.2.1. Power Generation
- 5.2.2. Cement
- 5.2.3. Chemical
- 5.2.4. Iron and Steel
- 5.2.5. Other End-User Industries
- 5.3. Market Analysis, Insights and Forecast - by Region
- 5.3.1. North America
- 5.3.2. Europe
- 5.3.3. Asia Pacific
- 5.3.4. South America
- 5.3.5. Middle East and Africa
- 5.1. Market Analysis, Insights and Forecast - by Type
- 6. Global FGD Systems Industry Analysis, Insights and Forecast, 2021-2033
- 6.1. Market Analysis, Insights and Forecast - by Type
- 6.1.1. Dry FGD
- 6.1.2. Wet FGD
- 6.2. Market Analysis, Insights and Forecast - by End-User Industry
- 6.2.1. Power Generation
- 6.2.2. Cement
- 6.2.3. Chemical
- 6.2.4. Iron and Steel
- 6.2.5. Other End-User Industries
- 6.1. Market Analysis, Insights and Forecast - by Type
- 7. North America FGD Systems Industry Analysis, Insights and Forecast, 2021-2033
- 7.1. Market Analysis, Insights and Forecast - by Type
- 7.1.1. Dry FGD
- 7.1.2. Wet FGD
- 7.2. Market Analysis, Insights and Forecast - by End-User Industry
- 7.2.1. Power Generation
- 7.2.2. Cement
- 7.2.3. Chemical
- 7.2.4. Iron and Steel
- 7.2.5. Other End-User Industries
- 7.1. Market Analysis, Insights and Forecast - by Type
- 8. Europe FGD Systems Industry Analysis, Insights and Forecast, 2021-2033
- 8.1. Market Analysis, Insights and Forecast - by Type
- 8.1.1. Dry FGD
- 8.1.2. Wet FGD
- 8.2. Market Analysis, Insights and Forecast - by End-User Industry
- 8.2.1. Power Generation
- 8.2.2. Cement
- 8.2.3. Chemical
- 8.2.4. Iron and Steel
- 8.2.5. Other End-User Industries
- 8.1. Market Analysis, Insights and Forecast - by Type
- 9. Asia Pacific FGD Systems Industry Analysis, Insights and Forecast, 2021-2033
- 9.1. Market Analysis, Insights and Forecast - by Type
- 9.1.1. Dry FGD
- 9.1.2. Wet FGD
- 9.2. Market Analysis, Insights and Forecast - by End-User Industry
- 9.2.1. Power Generation
- 9.2.2. Cement
- 9.2.3. Chemical
- 9.2.4. Iron and Steel
- 9.2.5. Other End-User Industries
- 9.1. Market Analysis, Insights and Forecast - by Type
- 10. South America FGD Systems Industry Analysis, Insights and Forecast, 2021-2033
- 10.1. Market Analysis, Insights and Forecast - by Type
- 10.1.1. Dry FGD
- 10.1.2. Wet FGD
- 10.2. Market Analysis, Insights and Forecast - by End-User Industry
- 10.2.1. Power Generation
- 10.2.2. Cement
- 10.2.3. Chemical
- 10.2.4. Iron and Steel
- 10.2.5. Other End-User Industries
- 10.1. Market Analysis, Insights and Forecast - by Type
- 11. Middle East and Africa FGD Systems Industry Analysis, Insights and Forecast, 2021-2033
- 11.1. Market Analysis, Insights and Forecast - by Type
- 11.1.1. Dry FGD
- 11.1.2. Wet FGD
- 11.2. Market Analysis, Insights and Forecast - by End-User Industry
- 11.2.1. Power Generation
- 11.2.2. Cement
- 11.2.3. Chemical
- 11.2.4. Iron and Steel
- 11.2.5. Other End-User Industries
- 11.1. Market Analysis, Insights and Forecast - by Type
- 12. Competitive Analysis
- 12.1. Company Profiles
- 12.1.1 Ducon Technologies Inc
- 12.1.1.1. Company Overview
- 12.1.1.2. Products
- 12.1.1.3. Company Financials
- 12.1.1.4. SWOT Analysis
- 12.1.2 Hamon Corporation
- 12.1.2.1. Company Overview
- 12.1.2.2. Products
- 12.1.2.3. Company Financials
- 12.1.2.4. SWOT Analysis
- 12.1.3 Mitsubishi Hitachi Power Systems Ltd
- 12.1.3.1. Company Overview
- 12.1.3.2. Products
- 12.1.3.3. Company Financials
- 12.1.3.4. SWOT Analysis
- 12.1.4 Fujian Longking Co Ltd
- 12.1.4.1. Company Overview
- 12.1.4.2. Products
- 12.1.4.3. Company Financials
- 12.1.4.4. SWOT Analysis
- 12.1.5 Babcock & Wilcox Enterprises Inc
- 12.1.5.1. Company Overview
- 12.1.5.2. Products
- 12.1.5.3. Company Financials
- 12.1.5.4. SWOT Analysis
- 12.1.6 Thermax Ltd*List Not Exhaustive
- 12.1.6.1. Company Overview
- 12.1.6.2. Products
- 12.1.6.3. Company Financials
- 12.1.6.4. SWOT Analysis
- 12.1.7 John Wood Group PLC
- 12.1.7.1. Company Overview
- 12.1.7.2. Products
- 12.1.7.3. Company Financials
- 12.1.7.4. SWOT Analysis
- 12.1.8 Alstom S A
- 12.1.8.1. Company Overview
- 12.1.8.2. Products
- 12.1.8.3. Company Financials
- 12.1.8.4. SWOT Analysis
- 12.1.9 General Electric Company
- 12.1.9.1. Company Overview
- 12.1.9.2. Products
- 12.1.9.3. Company Financials
- 12.1.9.4. SWOT Analysis
- 12.1.10 Andritz AG
- 12.1.10.1. Company Overview
- 12.1.10.2. Products
- 12.1.10.3. Company Financials
- 12.1.10.4. SWOT Analysis
- 12.1.1 Ducon Technologies Inc
- 12.2. Market Entropy
- 12.2.1 Company's Key Areas Served
- 12.2.2 Recent Developments
- 12.3. Company Market Share Analysis 2025
- 12.3.1 Top 5 Companies Market Share Analysis
- 12.3.2 Top 3 Companies Market Share Analysis
- 12.4. List of Potential Customers
- 13. Research Methodology
List of Figures
- Figure 1: Global FGD Systems Industry Revenue Breakdown (billion, %) by Region 2025 & 2033
- Figure 2: North America FGD Systems Industry Revenue (billion), by Type 2025 & 2033
- Figure 3: North America FGD Systems Industry Revenue Share (%), by Type 2025 & 2033
- Figure 4: North America FGD Systems Industry Revenue (billion), by End-User Industry 2025 & 2033
- Figure 5: North America FGD Systems Industry Revenue Share (%), by End-User Industry 2025 & 2033
- Figure 6: North America FGD Systems Industry Revenue (billion), by Country 2025 & 2033
- Figure 7: North America FGD Systems Industry Revenue Share (%), by Country 2025 & 2033
- Figure 8: Europe FGD Systems Industry Revenue (billion), by Type 2025 & 2033
- Figure 9: Europe FGD Systems Industry Revenue Share (%), by Type 2025 & 2033
- Figure 10: Europe FGD Systems Industry Revenue (billion), by End-User Industry 2025 & 2033
- Figure 11: Europe FGD Systems Industry Revenue Share (%), by End-User Industry 2025 & 2033
- Figure 12: Europe FGD Systems Industry Revenue (billion), by Country 2025 & 2033
- Figure 13: Europe FGD Systems Industry Revenue Share (%), by Country 2025 & 2033
- Figure 14: Asia Pacific FGD Systems Industry Revenue (billion), by Type 2025 & 2033
- Figure 15: Asia Pacific FGD Systems Industry Revenue Share (%), by Type 2025 & 2033
- Figure 16: Asia Pacific FGD Systems Industry Revenue (billion), by End-User Industry 2025 & 2033
- Figure 17: Asia Pacific FGD Systems Industry Revenue Share (%), by End-User Industry 2025 & 2033
- Figure 18: Asia Pacific FGD Systems Industry Revenue (billion), by Country 2025 & 2033
- Figure 19: Asia Pacific FGD Systems Industry Revenue Share (%), by Country 2025 & 2033
- Figure 20: South America FGD Systems Industry Revenue (billion), by Type 2025 & 2033
- Figure 21: South America FGD Systems Industry Revenue Share (%), by Type 2025 & 2033
- Figure 22: South America FGD Systems Industry Revenue (billion), by End-User Industry 2025 & 2033
- Figure 23: South America FGD Systems Industry Revenue Share (%), by End-User Industry 2025 & 2033
- Figure 24: South America FGD Systems Industry Revenue (billion), by Country 2025 & 2033
- Figure 25: South America FGD Systems Industry Revenue Share (%), by Country 2025 & 2033
- Figure 26: Middle East and Africa FGD Systems Industry Revenue (billion), by Type 2025 & 2033
- Figure 27: Middle East and Africa FGD Systems Industry Revenue Share (%), by Type 2025 & 2033
- Figure 28: Middle East and Africa FGD Systems Industry Revenue (billion), by End-User Industry 2025 & 2033
- Figure 29: Middle East and Africa FGD Systems Industry Revenue Share (%), by End-User Industry 2025 & 2033
- Figure 30: Middle East and Africa FGD Systems Industry Revenue (billion), by Country 2025 & 2033
- Figure 31: Middle East and Africa FGD Systems Industry Revenue Share (%), by Country 2025 & 2033
List of Tables
- Table 1: Global FGD Systems Industry Revenue billion Forecast, by Type 2020 & 2033
- Table 2: Global FGD Systems Industry Revenue billion Forecast, by End-User Industry 2020 & 2033
- Table 3: Global FGD Systems Industry Revenue billion Forecast, by Region 2020 & 2033
- Table 4: Global FGD Systems Industry Revenue billion Forecast, by Type 2020 & 2033
- Table 5: Global FGD Systems Industry Revenue billion Forecast, by End-User Industry 2020 & 2033
- Table 6: Global FGD Systems Industry Revenue billion Forecast, by Country 2020 & 2033
- Table 7: Global FGD Systems Industry Revenue billion Forecast, by Type 2020 & 2033
- Table 8: Global FGD Systems Industry Revenue billion Forecast, by End-User Industry 2020 & 2033
- Table 9: Global FGD Systems Industry Revenue billion Forecast, by Country 2020 & 2033
- Table 10: Global FGD Systems Industry Revenue billion Forecast, by Type 2020 & 2033
- Table 11: Global FGD Systems Industry Revenue billion Forecast, by End-User Industry 2020 & 2033
- Table 12: Global FGD Systems Industry Revenue billion Forecast, by Country 2020 & 2033
- Table 13: Global FGD Systems Industry Revenue billion Forecast, by Type 2020 & 2033
- Table 14: Global FGD Systems Industry Revenue billion Forecast, by End-User Industry 2020 & 2033
- Table 15: Global FGD Systems Industry Revenue billion Forecast, by Country 2020 & 2033
- Table 16: Global FGD Systems Industry Revenue billion Forecast, by Type 2020 & 2033
- Table 17: Global FGD Systems Industry Revenue billion Forecast, by End-User Industry 2020 & 2033
- Table 18: Global FGD Systems Industry Revenue billion Forecast, by Country 2020 & 2033
Frequently Asked Questions
1. What is the projected Compound Annual Growth Rate (CAGR) of the FGD Systems Industry?
The projected CAGR is approximately 13.06%.
2. Which companies are prominent players in the FGD Systems Industry?
Key companies in the market include Ducon Technologies Inc, Hamon Corporation, Mitsubishi Hitachi Power Systems Ltd, Fujian Longking Co Ltd, Babcock & Wilcox Enterprises Inc, Thermax Ltd*List Not Exhaustive, John Wood Group PLC, Alstom S A, General Electric Company, Andritz AG.
3. What are the main segments of the FGD Systems Industry?
The market segments include Type, End-User Industry.
4. Can you provide details about the market size?
The market size is estimated to be USD 9.55 billion as of 2022.
5. What are some drivers contributing to market growth?
4.; Increasing Industrialization across the World4.; Expansion and Development of New Power Plants.
6. What are the notable trends driving market growth?
Increasing Demand from Power Generation Sector.
7. Are there any restraints impacting market growth?
4.; Increasing Adoption of Renewable Energy.
8. Can you provide examples of recent developments in the market?
N/A
9. What pricing options are available for accessing the report?
Pricing options include single-user, multi-user, and enterprise licenses priced at USD 4750, USD 5250, and USD 8750 respectively.
10. Is the market size provided in terms of value or volume?
The market size is provided in terms of value, measured in billion.
11. Are there any specific market keywords associated with the report?
Yes, the market keyword associated with the report is "FGD Systems Industry," which aids in identifying and referencing the specific market segment covered.
12. How do I determine which pricing option suits my needs best?
The pricing options vary based on user requirements and access needs. Individual users may opt for single-user licenses, while businesses requiring broader access may choose multi-user or enterprise licenses for cost-effective access to the report.
13. Are there any additional resources or data provided in the FGD Systems Industry report?
While the report offers comprehensive insights, it's advisable to review the specific contents or supplementary materials provided to ascertain if additional resources or data are available.
14. How can I stay updated on further developments or reports in the FGD Systems Industry?
To stay informed about further developments, trends, and reports in the FGD Systems Industry, consider subscribing to industry newsletters, following relevant companies and organizations, or regularly checking reputable industry news sources and publications.
Methodology
Step 1 - Identification of Relevant Samples Size from Population Database


Step 2 - Approaches for Defining Global Market Size (Value, Volume* & Price*)

Note*: In applicable scenarios
Step 3 - Data Sources
Primary Research
- Web Analytics
- Survey Reports
- Research Institute
- Latest Research Reports
- Opinion Leaders
Secondary Research
- Annual Reports
- White Paper
- Latest Press Release
- Industry Association
- Paid Database
- Investor Presentations

Step 4 - Data Triangulation
Involves using different sources of information in order to increase the validity of a study
These sources are likely to be stakeholders in a program - participants, other researchers, program staff, other community members, and so on.
Then we put all data in single framework & apply various statistical tools to find out the dynamic on the market.
During the analysis stage, feedback from the stakeholder groups would be compared to determine areas of agreement as well as areas of divergence