
Key Insights
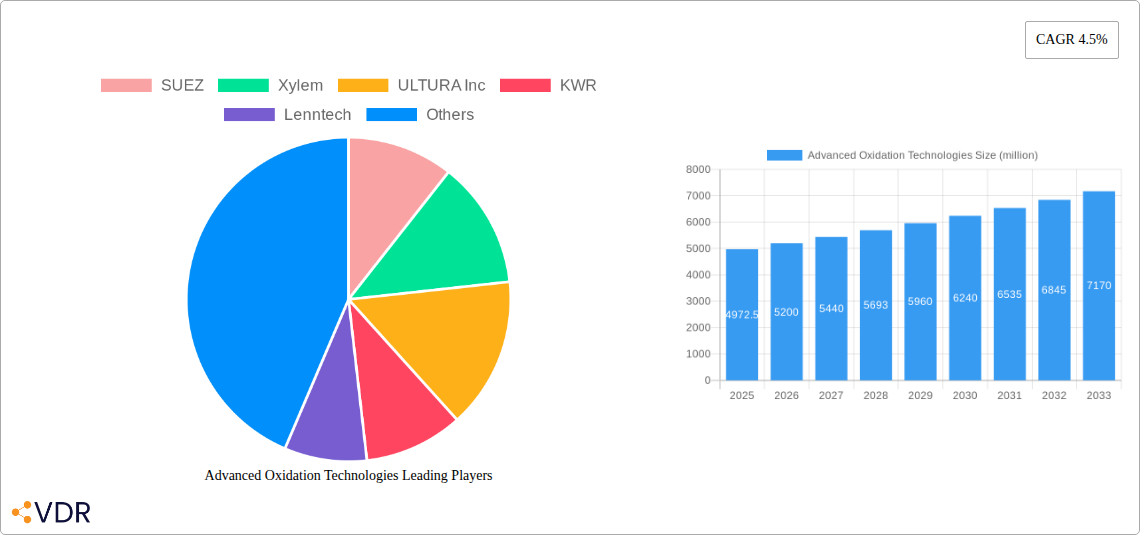
The advanced oxidation technologies (AOT) market is experiencing robust growth, projected to reach a substantial size. The market's Compound Annual Growth Rate (CAGR) of 4.5% from 2019 to 2033 indicates a steady expansion driven by increasing concerns about water pollution and stringent regulations regarding wastewater treatment. Key drivers include the rising demand for clean and safe drinking water, particularly in developing economies experiencing rapid urbanization and industrialization. The growing prevalence of emerging contaminants, such as pharmaceuticals and microplastics, which are resistant to conventional treatment methods, further fuels the adoption of AOTs. Technological advancements leading to improved efficiency, reduced operational costs, and enhanced treatment capabilities also contribute to market growth. Companies like SUEZ, Xylem, and others are actively investing in research and development, fostering innovation and expanding the application of AOTs across various sectors.
However, the market faces certain restraints. High capital investment costs associated with AOT implementation, especially for large-scale projects, can deter some potential adopters. Furthermore, the complexity of AOT processes and the need for specialized expertise can pose challenges for smaller businesses or municipalities with limited resources. Nevertheless, the long-term benefits, including improved water quality and reduced environmental impact, outweigh these initial challenges, propelling the continued expansion of the AOT market. The market is segmented by technology type (e.g., UV, Ozone, etc.), application (e.g., industrial, municipal), and geography, each presenting unique growth opportunities. Regional variations in regulatory frameworks and economic conditions influence the adoption rate of AOTs, with developed regions currently exhibiting higher adoption rates but emerging economies showcasing strong growth potential.
Advanced Oxidation Technologies Market Report: 2019-2033
This comprehensive report provides a deep dive into the Advanced Oxidation Technologies (AOT) market, offering invaluable insights for industry professionals, investors, and strategic decision-makers. With a meticulous analysis spanning the period 2019-2033 (historical period: 2019-2024; base year: 2025; forecast period: 2025-2033), this report unveils the market's dynamics, growth trajectory, and future potential. The report covers the parent market of water treatment and the child market of advanced oxidation processes, offering granular segmentation and regional analysis. The market size is predicted to reach xx million by 2033.
Advanced Oxidation Technologies Market Dynamics & Structure
The Advanced Oxidation Technologies market is characterized by moderate concentration, with key players like SUEZ, Xylem, and Calgon Carbon Corporation holding significant market share. However, the emergence of smaller, specialized companies like AST Clean Water Technologies and ATG UV Technology is fostering competition and innovation. Technological advancements, driven by the need for efficient and sustainable water treatment solutions, are a major market driver. Stringent environmental regulations worldwide are further propelling market growth, particularly in regions with stricter emission standards. The competitive landscape includes some substitution with traditional water treatment methods, but AOTs are increasingly preferred for their efficacy in treating complex pollutants. The market is predominantly driven by the industrial, municipal, and commercial sectors. M&A activity in the sector has been moderate in recent years, with approximately xx deals recorded between 2019 and 2024, indicating consolidation and expansion strategies by established players.
- Market Concentration: Moderately concentrated, with top 5 players holding approximately xx% market share in 2024.
- Technological Innovation Drivers: Demand for efficient removal of emerging contaminants, stricter environmental regulations, and advancements in UV and Ozone technologies.
- Regulatory Frameworks: Stringent environmental regulations in North America, Europe, and Asia-Pacific are key drivers.
- Competitive Product Substitutes: Traditional water treatment technologies like activated carbon filtration and membrane filtration.
- End-User Demographics: Industrial, municipal, and commercial sectors are primary end-users.
- M&A Trends: Moderate M&A activity, driven by consolidation and expansion strategies.
Advanced Oxidation Technologies Growth Trends & Insights
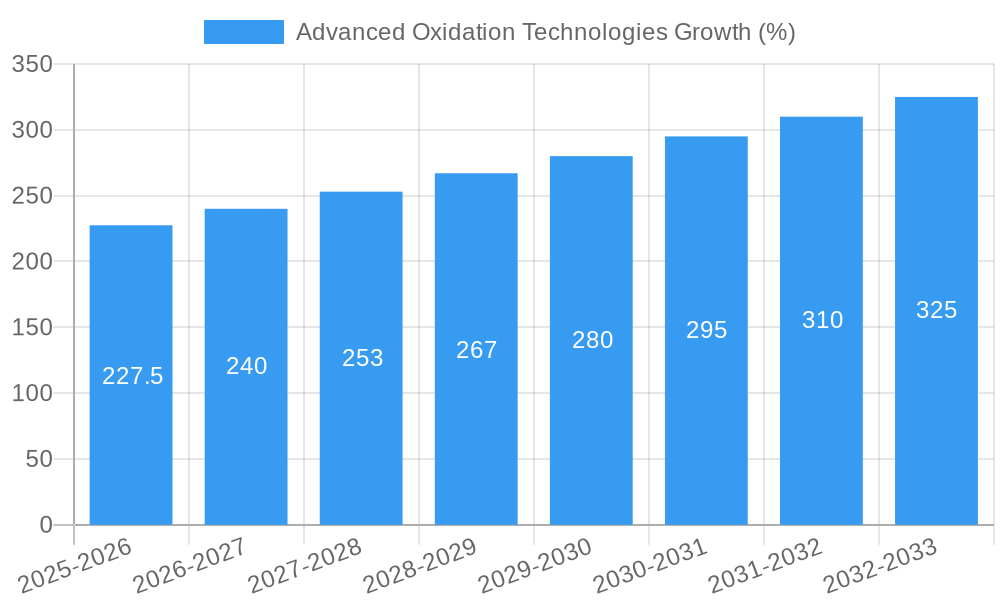
The AOT market exhibited a CAGR of xx% during the historical period (2019-2024), driven by increasing industrial wastewater treatment needs and stricter regulations. This trend is projected to continue into the forecast period (2025-2033), with a projected CAGR of xx%. The market penetration rate of AOTs in the overall water treatment market is currently estimated at xx% and is expected to increase to xx% by 2033. Technological disruptions, particularly the development of hybrid AOT systems, are accelerating market adoption. Consumer behavior shifts, reflecting a growing preference for sustainable and environmentally friendly solutions, also contributes significantly. Furthermore, increasing awareness regarding water scarcity and pollution is driving investment and demand in this sector.
Dominant Regions, Countries, or Segments in Advanced Oxidation Technologies
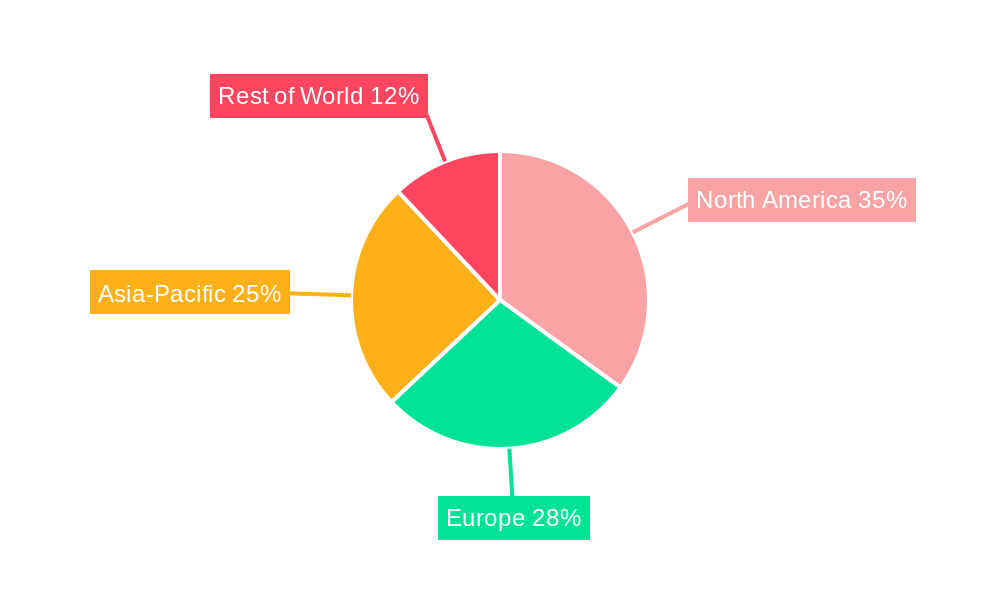
North America currently holds the largest market share in AOTs, driven by strong environmental regulations, advanced infrastructure, and significant investments in water treatment solutions. Europe follows closely, with a strong focus on sustainable water management practices. The Asia-Pacific region shows considerable growth potential, driven by rapid industrialization and increasing urbanization, leading to a substantial rise in wastewater generation and demand for efficient treatment technologies.
- Key Drivers in North America: Stringent environmental regulations, robust infrastructure, and high adoption rates in industrial sectors.
- Key Drivers in Europe: Focus on sustainable water management, strong environmental regulations, and government initiatives.
- Key Drivers in Asia-Pacific: Rapid industrialization, urbanization, and increasing awareness of water pollution.
- Market Share: North America holds approximately xx% of the global market share in 2025.
Advanced Oxidation Technologies Product Landscape
The AOT market offers a diverse range of products, including UV oxidation, ozone oxidation, and advanced hybrid systems integrating multiple technologies. These systems are designed for various applications, from treating industrial wastewater to purifying drinking water. Performance metrics focus on pollutant removal efficiency, energy consumption, and operational costs. Key innovations include the development of more energy-efficient UV lamps, improved ozone generation technologies, and hybrid systems that offer superior treatment capabilities compared to individual technologies. Unique selling propositions often center around enhanced efficiency, reduced operational costs, and broader treatment capabilities.
Key Drivers, Barriers & Challenges in Advanced Oxidation Technologies
Key Drivers: Stringent environmental regulations globally, increasing industrial wastewater volumes, growing awareness of water pollution, and technological advancements leading to improved efficiency and cost-effectiveness.
Key Challenges: High initial investment costs for AOT systems can pose a barrier to entry for smaller companies or developing economies. The complexity of AOT processes and the need for specialized expertise also present challenges. Furthermore, the fluctuating prices of raw materials and energy can impact the overall cost of operation.
Emerging Opportunities in Advanced Oxidation Technologies
Emerging opportunities lie in the development and adoption of hybrid AOT systems, integrating multiple oxidation technologies for optimal performance. Untapped markets in developing economies present significant growth potential, driven by increasing industrialization and urbanization. Innovative applications, such as the treatment of emerging contaminants like pharmaceuticals and microplastics, are also opening new avenues for growth. The rising concerns over microplastics in water bodies create a burgeoning market for specialized AOT solutions.
Growth Accelerators in the Advanced Oxidation Technologies Industry
Technological breakthroughs, such as the development of more energy-efficient UV lamps and improved ozone generation technologies, are driving long-term growth. Strategic partnerships between AOT providers and water treatment companies are facilitating market expansion. Furthermore, government initiatives promoting sustainable water management and investment in water infrastructure are creating favorable conditions for market growth.
Key Players Shaping the Advanced Oxidation Technologies Market
- SUEZ
- Xylem
- ULURA Inc
- KWR
- Lenntech
- Trussell Technologies
- Esco International
- Aquarius Technologies
- AST Clean Water Technologies
- ATG UV Technology
- MEGTEC Systems
- Calgon Carbon Corporation
- Spartan Environmental Technologies
Notable Milestones in Advanced Oxidation Technologies Sector
- 2020: Xylem launches a new line of UV disinfection systems for municipal water treatment.
- 2021: SUEZ acquires a smaller AOT company, expanding its product portfolio.
- 2022: Significant advancements in hybrid AOT technologies are showcased at industry conferences.
- 2023: Several countries implement stricter regulations on industrial wastewater discharge, boosting AOT adoption.
- 2024: A major player invests in R&D for more energy-efficient ozone generation technologies.
In-Depth Advanced Oxidation Technologies Market Outlook
The AOT market is poised for significant growth over the forecast period (2025-2033), driven by technological advancements, stringent environmental regulations, and increasing awareness of water pollution. Strategic partnerships and investments in R&D will further fuel market expansion. The development of tailored AOT solutions for specific applications, such as the treatment of emerging contaminants, will open up new market opportunities. Companies focusing on innovation, efficiency, and sustainability will be best positioned to capture significant market share in the coming years.
Advanced Oxidation Technologies Segmentation
-
1. Application
- 1.1. Soil Remediation
- 1.2. Industrial and Hazardous Waste Treatment
- 1.3. Purification
- 1.4. Others
-
2. Types
- 2.1. Wet Oxidation
- 2.2. Ozone
- 2.3. Photolysis Oxidation
- 2.4. Hydrogen Peroxide
- 2.5. Others
Advanced Oxidation Technologies Segmentation By Geography
-
1. North America
- 1.1. United States
- 1.2. Canada
- 1.3. Mexico
-
2. South America
- 2.1. Brazil
- 2.2. Argentina
- 2.3. Rest of South America
-
3. Europe
- 3.1. United Kingdom
- 3.2. Germany
- 3.3. France
- 3.4. Italy
- 3.5. Spain
- 3.6. Russia
- 3.7. Benelux
- 3.8. Nordics
- 3.9. Rest of Europe
-
4. Middle East & Africa
- 4.1. Turkey
- 4.2. Israel
- 4.3. GCC
- 4.4. North Africa
- 4.5. South Africa
- 4.6. Rest of Middle East & Africa
-
5. Asia Pacific
- 5.1. China
- 5.2. India
- 5.3. Japan
- 5.4. South Korea
- 5.5. ASEAN
- 5.6. Oceania
- 5.7. Rest of Asia Pacific
Advanced Oxidation Technologies REPORT HIGHLIGHTS
| Aspects | Details |
|---|---|
| Study Period | 2019-2033 |
| Base Year | 2024 |
| Estimated Year | 2025 |
| Forecast Period | 2025-2033 |
| Historical Period | 2019-2024 |
| Growth Rate | CAGR of 4.5% from 2019-2033 |
| Segmentation |
|
Table of Contents
- 1. Introduction
- 1.1. Research Scope
- 1.2. Market Segmentation
- 1.3. Research Methodology
- 1.4. Definitions and Assumptions
- 2. Executive Summary
- 2.1. Introduction
- 3. Market Dynamics
- 3.1. Introduction
- 3.2. Market Drivers
- 3.3. Market Restrains
- 3.4. Market Trends
- 4. Market Factor Analysis
- 4.1. Porters Five Forces
- 4.2. Supply/Value Chain
- 4.3. PESTEL analysis
- 4.4. Market Entropy
- 4.5. Patent/Trademark Analysis
- 5. Global Advanced Oxidation Technologies Analysis, Insights and Forecast, 2019-2031
- 5.1. Market Analysis, Insights and Forecast - by Application
- 5.1.1. Soil Remediation
- 5.1.2. Industrial and Hazardous Waste Treatment
- 5.1.3. Purification
- 5.1.4. Others
- 5.2. Market Analysis, Insights and Forecast - by Types
- 5.2.1. Wet Oxidation
- 5.2.2. Ozone
- 5.2.3. Photolysis Oxidation
- 5.2.4. Hydrogen Peroxide
- 5.2.5. Others
- 5.3. Market Analysis, Insights and Forecast - by Region
- 5.3.1. North America
- 5.3.2. South America
- 5.3.3. Europe
- 5.3.4. Middle East & Africa
- 5.3.5. Asia Pacific
- 5.1. Market Analysis, Insights and Forecast - by Application
- 6. North America Advanced Oxidation Technologies Analysis, Insights and Forecast, 2019-2031
- 6.1. Market Analysis, Insights and Forecast - by Application
- 6.1.1. Soil Remediation
- 6.1.2. Industrial and Hazardous Waste Treatment
- 6.1.3. Purification
- 6.1.4. Others
- 6.2. Market Analysis, Insights and Forecast - by Types
- 6.2.1. Wet Oxidation
- 6.2.2. Ozone
- 6.2.3. Photolysis Oxidation
- 6.2.4. Hydrogen Peroxide
- 6.2.5. Others
- 6.1. Market Analysis, Insights and Forecast - by Application
- 7. South America Advanced Oxidation Technologies Analysis, Insights and Forecast, 2019-2031
- 7.1. Market Analysis, Insights and Forecast - by Application
- 7.1.1. Soil Remediation
- 7.1.2. Industrial and Hazardous Waste Treatment
- 7.1.3. Purification
- 7.1.4. Others
- 7.2. Market Analysis, Insights and Forecast - by Types
- 7.2.1. Wet Oxidation
- 7.2.2. Ozone
- 7.2.3. Photolysis Oxidation
- 7.2.4. Hydrogen Peroxide
- 7.2.5. Others
- 7.1. Market Analysis, Insights and Forecast - by Application
- 8. Europe Advanced Oxidation Technologies Analysis, Insights and Forecast, 2019-2031
- 8.1. Market Analysis, Insights and Forecast - by Application
- 8.1.1. Soil Remediation
- 8.1.2. Industrial and Hazardous Waste Treatment
- 8.1.3. Purification
- 8.1.4. Others
- 8.2. Market Analysis, Insights and Forecast - by Types
- 8.2.1. Wet Oxidation
- 8.2.2. Ozone
- 8.2.3. Photolysis Oxidation
- 8.2.4. Hydrogen Peroxide
- 8.2.5. Others
- 8.1. Market Analysis, Insights and Forecast - by Application
- 9. Middle East & Africa Advanced Oxidation Technologies Analysis, Insights and Forecast, 2019-2031
- 9.1. Market Analysis, Insights and Forecast - by Application
- 9.1.1. Soil Remediation
- 9.1.2. Industrial and Hazardous Waste Treatment
- 9.1.3. Purification
- 9.1.4. Others
- 9.2. Market Analysis, Insights and Forecast - by Types
- 9.2.1. Wet Oxidation
- 9.2.2. Ozone
- 9.2.3. Photolysis Oxidation
- 9.2.4. Hydrogen Peroxide
- 9.2.5. Others
- 9.1. Market Analysis, Insights and Forecast - by Application
- 10. Asia Pacific Advanced Oxidation Technologies Analysis, Insights and Forecast, 2019-2031
- 10.1. Market Analysis, Insights and Forecast - by Application
- 10.1.1. Soil Remediation
- 10.1.2. Industrial and Hazardous Waste Treatment
- 10.1.3. Purification
- 10.1.4. Others
- 10.2. Market Analysis, Insights and Forecast - by Types
- 10.2.1. Wet Oxidation
- 10.2.2. Ozone
- 10.2.3. Photolysis Oxidation
- 10.2.4. Hydrogen Peroxide
- 10.2.5. Others
- 10.1. Market Analysis, Insights and Forecast - by Application
- 11. Competitive Analysis
- 11.1. Global Market Share Analysis 2024
- 11.2. Company Profiles
- 11.2.1 SUEZ
- 11.2.1.1. Overview
- 11.2.1.2. Products
- 11.2.1.3. SWOT Analysis
- 11.2.1.4. Recent Developments
- 11.2.1.5. Financials (Based on Availability)
- 11.2.2 Xylem
- 11.2.2.1. Overview
- 11.2.2.2. Products
- 11.2.2.3. SWOT Analysis
- 11.2.2.4. Recent Developments
- 11.2.2.5. Financials (Based on Availability)
- 11.2.3 ULTURA Inc
- 11.2.3.1. Overview
- 11.2.3.2. Products
- 11.2.3.3. SWOT Analysis
- 11.2.3.4. Recent Developments
- 11.2.3.5. Financials (Based on Availability)
- 11.2.4 KWR
- 11.2.4.1. Overview
- 11.2.4.2. Products
- 11.2.4.3. SWOT Analysis
- 11.2.4.4. Recent Developments
- 11.2.4.5. Financials (Based on Availability)
- 11.2.5 Lenntech
- 11.2.5.1. Overview
- 11.2.5.2. Products
- 11.2.5.3. SWOT Analysis
- 11.2.5.4. Recent Developments
- 11.2.5.5. Financials (Based on Availability)
- 11.2.6 Trussell Technologies
- 11.2.6.1. Overview
- 11.2.6.2. Products
- 11.2.6.3. SWOT Analysis
- 11.2.6.4. Recent Developments
- 11.2.6.5. Financials (Based on Availability)
- 11.2.7 Esco International
- 11.2.7.1. Overview
- 11.2.7.2. Products
- 11.2.7.3. SWOT Analysis
- 11.2.7.4. Recent Developments
- 11.2.7.5. Financials (Based on Availability)
- 11.2.8 Aquarius Technologies
- 11.2.8.1. Overview
- 11.2.8.2. Products
- 11.2.8.3. SWOT Analysis
- 11.2.8.4. Recent Developments
- 11.2.8.5. Financials (Based on Availability)
- 11.2.9 AST Clean Water Technologies
- 11.2.9.1. Overview
- 11.2.9.2. Products
- 11.2.9.3. SWOT Analysis
- 11.2.9.4. Recent Developments
- 11.2.9.5. Financials (Based on Availability)
- 11.2.10 ATG UV Technology
- 11.2.10.1. Overview
- 11.2.10.2. Products
- 11.2.10.3. SWOT Analysis
- 11.2.10.4. Recent Developments
- 11.2.10.5. Financials (Based on Availability)
- 11.2.11 MEGTEC Systems
- 11.2.11.1. Overview
- 11.2.11.2. Products
- 11.2.11.3. SWOT Analysis
- 11.2.11.4. Recent Developments
- 11.2.11.5. Financials (Based on Availability)
- 11.2.12 Calgon Carbon Corporation
- 11.2.12.1. Overview
- 11.2.12.2. Products
- 11.2.12.3. SWOT Analysis
- 11.2.12.4. Recent Developments
- 11.2.12.5. Financials (Based on Availability)
- 11.2.13 Spartan Environmental Technologies
- 11.2.13.1. Overview
- 11.2.13.2. Products
- 11.2.13.3. SWOT Analysis
- 11.2.13.4. Recent Developments
- 11.2.13.5. Financials (Based on Availability)
- 11.2.1 SUEZ
List of Figures
- Figure 1: Global Advanced Oxidation Technologies Revenue Breakdown (million, %) by Region 2024 & 2032
- Figure 2: North America Advanced Oxidation Technologies Revenue (million), by Application 2024 & 2032
- Figure 3: North America Advanced Oxidation Technologies Revenue Share (%), by Application 2024 & 2032
- Figure 4: North America Advanced Oxidation Technologies Revenue (million), by Types 2024 & 2032
- Figure 5: North America Advanced Oxidation Technologies Revenue Share (%), by Types 2024 & 2032
- Figure 6: North America Advanced Oxidation Technologies Revenue (million), by Country 2024 & 2032
- Figure 7: North America Advanced Oxidation Technologies Revenue Share (%), by Country 2024 & 2032
- Figure 8: South America Advanced Oxidation Technologies Revenue (million), by Application 2024 & 2032
- Figure 9: South America Advanced Oxidation Technologies Revenue Share (%), by Application 2024 & 2032
- Figure 10: South America Advanced Oxidation Technologies Revenue (million), by Types 2024 & 2032
- Figure 11: South America Advanced Oxidation Technologies Revenue Share (%), by Types 2024 & 2032
- Figure 12: South America Advanced Oxidation Technologies Revenue (million), by Country 2024 & 2032
- Figure 13: South America Advanced Oxidation Technologies Revenue Share (%), by Country 2024 & 2032
- Figure 14: Europe Advanced Oxidation Technologies Revenue (million), by Application 2024 & 2032
- Figure 15: Europe Advanced Oxidation Technologies Revenue Share (%), by Application 2024 & 2032
- Figure 16: Europe Advanced Oxidation Technologies Revenue (million), by Types 2024 & 2032
- Figure 17: Europe Advanced Oxidation Technologies Revenue Share (%), by Types 2024 & 2032
- Figure 18: Europe Advanced Oxidation Technologies Revenue (million), by Country 2024 & 2032
- Figure 19: Europe Advanced Oxidation Technologies Revenue Share (%), by Country 2024 & 2032
- Figure 20: Middle East & Africa Advanced Oxidation Technologies Revenue (million), by Application 2024 & 2032
- Figure 21: Middle East & Africa Advanced Oxidation Technologies Revenue Share (%), by Application 2024 & 2032
- Figure 22: Middle East & Africa Advanced Oxidation Technologies Revenue (million), by Types 2024 & 2032
- Figure 23: Middle East & Africa Advanced Oxidation Technologies Revenue Share (%), by Types 2024 & 2032
- Figure 24: Middle East & Africa Advanced Oxidation Technologies Revenue (million), by Country 2024 & 2032
- Figure 25: Middle East & Africa Advanced Oxidation Technologies Revenue Share (%), by Country 2024 & 2032
- Figure 26: Asia Pacific Advanced Oxidation Technologies Revenue (million), by Application 2024 & 2032
- Figure 27: Asia Pacific Advanced Oxidation Technologies Revenue Share (%), by Application 2024 & 2032
- Figure 28: Asia Pacific Advanced Oxidation Technologies Revenue (million), by Types 2024 & 2032
- Figure 29: Asia Pacific Advanced Oxidation Technologies Revenue Share (%), by Types 2024 & 2032
- Figure 30: Asia Pacific Advanced Oxidation Technologies Revenue (million), by Country 2024 & 2032
- Figure 31: Asia Pacific Advanced Oxidation Technologies Revenue Share (%), by Country 2024 & 2032
List of Tables
- Table 1: Global Advanced Oxidation Technologies Revenue million Forecast, by Region 2019 & 2032
- Table 2: Global Advanced Oxidation Technologies Revenue million Forecast, by Application 2019 & 2032
- Table 3: Global Advanced Oxidation Technologies Revenue million Forecast, by Types 2019 & 2032
- Table 4: Global Advanced Oxidation Technologies Revenue million Forecast, by Region 2019 & 2032
- Table 5: Global Advanced Oxidation Technologies Revenue million Forecast, by Application 2019 & 2032
- Table 6: Global Advanced Oxidation Technologies Revenue million Forecast, by Types 2019 & 2032
- Table 7: Global Advanced Oxidation Technologies Revenue million Forecast, by Country 2019 & 2032
- Table 8: United States Advanced Oxidation Technologies Revenue (million) Forecast, by Application 2019 & 2032
- Table 9: Canada Advanced Oxidation Technologies Revenue (million) Forecast, by Application 2019 & 2032
- Table 10: Mexico Advanced Oxidation Technologies Revenue (million) Forecast, by Application 2019 & 2032
- Table 11: Global Advanced Oxidation Technologies Revenue million Forecast, by Application 2019 & 2032
- Table 12: Global Advanced Oxidation Technologies Revenue million Forecast, by Types 2019 & 2032
- Table 13: Global Advanced Oxidation Technologies Revenue million Forecast, by Country 2019 & 2032
- Table 14: Brazil Advanced Oxidation Technologies Revenue (million) Forecast, by Application 2019 & 2032
- Table 15: Argentina Advanced Oxidation Technologies Revenue (million) Forecast, by Application 2019 & 2032
- Table 16: Rest of South America Advanced Oxidation Technologies Revenue (million) Forecast, by Application 2019 & 2032
- Table 17: Global Advanced Oxidation Technologies Revenue million Forecast, by Application 2019 & 2032
- Table 18: Global Advanced Oxidation Technologies Revenue million Forecast, by Types 2019 & 2032
- Table 19: Global Advanced Oxidation Technologies Revenue million Forecast, by Country 2019 & 2032
- Table 20: United Kingdom Advanced Oxidation Technologies Revenue (million) Forecast, by Application 2019 & 2032
- Table 21: Germany Advanced Oxidation Technologies Revenue (million) Forecast, by Application 2019 & 2032
- Table 22: France Advanced Oxidation Technologies Revenue (million) Forecast, by Application 2019 & 2032
- Table 23: Italy Advanced Oxidation Technologies Revenue (million) Forecast, by Application 2019 & 2032
- Table 24: Spain Advanced Oxidation Technologies Revenue (million) Forecast, by Application 2019 & 2032
- Table 25: Russia Advanced Oxidation Technologies Revenue (million) Forecast, by Application 2019 & 2032
- Table 26: Benelux Advanced Oxidation Technologies Revenue (million) Forecast, by Application 2019 & 2032
- Table 27: Nordics Advanced Oxidation Technologies Revenue (million) Forecast, by Application 2019 & 2032
- Table 28: Rest of Europe Advanced Oxidation Technologies Revenue (million) Forecast, by Application 2019 & 2032
- Table 29: Global Advanced Oxidation Technologies Revenue million Forecast, by Application 2019 & 2032
- Table 30: Global Advanced Oxidation Technologies Revenue million Forecast, by Types 2019 & 2032
- Table 31: Global Advanced Oxidation Technologies Revenue million Forecast, by Country 2019 & 2032
- Table 32: Turkey Advanced Oxidation Technologies Revenue (million) Forecast, by Application 2019 & 2032
- Table 33: Israel Advanced Oxidation Technologies Revenue (million) Forecast, by Application 2019 & 2032
- Table 34: GCC Advanced Oxidation Technologies Revenue (million) Forecast, by Application 2019 & 2032
- Table 35: North Africa Advanced Oxidation Technologies Revenue (million) Forecast, by Application 2019 & 2032
- Table 36: South Africa Advanced Oxidation Technologies Revenue (million) Forecast, by Application 2019 & 2032
- Table 37: Rest of Middle East & Africa Advanced Oxidation Technologies Revenue (million) Forecast, by Application 2019 & 2032
- Table 38: Global Advanced Oxidation Technologies Revenue million Forecast, by Application 2019 & 2032
- Table 39: Global Advanced Oxidation Technologies Revenue million Forecast, by Types 2019 & 2032
- Table 40: Global Advanced Oxidation Technologies Revenue million Forecast, by Country 2019 & 2032
- Table 41: China Advanced Oxidation Technologies Revenue (million) Forecast, by Application 2019 & 2032
- Table 42: India Advanced Oxidation Technologies Revenue (million) Forecast, by Application 2019 & 2032
- Table 43: Japan Advanced Oxidation Technologies Revenue (million) Forecast, by Application 2019 & 2032
- Table 44: South Korea Advanced Oxidation Technologies Revenue (million) Forecast, by Application 2019 & 2032
- Table 45: ASEAN Advanced Oxidation Technologies Revenue (million) Forecast, by Application 2019 & 2032
- Table 46: Oceania Advanced Oxidation Technologies Revenue (million) Forecast, by Application 2019 & 2032
- Table 47: Rest of Asia Pacific Advanced Oxidation Technologies Revenue (million) Forecast, by Application 2019 & 2032
Frequently Asked Questions
1. What is the projected Compound Annual Growth Rate (CAGR) of the Advanced Oxidation Technologies?
The projected CAGR is approximately 4.5%.
2. Which companies are prominent players in the Advanced Oxidation Technologies?
Key companies in the market include SUEZ, Xylem, ULTURA Inc, KWR, Lenntech, Trussell Technologies, Esco International, Aquarius Technologies, AST Clean Water Technologies, ATG UV Technology, MEGTEC Systems, Calgon Carbon Corporation, Spartan Environmental Technologies.
3. What are the main segments of the Advanced Oxidation Technologies?
The market segments include Application, Types.
4. Can you provide details about the market size?
The market size is estimated to be USD 4972.5 million as of 2022.
5. What are some drivers contributing to market growth?
N/A
6. What are the notable trends driving market growth?
N/A
7. Are there any restraints impacting market growth?
N/A
8. Can you provide examples of recent developments in the market?
N/A
9. What pricing options are available for accessing the report?
Pricing options include single-user, multi-user, and enterprise licenses priced at USD 4900.00, USD 7350.00, and USD 9800.00 respectively.
10. Is the market size provided in terms of value or volume?
The market size is provided in terms of value, measured in million.
11. Are there any specific market keywords associated with the report?
Yes, the market keyword associated with the report is "Advanced Oxidation Technologies," which aids in identifying and referencing the specific market segment covered.
12. How do I determine which pricing option suits my needs best?
The pricing options vary based on user requirements and access needs. Individual users may opt for single-user licenses, while businesses requiring broader access may choose multi-user or enterprise licenses for cost-effective access to the report.
13. Are there any additional resources or data provided in the Advanced Oxidation Technologies report?
While the report offers comprehensive insights, it's advisable to review the specific contents or supplementary materials provided to ascertain if additional resources or data are available.
14. How can I stay updated on further developments or reports in the Advanced Oxidation Technologies?
To stay informed about further developments, trends, and reports in the Advanced Oxidation Technologies, consider subscribing to industry newsletters, following relevant companies and organizations, or regularly checking reputable industry news sources and publications.
Methodology
Step 1 - Identification of Relevant Samples Size from Population Database


Step 2 - Approaches for Defining Global Market Size (Value, Volume* & Price*)

Note*: In applicable scenarios
Step 3 - Data Sources
Primary Research
- Web Analytics
- Survey Reports
- Research Institute
- Latest Research Reports
- Opinion Leaders
Secondary Research
- Annual Reports
- White Paper
- Latest Press Release
- Industry Association
- Paid Database
- Investor Presentations

Step 4 - Data Triangulation
Involves using different sources of information in order to increase the validity of a study
These sources are likely to be stakeholders in a program - participants, other researchers, program staff, other community members, and so on.
Then we put all data in single framework & apply various statistical tools to find out the dynamic on the market.
During the analysis stage, feedback from the stakeholder groups would be compared to determine areas of agreement as well as areas of divergence


