
Key Insights
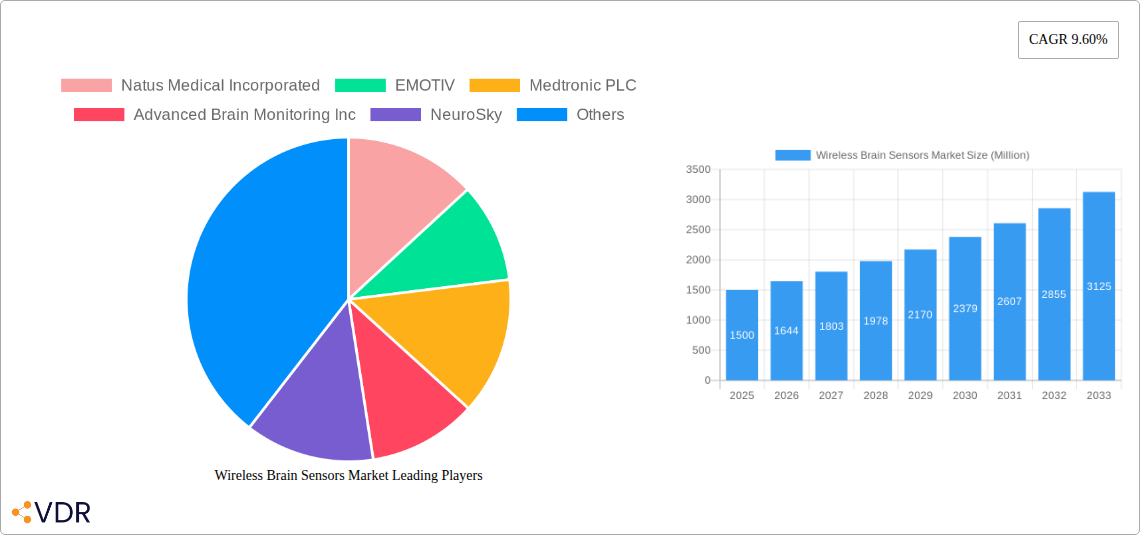
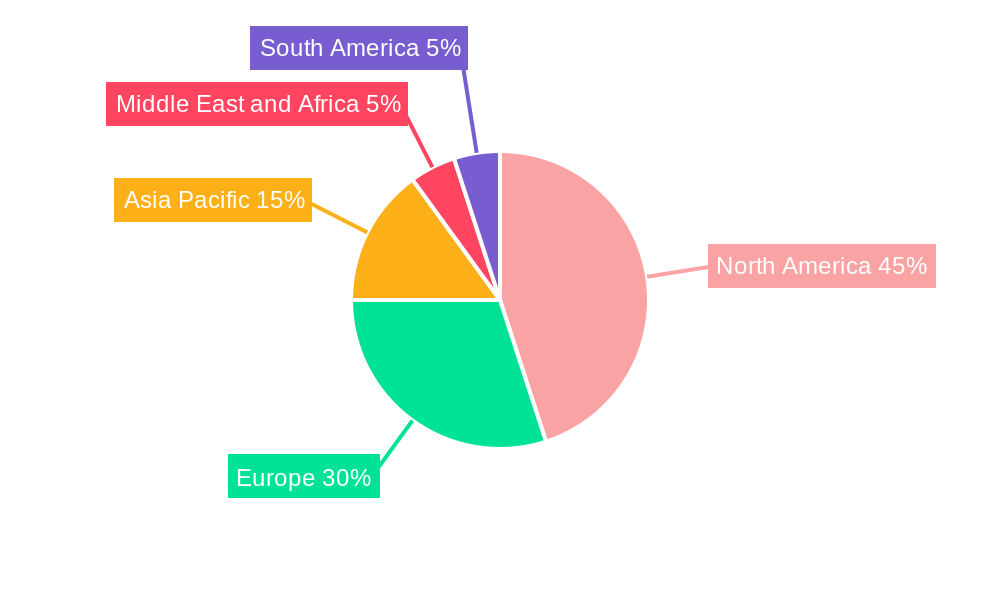
The global wireless brain sensors market is experiencing robust growth, projected to reach a significant market size driven by the increasing prevalence of neurological disorders and the rising adoption of minimally invasive diagnostic and therapeutic procedures. The 9.60% CAGR from 2019-2033 indicates a substantial expansion, particularly fueled by advancements in sensor technology, miniaturization, and improved data processing capabilities. Key applications, such as the monitoring of traumatic brain injuries, dementia, and sleep disorders, are major contributors to this market expansion. The market segmentation by product type (devices and accessories) reveals a significant demand for both core sensing units and supporting accessories, reflecting the comprehensive nature of neurological monitoring systems. Geographic analysis suggests North America and Europe currently hold substantial market shares due to well-established healthcare infrastructure and advanced research capabilities. However, rapidly developing economies in the Asia-Pacific region are poised to witness significant growth in the coming years, driven by rising healthcare expenditure and increasing awareness of neurological conditions. The competitive landscape includes established players like Natus Medical Incorporated and Medtronic PLC, along with emerging innovative companies focusing on advanced sensor technologies and data analytics.
The market's growth is further influenced by several trends. The increasing demand for remote patient monitoring, enabled by wireless connectivity, is driving the adoption of these sensors. Furthermore, technological advancements in areas like artificial intelligence and machine learning are leading to more accurate and insightful data analysis from brain sensor data, improving diagnosis and treatment efficacy. However, factors such as high initial investment costs associated with procuring and deploying these systems and concerns regarding data security and privacy pose challenges to market penetration, particularly in resource-constrained settings. Despite these restraints, the overall outlook for the wireless brain sensors market remains positive, with continuous innovation and expanding applications promising sustained growth throughout the forecast period. Ongoing research and development focused on improving sensor accuracy, reducing costs, and enhancing user-friendliness will be critical to unlocking the full potential of this transformative technology.
Wireless Brain Sensors Market: A Comprehensive Report (2019-2033)
This comprehensive report provides a detailed analysis of the Wireless Brain Sensors Market, encompassing market dynamics, growth trends, regional analysis, product landscape, key players, and future outlook. The report covers the period from 2019 to 2033, with 2025 as the base year and a forecast period from 2025 to 2033. The parent market is the broader Medical Devices Market, and the child market is specifically Neurological Monitoring Devices. The market size is projected to reach xx Million units by 2033, presenting significant growth opportunities for stakeholders.
Wireless Brain Sensors Market Dynamics & Structure
The Wireless Brain Sensors Market is characterized by a moderately concentrated competitive landscape, with key players like Natus Medical Incorporated, EMOTIV, Medtronic PLC, and Advanced Brain Monitoring Inc. holding significant market share. Technological innovation, particularly in miniaturization, improved signal processing, and enhanced wireless communication protocols, is a major driver. Regulatory frameworks, particularly those related to medical device approvals (e.g., FDA approvals in the US and CE marking in Europe), play a crucial role. Competitive substitutes, such as traditional wired EEG systems, pose a challenge, although wireless technology offers advantages in terms of patient comfort and mobility. The market's end-user demographics include hospitals, clinics, research institutions, and home healthcare settings. M&A activity in the sector has been moderate, with xx deals recorded in the historical period (2019-2024), primarily focused on expanding product portfolios and technological capabilities.
- Market Concentration: Moderately concentrated, with top 5 players holding approximately xx% market share in 2024.
- Technological Innovation: Miniaturization, improved signal processing, and advanced wireless communication are key drivers.
- Regulatory Landscape: Stringent regulatory approvals (FDA, CE marking) influence market entry and product development.
- Competitive Substitutes: Wired EEG systems and other neurodiagnostic techniques pose competitive challenges.
- End-User Demographics: Hospitals, clinics, research institutions, and home healthcare settings represent major end-user segments.
- M&A Activity: xx M&A deals recorded from 2019-2024, focusing on technological and geographical expansion.
Wireless Brain Sensors Market Growth Trends & Insights
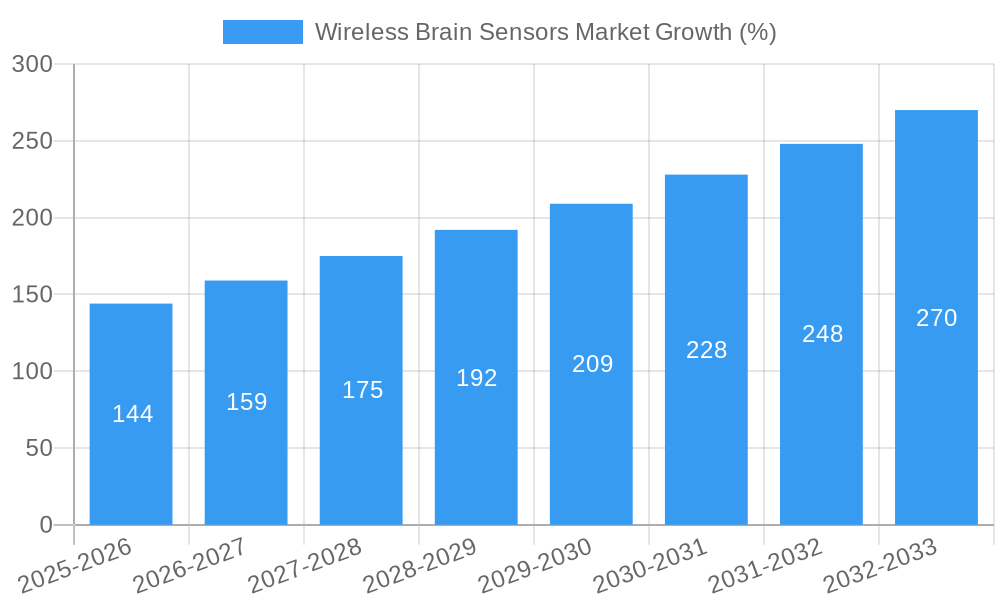
The Wireless Brain Sensors Market has witnessed significant growth from 2019 to 2024, with a CAGR of xx%. This growth is attributed to increasing prevalence of neurological disorders, rising demand for convenient and comfortable monitoring solutions, and technological advancements leading to improved accuracy and reliability. Market penetration is relatively high in developed regions but has significant growth potential in emerging markets. Adoption rates are increasing due to improved user experience, reduced healthcare costs associated with remote monitoring, and greater patient acceptance. Technological disruptions, such as the integration of AI and machine learning for enhanced data analysis, are further driving market growth. Shifting consumer behavior toward personalized healthcare and remote monitoring further fuels market expansion.
Dominant Regions, Countries, or Segments in Wireless Brain Sensors Market
North America holds the largest market share, followed by Europe, primarily driven by robust healthcare infrastructure, high adoption rates of advanced technologies, and increased funding for neurological research. Within product types, the Devices segment dominates, accounting for xx% of the market in 2024. In applications, the Traumatic Brain Injuries segment shows strong growth potential due to its significant prevalence and the need for effective monitoring.
- North America: Dominant market share due to advanced healthcare infrastructure and high technological adoption.
- Europe: Significant market presence driven by favorable regulatory environments and research funding.
- Asia Pacific: High growth potential due to increasing healthcare spending and rising prevalence of neurological disorders.
- By Product Type: Devices segment dominates, with Accessories showing steady growth.
- By Application: Traumatic Brain Injuries and Sleep Disorders segments are key growth drivers.
Wireless Brain Sensors Market Product Landscape
Wireless brain sensors are evolving rapidly, incorporating advanced features like improved signal quality, miniaturized form factors, longer battery life, and seamless integration with data analysis platforms. Several companies are developing next-generation sensors with enhanced capabilities for detecting and interpreting a wider range of neurological signals, offering improved diagnostic accuracy and patient monitoring. Key features enhancing market competitiveness include superior signal-to-noise ratios, real-time data transmission capabilities, and compatibility with various healthcare information systems (HIS).
Key Drivers, Barriers & Challenges in Wireless Brain Sensors Market
Key Drivers: Increasing prevalence of neurological disorders, rising demand for remote patient monitoring, technological advancements leading to improved accuracy and reliability, and growing adoption of telehealth.
Challenges & Restraints: High initial investment costs, complex regulatory hurdles for device approvals, potential data security and privacy concerns, and the need for skilled professionals to operate and interpret the data. Competition from established players also presents a challenge, along with supply chain disruptions impacting manufacturing and distribution.
Emerging Opportunities in Wireless Brain Sensors Market
Emerging opportunities include the integration of artificial intelligence (AI) and machine learning (ML) for advanced data analysis, expansion into untapped markets (e.g., developing countries), development of new applications in areas such as neurofeedback and brain-computer interfaces, and increased focus on personalized healthcare solutions based on individual patient needs.
Growth Accelerators in the Wireless Brain Sensors Market Industry
Technological breakthroughs in sensor miniaturization and data processing, along with strategic partnerships between sensor manufacturers and healthcare providers, are key growth accelerators. Expanding into new applications, especially in the field of sleep disorders and remote patient monitoring, will further fuel market expansion.
Key Players Shaping the Wireless Brain Sensors Market Market
- Natus Medical Incorporated
- EMOTIV
- Medtronic PLC
- Advanced Brain Monitoring Inc
- NeuroSky
- Cadwell Industries Inc
- InteraXon Inc
- NeuroWave Systems Inc
- Koninklijke Philips NV
- BrainScope
Notable Milestones in Wireless Brain Sensors Market Sector
- September 2022: Amazon launched Halo Rise, a non-wearable sleep monitor using radar technology. This signifies a shift towards convenient sleep monitoring solutions.
- September 2022: Sleepme Inc. launched Hiber-AI and a non-wearable sleep tracker, integrating real-time data analysis and personalized bed temperature adjustments. This demonstrates advancements in sleep data analysis and personalized sleep technology.
In-Depth Wireless Brain Sensors Market Market Outlook
The Wireless Brain Sensors Market is poised for substantial growth over the forecast period (2025-2033), driven by technological advancements, increasing prevalence of neurological disorders, and the growing adoption of remote patient monitoring. Strategic partnerships, market expansion into emerging economies, and the development of innovative applications will further contribute to market expansion, creating lucrative opportunities for industry players. Continued focus on improving data security, user-friendliness, and integration with existing healthcare systems will be crucial for sustained growth.
Wireless Brain Sensors Market Segmentation
-
1. Product Type
-
1.1. Devices
- 1.1.1. Electroencephalography Devices
- 1.1.2. Sleep Monitoring Devices
- 1.1.3. Other Devices
- 1.2. Accessories
-
1.1. Devices
-
2. Application
- 2.1. Traumatic Brain Injuries
- 2.2. Dementia
- 2.3. Sleep Disorders
- 2.4. Other Applications
-
3. End-User
- 3.1. Hospitals and Clinics
- 3.2. Diagnostic Centers
- 3.3. Research Institutes
- 3.4. Sports and Fitness Facilities
Wireless Brain Sensors Market Segmentation By Geography
-
1. North America
- 1.1. United States
- 1.2. Canada
- 1.3. Mexico
-
2. Europe
- 2.1. Germany
- 2.2. United Kingdom
- 2.3. France
- 2.4. Italy
- 2.5. Spain
- 2.6. Rest of Europe
-
3. Asia Pacific
- 3.1. China
- 3.2. Japan
- 3.3. India
- 3.4. Australia
- 3.5. South Korea
- 3.6. Rest of Asia Pacific
-
4. Middle East and Africa
- 4.1. GCC
- 4.2. South Africa
- 4.3. Rest of Middle East and Africa
-
5. South America
- 5.1. Brazil
- 5.2. Argentina
- 5.3. Rest of South America
Wireless Brain Sensors Market REPORT HIGHLIGHTS
| Aspects | Details |
|---|---|
| Study Period | 2019-2033 |
| Base Year | 2024 |
| Estimated Year | 2025 |
| Forecast Period | 2025-2033 |
| Historical Period | 2019-2024 |
| Growth Rate | CAGR of 9.60% from 2019-2033 |
| Segmentation |
|
Table of Contents
- 1. Introduction
- 1.1. Research Scope
- 1.2. Market Segmentation
- 1.3. Research Methodology
- 1.4. Definitions and Assumptions
- 2. Executive Summary
- 2.1. Introduction
- 3. Market Dynamics
- 3.1. Introduction
- 3.2. Market Drivers
- 3.2.1. Increasing Prevalence of Neurological Disorders; Increasing R&D Investment and Technological Advancements
- 3.3. Market Restrains
- 3.3.1. Stringent Regulation and Complexity of the Product
- 3.4. Market Trends
- 3.4.1. Traumatic Brain Injuries is Anticipated to Create Maximum Demand for Wireless Brain Sensors During the Forecast Period
- 4. Market Factor Analysis
- 4.1. Porters Five Forces
- 4.2. Supply/Value Chain
- 4.3. PESTEL analysis
- 4.4. Market Entropy
- 4.5. Patent/Trademark Analysis
- 5. Global Wireless Brain Sensors Market Analysis, Insights and Forecast, 2019-2031
- 5.1. Market Analysis, Insights and Forecast - by Product Type
- 5.1.1. Devices
- 5.1.1.1. Electroencephalography Devices
- 5.1.1.2. Sleep Monitoring Devices
- 5.1.1.3. Other Devices
- 5.1.2. Accessories
- 5.1.1. Devices
- 5.2. Market Analysis, Insights and Forecast - by Application
- 5.2.1. Traumatic Brain Injuries
- 5.2.2. Dementia
- 5.2.3. Sleep Disorders
- 5.2.4. Other Applications
- 5.3. Market Analysis, Insights and Forecast - by End-User
- 5.3.1. Hospitals and Clinics
- 5.3.2. Diagnostic Centers
- 5.3.3. Research Institutes
- 5.3.4. Sports and Fitness Facilities
- 5.4. Market Analysis, Insights and Forecast - by Region
- 5.4.1. North America
- 5.4.2. Europe
- 5.4.3. Asia Pacific
- 5.4.4. Middle East and Africa
- 5.4.5. South America
- 5.1. Market Analysis, Insights and Forecast - by Product Type
- 6. North America Wireless Brain Sensors Market Analysis, Insights and Forecast, 2019-2031
- 6.1. Market Analysis, Insights and Forecast - by Product Type
- 6.1.1. Devices
- 6.1.1.1. Electroencephalography Devices
- 6.1.1.2. Sleep Monitoring Devices
- 6.1.1.3. Other Devices
- 6.1.2. Accessories
- 6.1.1. Devices
- 6.2. Market Analysis, Insights and Forecast - by Application
- 6.2.1. Traumatic Brain Injuries
- 6.2.2. Dementia
- 6.2.3. Sleep Disorders
- 6.2.4. Other Applications
- 6.3. Market Analysis, Insights and Forecast - by End-User
- 6.3.1. Hospitals and Clinics
- 6.3.2. Diagnostic Centers
- 6.3.3. Research Institutes
- 6.3.4. Sports and Fitness Facilities
- 6.1. Market Analysis, Insights and Forecast - by Product Type
- 7. Europe Wireless Brain Sensors Market Analysis, Insights and Forecast, 2019-2031
- 7.1. Market Analysis, Insights and Forecast - by Product Type
- 7.1.1. Devices
- 7.1.1.1. Electroencephalography Devices
- 7.1.1.2. Sleep Monitoring Devices
- 7.1.1.3. Other Devices
- 7.1.2. Accessories
- 7.1.1. Devices
- 7.2. Market Analysis, Insights and Forecast - by Application
- 7.2.1. Traumatic Brain Injuries
- 7.2.2. Dementia
- 7.2.3. Sleep Disorders
- 7.2.4. Other Applications
- 7.3. Market Analysis, Insights and Forecast - by End-User
- 7.3.1. Hospitals and Clinics
- 7.3.2. Diagnostic Centers
- 7.3.3. Research Institutes
- 7.3.4. Sports and Fitness Facilities
- 7.1. Market Analysis, Insights and Forecast - by Product Type
- 8. Asia Pacific Wireless Brain Sensors Market Analysis, Insights and Forecast, 2019-2031
- 8.1. Market Analysis, Insights and Forecast - by Product Type
- 8.1.1. Devices
- 8.1.1.1. Electroencephalography Devices
- 8.1.1.2. Sleep Monitoring Devices
- 8.1.1.3. Other Devices
- 8.1.2. Accessories
- 8.1.1. Devices
- 8.2. Market Analysis, Insights and Forecast - by Application
- 8.2.1. Traumatic Brain Injuries
- 8.2.2. Dementia
- 8.2.3. Sleep Disorders
- 8.2.4. Other Applications
- 8.3. Market Analysis, Insights and Forecast - by End-User
- 8.3.1. Hospitals and Clinics
- 8.3.2. Diagnostic Centers
- 8.3.3. Research Institutes
- 8.3.4. Sports and Fitness Facilities
- 8.1. Market Analysis, Insights and Forecast - by Product Type
- 9. Middle East and Africa Wireless Brain Sensors Market Analysis, Insights and Forecast, 2019-2031
- 9.1. Market Analysis, Insights and Forecast - by Product Type
- 9.1.1. Devices
- 9.1.1.1. Electroencephalography Devices
- 9.1.1.2. Sleep Monitoring Devices
- 9.1.1.3. Other Devices
- 9.1.2. Accessories
- 9.1.1. Devices
- 9.2. Market Analysis, Insights and Forecast - by Application
- 9.2.1. Traumatic Brain Injuries
- 9.2.2. Dementia
- 9.2.3. Sleep Disorders
- 9.2.4. Other Applications
- 9.3. Market Analysis, Insights and Forecast - by End-User
- 9.3.1. Hospitals and Clinics
- 9.3.2. Diagnostic Centers
- 9.3.3. Research Institutes
- 9.3.4. Sports and Fitness Facilities
- 9.1. Market Analysis, Insights and Forecast - by Product Type
- 10. South America Wireless Brain Sensors Market Analysis, Insights and Forecast, 2019-2031
- 10.1. Market Analysis, Insights and Forecast - by Product Type
- 10.1.1. Devices
- 10.1.1.1. Electroencephalography Devices
- 10.1.1.2. Sleep Monitoring Devices
- 10.1.1.3. Other Devices
- 10.1.2. Accessories
- 10.1.1. Devices
- 10.2. Market Analysis, Insights and Forecast - by Application
- 10.2.1. Traumatic Brain Injuries
- 10.2.2. Dementia
- 10.2.3. Sleep Disorders
- 10.2.4. Other Applications
- 10.3. Market Analysis, Insights and Forecast - by End-User
- 10.3.1. Hospitals and Clinics
- 10.3.2. Diagnostic Centers
- 10.3.3. Research Institutes
- 10.3.4. Sports and Fitness Facilities
- 10.1. Market Analysis, Insights and Forecast - by Product Type
- 11. North America Wireless Brain Sensors Market Analysis, Insights and Forecast, 2019-2031
- 11.1. Market Analysis, Insights and Forecast - By Country/Sub-region
- 11.1.1 United States
- 11.1.2 Canada
- 11.1.3 Mexico
- 12. Europe Wireless Brain Sensors Market Analysis, Insights and Forecast, 2019-2031
- 12.1. Market Analysis, Insights and Forecast - By Country/Sub-region
- 12.1.1 Germany
- 12.1.2 United Kingdom
- 12.1.3 France
- 12.1.4 Italy
- 12.1.5 Spain
- 12.1.6 Rest of Europe
- 13. Asia Pacific Wireless Brain Sensors Market Analysis, Insights and Forecast, 2019-2031
- 13.1. Market Analysis, Insights and Forecast - By Country/Sub-region
- 13.1.1 China
- 13.1.2 Japan
- 13.1.3 India
- 13.1.4 Australia
- 13.1.5 South Korea
- 13.1.6 Rest of Asia Pacific
- 14. Middle East and Africa Wireless Brain Sensors Market Analysis, Insights and Forecast, 2019-2031
- 14.1. Market Analysis, Insights and Forecast - By Country/Sub-region
- 14.1.1 GCC
- 14.1.2 South Africa
- 14.1.3 Rest of Middle East and Africa
- 15. South America Wireless Brain Sensors Market Analysis, Insights and Forecast, 2019-2031
- 15.1. Market Analysis, Insights and Forecast - By Country/Sub-region
- 15.1.1 Brazil
- 15.1.2 Argentina
- 15.1.3 Rest of South America
- 16. Competitive Analysis
- 16.1. Global Market Share Analysis 2024
- 16.2. Company Profiles
- 16.2.1 Natus Medical Incorporated
- 16.2.1.1. Overview
- 16.2.1.2. Products
- 16.2.1.3. SWOT Analysis
- 16.2.1.4. Recent Developments
- 16.2.1.5. Financials (Based on Availability)
- 16.2.2 EMOTIV
- 16.2.2.1. Overview
- 16.2.2.2. Products
- 16.2.2.3. SWOT Analysis
- 16.2.2.4. Recent Developments
- 16.2.2.5. Financials (Based on Availability)
- 16.2.3 Medtronic PLC
- 16.2.3.1. Overview
- 16.2.3.2. Products
- 16.2.3.3. SWOT Analysis
- 16.2.3.4. Recent Developments
- 16.2.3.5. Financials (Based on Availability)
- 16.2.4 Advanced Brain Monitoring Inc
- 16.2.4.1. Overview
- 16.2.4.2. Products
- 16.2.4.3. SWOT Analysis
- 16.2.4.4. Recent Developments
- 16.2.4.5. Financials (Based on Availability)
- 16.2.5 NeuroSky
- 16.2.5.1. Overview
- 16.2.5.2. Products
- 16.2.5.3. SWOT Analysis
- 16.2.5.4. Recent Developments
- 16.2.5.5. Financials (Based on Availability)
- 16.2.6 Cadwell Industries Inc
- 16.2.6.1. Overview
- 16.2.6.2. Products
- 16.2.6.3. SWOT Analysis
- 16.2.6.4. Recent Developments
- 16.2.6.5. Financials (Based on Availability)
- 16.2.7 InteraXon Inc
- 16.2.7.1. Overview
- 16.2.7.2. Products
- 16.2.7.3. SWOT Analysis
- 16.2.7.4. Recent Developments
- 16.2.7.5. Financials (Based on Availability)
- 16.2.8 NeuroWave Systems Inc
- 16.2.8.1. Overview
- 16.2.8.2. Products
- 16.2.8.3. SWOT Analysis
- 16.2.8.4. Recent Developments
- 16.2.8.5. Financials (Based on Availability)
- 16.2.9 Koninklijke Philips NV
- 16.2.9.1. Overview
- 16.2.9.2. Products
- 16.2.9.3. SWOT Analysis
- 16.2.9.4. Recent Developments
- 16.2.9.5. Financials (Based on Availability)
- 16.2.10 BrainScope
- 16.2.10.1. Overview
- 16.2.10.2. Products
- 16.2.10.3. SWOT Analysis
- 16.2.10.4. Recent Developments
- 16.2.10.5. Financials (Based on Availability)
- 16.2.1 Natus Medical Incorporated
List of Figures
- Figure 1: Global Wireless Brain Sensors Market Revenue Breakdown (Million, %) by Region 2024 & 2032
- Figure 2: Global Wireless Brain Sensors Market Volume Breakdown (K Unit, %) by Region 2024 & 2032
- Figure 3: North America Wireless Brain Sensors Market Revenue (Million), by Country 2024 & 2032
- Figure 4: North America Wireless Brain Sensors Market Volume (K Unit), by Country 2024 & 2032
- Figure 5: North America Wireless Brain Sensors Market Revenue Share (%), by Country 2024 & 2032
- Figure 6: North America Wireless Brain Sensors Market Volume Share (%), by Country 2024 & 2032
- Figure 7: Europe Wireless Brain Sensors Market Revenue (Million), by Country 2024 & 2032
- Figure 8: Europe Wireless Brain Sensors Market Volume (K Unit), by Country 2024 & 2032
- Figure 9: Europe Wireless Brain Sensors Market Revenue Share (%), by Country 2024 & 2032
- Figure 10: Europe Wireless Brain Sensors Market Volume Share (%), by Country 2024 & 2032
- Figure 11: Asia Pacific Wireless Brain Sensors Market Revenue (Million), by Country 2024 & 2032
- Figure 12: Asia Pacific Wireless Brain Sensors Market Volume (K Unit), by Country 2024 & 2032
- Figure 13: Asia Pacific Wireless Brain Sensors Market Revenue Share (%), by Country 2024 & 2032
- Figure 14: Asia Pacific Wireless Brain Sensors Market Volume Share (%), by Country 2024 & 2032
- Figure 15: Middle East and Africa Wireless Brain Sensors Market Revenue (Million), by Country 2024 & 2032
- Figure 16: Middle East and Africa Wireless Brain Sensors Market Volume (K Unit), by Country 2024 & 2032
- Figure 17: Middle East and Africa Wireless Brain Sensors Market Revenue Share (%), by Country 2024 & 2032
- Figure 18: Middle East and Africa Wireless Brain Sensors Market Volume Share (%), by Country 2024 & 2032
- Figure 19: South America Wireless Brain Sensors Market Revenue (Million), by Country 2024 & 2032
- Figure 20: South America Wireless Brain Sensors Market Volume (K Unit), by Country 2024 & 2032
- Figure 21: South America Wireless Brain Sensors Market Revenue Share (%), by Country 2024 & 2032
- Figure 22: South America Wireless Brain Sensors Market Volume Share (%), by Country 2024 & 2032
- Figure 23: North America Wireless Brain Sensors Market Revenue (Million), by Product Type 2024 & 2032
- Figure 24: North America Wireless Brain Sensors Market Volume (K Unit), by Product Type 2024 & 2032
- Figure 25: North America Wireless Brain Sensors Market Revenue Share (%), by Product Type 2024 & 2032
- Figure 26: North America Wireless Brain Sensors Market Volume Share (%), by Product Type 2024 & 2032
- Figure 27: North America Wireless Brain Sensors Market Revenue (Million), by Application 2024 & 2032
- Figure 28: North America Wireless Brain Sensors Market Volume (K Unit), by Application 2024 & 2032
- Figure 29: North America Wireless Brain Sensors Market Revenue Share (%), by Application 2024 & 2032
- Figure 30: North America Wireless Brain Sensors Market Volume Share (%), by Application 2024 & 2032
- Figure 31: North America Wireless Brain Sensors Market Revenue (Million), by End-User 2024 & 2032
- Figure 32: North America Wireless Brain Sensors Market Volume (K Unit), by End-User 2024 & 2032
- Figure 33: North America Wireless Brain Sensors Market Revenue Share (%), by End-User 2024 & 2032
- Figure 34: North America Wireless Brain Sensors Market Volume Share (%), by End-User 2024 & 2032
- Figure 35: North America Wireless Brain Sensors Market Revenue (Million), by Country 2024 & 2032
- Figure 36: North America Wireless Brain Sensors Market Volume (K Unit), by Country 2024 & 2032
- Figure 37: North America Wireless Brain Sensors Market Revenue Share (%), by Country 2024 & 2032
- Figure 38: North America Wireless Brain Sensors Market Volume Share (%), by Country 2024 & 2032
- Figure 39: Europe Wireless Brain Sensors Market Revenue (Million), by Product Type 2024 & 2032
- Figure 40: Europe Wireless Brain Sensors Market Volume (K Unit), by Product Type 2024 & 2032
- Figure 41: Europe Wireless Brain Sensors Market Revenue Share (%), by Product Type 2024 & 2032
- Figure 42: Europe Wireless Brain Sensors Market Volume Share (%), by Product Type 2024 & 2032
- Figure 43: Europe Wireless Brain Sensors Market Revenue (Million), by Application 2024 & 2032
- Figure 44: Europe Wireless Brain Sensors Market Volume (K Unit), by Application 2024 & 2032
- Figure 45: Europe Wireless Brain Sensors Market Revenue Share (%), by Application 2024 & 2032
- Figure 46: Europe Wireless Brain Sensors Market Volume Share (%), by Application 2024 & 2032
- Figure 47: Europe Wireless Brain Sensors Market Revenue (Million), by End-User 2024 & 2032
- Figure 48: Europe Wireless Brain Sensors Market Volume (K Unit), by End-User 2024 & 2032
- Figure 49: Europe Wireless Brain Sensors Market Revenue Share (%), by End-User 2024 & 2032
- Figure 50: Europe Wireless Brain Sensors Market Volume Share (%), by End-User 2024 & 2032
- Figure 51: Europe Wireless Brain Sensors Market Revenue (Million), by Country 2024 & 2032
- Figure 52: Europe Wireless Brain Sensors Market Volume (K Unit), by Country 2024 & 2032
- Figure 53: Europe Wireless Brain Sensors Market Revenue Share (%), by Country 2024 & 2032
- Figure 54: Europe Wireless Brain Sensors Market Volume Share (%), by Country 2024 & 2032
- Figure 55: Asia Pacific Wireless Brain Sensors Market Revenue (Million), by Product Type 2024 & 2032
- Figure 56: Asia Pacific Wireless Brain Sensors Market Volume (K Unit), by Product Type 2024 & 2032
- Figure 57: Asia Pacific Wireless Brain Sensors Market Revenue Share (%), by Product Type 2024 & 2032
- Figure 58: Asia Pacific Wireless Brain Sensors Market Volume Share (%), by Product Type 2024 & 2032
- Figure 59: Asia Pacific Wireless Brain Sensors Market Revenue (Million), by Application 2024 & 2032
- Figure 60: Asia Pacific Wireless Brain Sensors Market Volume (K Unit), by Application 2024 & 2032
- Figure 61: Asia Pacific Wireless Brain Sensors Market Revenue Share (%), by Application 2024 & 2032
- Figure 62: Asia Pacific Wireless Brain Sensors Market Volume Share (%), by Application 2024 & 2032
- Figure 63: Asia Pacific Wireless Brain Sensors Market Revenue (Million), by End-User 2024 & 2032
- Figure 64: Asia Pacific Wireless Brain Sensors Market Volume (K Unit), by End-User 2024 & 2032
- Figure 65: Asia Pacific Wireless Brain Sensors Market Revenue Share (%), by End-User 2024 & 2032
- Figure 66: Asia Pacific Wireless Brain Sensors Market Volume Share (%), by End-User 2024 & 2032
- Figure 67: Asia Pacific Wireless Brain Sensors Market Revenue (Million), by Country 2024 & 2032
- Figure 68: Asia Pacific Wireless Brain Sensors Market Volume (K Unit), by Country 2024 & 2032
- Figure 69: Asia Pacific Wireless Brain Sensors Market Revenue Share (%), by Country 2024 & 2032
- Figure 70: Asia Pacific Wireless Brain Sensors Market Volume Share (%), by Country 2024 & 2032
- Figure 71: Middle East and Africa Wireless Brain Sensors Market Revenue (Million), by Product Type 2024 & 2032
- Figure 72: Middle East and Africa Wireless Brain Sensors Market Volume (K Unit), by Product Type 2024 & 2032
- Figure 73: Middle East and Africa Wireless Brain Sensors Market Revenue Share (%), by Product Type 2024 & 2032
- Figure 74: Middle East and Africa Wireless Brain Sensors Market Volume Share (%), by Product Type 2024 & 2032
- Figure 75: Middle East and Africa Wireless Brain Sensors Market Revenue (Million), by Application 2024 & 2032
- Figure 76: Middle East and Africa Wireless Brain Sensors Market Volume (K Unit), by Application 2024 & 2032
- Figure 77: Middle East and Africa Wireless Brain Sensors Market Revenue Share (%), by Application 2024 & 2032
- Figure 78: Middle East and Africa Wireless Brain Sensors Market Volume Share (%), by Application 2024 & 2032
- Figure 79: Middle East and Africa Wireless Brain Sensors Market Revenue (Million), by End-User 2024 & 2032
- Figure 80: Middle East and Africa Wireless Brain Sensors Market Volume (K Unit), by End-User 2024 & 2032
- Figure 81: Middle East and Africa Wireless Brain Sensors Market Revenue Share (%), by End-User 2024 & 2032
- Figure 82: Middle East and Africa Wireless Brain Sensors Market Volume Share (%), by End-User 2024 & 2032
- Figure 83: Middle East and Africa Wireless Brain Sensors Market Revenue (Million), by Country 2024 & 2032
- Figure 84: Middle East and Africa Wireless Brain Sensors Market Volume (K Unit), by Country 2024 & 2032
- Figure 85: Middle East and Africa Wireless Brain Sensors Market Revenue Share (%), by Country 2024 & 2032
- Figure 86: Middle East and Africa Wireless Brain Sensors Market Volume Share (%), by Country 2024 & 2032
- Figure 87: South America Wireless Brain Sensors Market Revenue (Million), by Product Type 2024 & 2032
- Figure 88: South America Wireless Brain Sensors Market Volume (K Unit), by Product Type 2024 & 2032
- Figure 89: South America Wireless Brain Sensors Market Revenue Share (%), by Product Type 2024 & 2032
- Figure 90: South America Wireless Brain Sensors Market Volume Share (%), by Product Type 2024 & 2032
- Figure 91: South America Wireless Brain Sensors Market Revenue (Million), by Application 2024 & 2032
- Figure 92: South America Wireless Brain Sensors Market Volume (K Unit), by Application 2024 & 2032
- Figure 93: South America Wireless Brain Sensors Market Revenue Share (%), by Application 2024 & 2032
- Figure 94: South America Wireless Brain Sensors Market Volume Share (%), by Application 2024 & 2032
- Figure 95: South America Wireless Brain Sensors Market Revenue (Million), by End-User 2024 & 2032
- Figure 96: South America Wireless Brain Sensors Market Volume (K Unit), by End-User 2024 & 2032
- Figure 97: South America Wireless Brain Sensors Market Revenue Share (%), by End-User 2024 & 2032
- Figure 98: South America Wireless Brain Sensors Market Volume Share (%), by End-User 2024 & 2032
- Figure 99: South America Wireless Brain Sensors Market Revenue (Million), by Country 2024 & 2032
- Figure 100: South America Wireless Brain Sensors Market Volume (K Unit), by Country 2024 & 2032
- Figure 101: South America Wireless Brain Sensors Market Revenue Share (%), by Country 2024 & 2032
- Figure 102: South America Wireless Brain Sensors Market Volume Share (%), by Country 2024 & 2032
List of Tables
- Table 1: Global Wireless Brain Sensors Market Revenue Million Forecast, by Region 2019 & 2032
- Table 2: Global Wireless Brain Sensors Market Volume K Unit Forecast, by Region 2019 & 2032
- Table 3: Global Wireless Brain Sensors Market Revenue Million Forecast, by Product Type 2019 & 2032
- Table 4: Global Wireless Brain Sensors Market Volume K Unit Forecast, by Product Type 2019 & 2032
- Table 5: Global Wireless Brain Sensors Market Revenue Million Forecast, by Application 2019 & 2032
- Table 6: Global Wireless Brain Sensors Market Volume K Unit Forecast, by Application 2019 & 2032
- Table 7: Global Wireless Brain Sensors Market Revenue Million Forecast, by End-User 2019 & 2032
- Table 8: Global Wireless Brain Sensors Market Volume K Unit Forecast, by End-User 2019 & 2032
- Table 9: Global Wireless Brain Sensors Market Revenue Million Forecast, by Region 2019 & 2032
- Table 10: Global Wireless Brain Sensors Market Volume K Unit Forecast, by Region 2019 & 2032
- Table 11: Global Wireless Brain Sensors Market Revenue Million Forecast, by Country 2019 & 2032
- Table 12: Global Wireless Brain Sensors Market Volume K Unit Forecast, by Country 2019 & 2032
- Table 13: United States Wireless Brain Sensors Market Revenue (Million) Forecast, by Application 2019 & 2032
- Table 14: United States Wireless Brain Sensors Market Volume (K Unit) Forecast, by Application 2019 & 2032
- Table 15: Canada Wireless Brain Sensors Market Revenue (Million) Forecast, by Application 2019 & 2032
- Table 16: Canada Wireless Brain Sensors Market Volume (K Unit) Forecast, by Application 2019 & 2032
- Table 17: Mexico Wireless Brain Sensors Market Revenue (Million) Forecast, by Application 2019 & 2032
- Table 18: Mexico Wireless Brain Sensors Market Volume (K Unit) Forecast, by Application 2019 & 2032
- Table 19: Global Wireless Brain Sensors Market Revenue Million Forecast, by Country 2019 & 2032
- Table 20: Global Wireless Brain Sensors Market Volume K Unit Forecast, by Country 2019 & 2032
- Table 21: Germany Wireless Brain Sensors Market Revenue (Million) Forecast, by Application 2019 & 2032
- Table 22: Germany Wireless Brain Sensors Market Volume (K Unit) Forecast, by Application 2019 & 2032
- Table 23: United Kingdom Wireless Brain Sensors Market Revenue (Million) Forecast, by Application 2019 & 2032
- Table 24: United Kingdom Wireless Brain Sensors Market Volume (K Unit) Forecast, by Application 2019 & 2032
- Table 25: France Wireless Brain Sensors Market Revenue (Million) Forecast, by Application 2019 & 2032
- Table 26: France Wireless Brain Sensors Market Volume (K Unit) Forecast, by Application 2019 & 2032
- Table 27: Italy Wireless Brain Sensors Market Revenue (Million) Forecast, by Application 2019 & 2032
- Table 28: Italy Wireless Brain Sensors Market Volume (K Unit) Forecast, by Application 2019 & 2032
- Table 29: Spain Wireless Brain Sensors Market Revenue (Million) Forecast, by Application 2019 & 2032
- Table 30: Spain Wireless Brain Sensors Market Volume (K Unit) Forecast, by Application 2019 & 2032
- Table 31: Rest of Europe Wireless Brain Sensors Market Revenue (Million) Forecast, by Application 2019 & 2032
- Table 32: Rest of Europe Wireless Brain Sensors Market Volume (K Unit) Forecast, by Application 2019 & 2032
- Table 33: Global Wireless Brain Sensors Market Revenue Million Forecast, by Country 2019 & 2032
- Table 34: Global Wireless Brain Sensors Market Volume K Unit Forecast, by Country 2019 & 2032
- Table 35: China Wireless Brain Sensors Market Revenue (Million) Forecast, by Application 2019 & 2032
- Table 36: China Wireless Brain Sensors Market Volume (K Unit) Forecast, by Application 2019 & 2032
- Table 37: Japan Wireless Brain Sensors Market Revenue (Million) Forecast, by Application 2019 & 2032
- Table 38: Japan Wireless Brain Sensors Market Volume (K Unit) Forecast, by Application 2019 & 2032
- Table 39: India Wireless Brain Sensors Market Revenue (Million) Forecast, by Application 2019 & 2032
- Table 40: India Wireless Brain Sensors Market Volume (K Unit) Forecast, by Application 2019 & 2032
- Table 41: Australia Wireless Brain Sensors Market Revenue (Million) Forecast, by Application 2019 & 2032
- Table 42: Australia Wireless Brain Sensors Market Volume (K Unit) Forecast, by Application 2019 & 2032
- Table 43: South Korea Wireless Brain Sensors Market Revenue (Million) Forecast, by Application 2019 & 2032
- Table 44: South Korea Wireless Brain Sensors Market Volume (K Unit) Forecast, by Application 2019 & 2032
- Table 45: Rest of Asia Pacific Wireless Brain Sensors Market Revenue (Million) Forecast, by Application 2019 & 2032
- Table 46: Rest of Asia Pacific Wireless Brain Sensors Market Volume (K Unit) Forecast, by Application 2019 & 2032
- Table 47: Global Wireless Brain Sensors Market Revenue Million Forecast, by Country 2019 & 2032
- Table 48: Global Wireless Brain Sensors Market Volume K Unit Forecast, by Country 2019 & 2032
- Table 49: GCC Wireless Brain Sensors Market Revenue (Million) Forecast, by Application 2019 & 2032
- Table 50: GCC Wireless Brain Sensors Market Volume (K Unit) Forecast, by Application 2019 & 2032
- Table 51: South Africa Wireless Brain Sensors Market Revenue (Million) Forecast, by Application 2019 & 2032
- Table 52: South Africa Wireless Brain Sensors Market Volume (K Unit) Forecast, by Application 2019 & 2032
- Table 53: Rest of Middle East and Africa Wireless Brain Sensors Market Revenue (Million) Forecast, by Application 2019 & 2032
- Table 54: Rest of Middle East and Africa Wireless Brain Sensors Market Volume (K Unit) Forecast, by Application 2019 & 2032
- Table 55: Global Wireless Brain Sensors Market Revenue Million Forecast, by Country 2019 & 2032
- Table 56: Global Wireless Brain Sensors Market Volume K Unit Forecast, by Country 2019 & 2032
- Table 57: Brazil Wireless Brain Sensors Market Revenue (Million) Forecast, by Application 2019 & 2032
- Table 58: Brazil Wireless Brain Sensors Market Volume (K Unit) Forecast, by Application 2019 & 2032
- Table 59: Argentina Wireless Brain Sensors Market Revenue (Million) Forecast, by Application 2019 & 2032
- Table 60: Argentina Wireless Brain Sensors Market Volume (K Unit) Forecast, by Application 2019 & 2032
- Table 61: Rest of South America Wireless Brain Sensors Market Revenue (Million) Forecast, by Application 2019 & 2032
- Table 62: Rest of South America Wireless Brain Sensors Market Volume (K Unit) Forecast, by Application 2019 & 2032
- Table 63: Global Wireless Brain Sensors Market Revenue Million Forecast, by Product Type 2019 & 2032
- Table 64: Global Wireless Brain Sensors Market Volume K Unit Forecast, by Product Type 2019 & 2032
- Table 65: Global Wireless Brain Sensors Market Revenue Million Forecast, by Application 2019 & 2032
- Table 66: Global Wireless Brain Sensors Market Volume K Unit Forecast, by Application 2019 & 2032
- Table 67: Global Wireless Brain Sensors Market Revenue Million Forecast, by End-User 2019 & 2032
- Table 68: Global Wireless Brain Sensors Market Volume K Unit Forecast, by End-User 2019 & 2032
- Table 69: Global Wireless Brain Sensors Market Revenue Million Forecast, by Country 2019 & 2032
- Table 70: Global Wireless Brain Sensors Market Volume K Unit Forecast, by Country 2019 & 2032
- Table 71: United States Wireless Brain Sensors Market Revenue (Million) Forecast, by Application 2019 & 2032
- Table 72: United States Wireless Brain Sensors Market Volume (K Unit) Forecast, by Application 2019 & 2032
- Table 73: Canada Wireless Brain Sensors Market Revenue (Million) Forecast, by Application 2019 & 2032
- Table 74: Canada Wireless Brain Sensors Market Volume (K Unit) Forecast, by Application 2019 & 2032
- Table 75: Mexico Wireless Brain Sensors Market Revenue (Million) Forecast, by Application 2019 & 2032
- Table 76: Mexico Wireless Brain Sensors Market Volume (K Unit) Forecast, by Application 2019 & 2032
- Table 77: Global Wireless Brain Sensors Market Revenue Million Forecast, by Product Type 2019 & 2032
- Table 78: Global Wireless Brain Sensors Market Volume K Unit Forecast, by Product Type 2019 & 2032
- Table 79: Global Wireless Brain Sensors Market Revenue Million Forecast, by Application 2019 & 2032
- Table 80: Global Wireless Brain Sensors Market Volume K Unit Forecast, by Application 2019 & 2032
- Table 81: Global Wireless Brain Sensors Market Revenue Million Forecast, by End-User 2019 & 2032
- Table 82: Global Wireless Brain Sensors Market Volume K Unit Forecast, by End-User 2019 & 2032
- Table 83: Global Wireless Brain Sensors Market Revenue Million Forecast, by Country 2019 & 2032
- Table 84: Global Wireless Brain Sensors Market Volume K Unit Forecast, by Country 2019 & 2032
- Table 85: Germany Wireless Brain Sensors Market Revenue (Million) Forecast, by Application 2019 & 2032
- Table 86: Germany Wireless Brain Sensors Market Volume (K Unit) Forecast, by Application 2019 & 2032
- Table 87: United Kingdom Wireless Brain Sensors Market Revenue (Million) Forecast, by Application 2019 & 2032
- Table 88: United Kingdom Wireless Brain Sensors Market Volume (K Unit) Forecast, by Application 2019 & 2032
- Table 89: France Wireless Brain Sensors Market Revenue (Million) Forecast, by Application 2019 & 2032
- Table 90: France Wireless Brain Sensors Market Volume (K Unit) Forecast, by Application 2019 & 2032
- Table 91: Italy Wireless Brain Sensors Market Revenue (Million) Forecast, by Application 2019 & 2032
- Table 92: Italy Wireless Brain Sensors Market Volume (K Unit) Forecast, by Application 2019 & 2032
- Table 93: Spain Wireless Brain Sensors Market Revenue (Million) Forecast, by Application 2019 & 2032
- Table 94: Spain Wireless Brain Sensors Market Volume (K Unit) Forecast, by Application 2019 & 2032
- Table 95: Rest of Europe Wireless Brain Sensors Market Revenue (Million) Forecast, by Application 2019 & 2032
- Table 96: Rest of Europe Wireless Brain Sensors Market Volume (K Unit) Forecast, by Application 2019 & 2032
- Table 97: Global Wireless Brain Sensors Market Revenue Million Forecast, by Product Type 2019 & 2032
- Table 98: Global Wireless Brain Sensors Market Volume K Unit Forecast, by Product Type 2019 & 2032
- Table 99: Global Wireless Brain Sensors Market Revenue Million Forecast, by Application 2019 & 2032
- Table 100: Global Wireless Brain Sensors Market Volume K Unit Forecast, by Application 2019 & 2032
- Table 101: Global Wireless Brain Sensors Market Revenue Million Forecast, by End-User 2019 & 2032
- Table 102: Global Wireless Brain Sensors Market Volume K Unit Forecast, by End-User 2019 & 2032
- Table 103: Global Wireless Brain Sensors Market Revenue Million Forecast, by Country 2019 & 2032
- Table 104: Global Wireless Brain Sensors Market Volume K Unit Forecast, by Country 2019 & 2032
- Table 105: China Wireless Brain Sensors Market Revenue (Million) Forecast, by Application 2019 & 2032
- Table 106: China Wireless Brain Sensors Market Volume (K Unit) Forecast, by Application 2019 & 2032
- Table 107: Japan Wireless Brain Sensors Market Revenue (Million) Forecast, by Application 2019 & 2032
- Table 108: Japan Wireless Brain Sensors Market Volume (K Unit) Forecast, by Application 2019 & 2032
- Table 109: India Wireless Brain Sensors Market Revenue (Million) Forecast, by Application 2019 & 2032
- Table 110: India Wireless Brain Sensors Market Volume (K Unit) Forecast, by Application 2019 & 2032
- Table 111: Australia Wireless Brain Sensors Market Revenue (Million) Forecast, by Application 2019 & 2032
- Table 112: Australia Wireless Brain Sensors Market Volume (K Unit) Forecast, by Application 2019 & 2032
- Table 113: South Korea Wireless Brain Sensors Market Revenue (Million) Forecast, by Application 2019 & 2032
- Table 114: South Korea Wireless Brain Sensors Market Volume (K Unit) Forecast, by Application 2019 & 2032
- Table 115: Rest of Asia Pacific Wireless Brain Sensors Market Revenue (Million) Forecast, by Application 2019 & 2032
- Table 116: Rest of Asia Pacific Wireless Brain Sensors Market Volume (K Unit) Forecast, by Application 2019 & 2032
- Table 117: Global Wireless Brain Sensors Market Revenue Million Forecast, by Product Type 2019 & 2032
- Table 118: Global Wireless Brain Sensors Market Volume K Unit Forecast, by Product Type 2019 & 2032
- Table 119: Global Wireless Brain Sensors Market Revenue Million Forecast, by Application 2019 & 2032
- Table 120: Global Wireless Brain Sensors Market Volume K Unit Forecast, by Application 2019 & 2032
- Table 121: Global Wireless Brain Sensors Market Revenue Million Forecast, by End-User 2019 & 2032
- Table 122: Global Wireless Brain Sensors Market Volume K Unit Forecast, by End-User 2019 & 2032
- Table 123: Global Wireless Brain Sensors Market Revenue Million Forecast, by Country 2019 & 2032
- Table 124: Global Wireless Brain Sensors Market Volume K Unit Forecast, by Country 2019 & 2032
- Table 125: GCC Wireless Brain Sensors Market Revenue (Million) Forecast, by Application 2019 & 2032
- Table 126: GCC Wireless Brain Sensors Market Volume (K Unit) Forecast, by Application 2019 & 2032
- Table 127: South Africa Wireless Brain Sensors Market Revenue (Million) Forecast, by Application 2019 & 2032
- Table 128: South Africa Wireless Brain Sensors Market Volume (K Unit) Forecast, by Application 2019 & 2032
- Table 129: Rest of Middle East and Africa Wireless Brain Sensors Market Revenue (Million) Forecast, by Application 2019 & 2032
- Table 130: Rest of Middle East and Africa Wireless Brain Sensors Market Volume (K Unit) Forecast, by Application 2019 & 2032
- Table 131: Global Wireless Brain Sensors Market Revenue Million Forecast, by Product Type 2019 & 2032
- Table 132: Global Wireless Brain Sensors Market Volume K Unit Forecast, by Product Type 2019 & 2032
- Table 133: Global Wireless Brain Sensors Market Revenue Million Forecast, by Application 2019 & 2032
- Table 134: Global Wireless Brain Sensors Market Volume K Unit Forecast, by Application 2019 & 2032
- Table 135: Global Wireless Brain Sensors Market Revenue Million Forecast, by End-User 2019 & 2032
- Table 136: Global Wireless Brain Sensors Market Volume K Unit Forecast, by End-User 2019 & 2032
- Table 137: Global Wireless Brain Sensors Market Revenue Million Forecast, by Country 2019 & 2032
- Table 138: Global Wireless Brain Sensors Market Volume K Unit Forecast, by Country 2019 & 2032
- Table 139: Brazil Wireless Brain Sensors Market Revenue (Million) Forecast, by Application 2019 & 2032
- Table 140: Brazil Wireless Brain Sensors Market Volume (K Unit) Forecast, by Application 2019 & 2032
- Table 141: Argentina Wireless Brain Sensors Market Revenue (Million) Forecast, by Application 2019 & 2032
- Table 142: Argentina Wireless Brain Sensors Market Volume (K Unit) Forecast, by Application 2019 & 2032
- Table 143: Rest of South America Wireless Brain Sensors Market Revenue (Million) Forecast, by Application 2019 & 2032
- Table 144: Rest of South America Wireless Brain Sensors Market Volume (K Unit) Forecast, by Application 2019 & 2032
Frequently Asked Questions
1. What is the projected Compound Annual Growth Rate (CAGR) of the Wireless Brain Sensors Market?
The projected CAGR is approximately 9.60%.
2. Which companies are prominent players in the Wireless Brain Sensors Market?
Key companies in the market include Natus Medical Incorporated, EMOTIV, Medtronic PLC, Advanced Brain Monitoring Inc, NeuroSky, Cadwell Industries Inc, InteraXon Inc, NeuroWave Systems Inc, Koninklijke Philips NV, BrainScope.
3. What are the main segments of the Wireless Brain Sensors Market?
The market segments include Product Type, Application, End-User .
4. Can you provide details about the market size?
The market size is estimated to be USD XX Million as of 2022.
5. What are some drivers contributing to market growth?
Increasing Prevalence of Neurological Disorders; Increasing R&D Investment and Technological Advancements.
6. What are the notable trends driving market growth?
Traumatic Brain Injuries is Anticipated to Create Maximum Demand for Wireless Brain Sensors During the Forecast Period.
7. Are there any restraints impacting market growth?
Stringent Regulation and Complexity of the Product.
8. Can you provide examples of recent developments in the market?
September 2022: Amazon launched its first dedicated sleep device. The novel sleep monitor minimizes the need to wear a device while sleeping. Halo Rise is a bedside device that employs sensors, essentially a form of radar, to detect how well and how long a person sleeps. It also features a digital clock so that it can operate as a full-fledged bedside clock.
9. What pricing options are available for accessing the report?
Pricing options include single-user, multi-user, and enterprise licenses priced at USD 4750, USD 5250, and USD 8750 respectively.
10. Is the market size provided in terms of value or volume?
The market size is provided in terms of value, measured in Million and volume, measured in K Unit.
11. Are there any specific market keywords associated with the report?
Yes, the market keyword associated with the report is "Wireless Brain Sensors Market," which aids in identifying and referencing the specific market segment covered.
12. How do I determine which pricing option suits my needs best?
The pricing options vary based on user requirements and access needs. Individual users may opt for single-user licenses, while businesses requiring broader access may choose multi-user or enterprise licenses for cost-effective access to the report.
13. Are there any additional resources or data provided in the Wireless Brain Sensors Market report?
While the report offers comprehensive insights, it's advisable to review the specific contents or supplementary materials provided to ascertain if additional resources or data are available.
14. How can I stay updated on further developments or reports in the Wireless Brain Sensors Market?
To stay informed about further developments, trends, and reports in the Wireless Brain Sensors Market, consider subscribing to industry newsletters, following relevant companies and organizations, or regularly checking reputable industry news sources and publications.
Methodology
Step 1 - Identification of Relevant Samples Size from Population Database


Step 2 - Approaches for Defining Global Market Size (Value, Volume* & Price*)

Note*: In applicable scenarios
Step 3 - Data Sources
Primary Research
- Web Analytics
- Survey Reports
- Research Institute
- Latest Research Reports
- Opinion Leaders
Secondary Research
- Annual Reports
- White Paper
- Latest Press Release
- Industry Association
- Paid Database
- Investor Presentations

Step 4 - Data Triangulation
Involves using different sources of information in order to increase the validity of a study
These sources are likely to be stakeholders in a program - participants, other researchers, program staff, other community members, and so on.
Then we put all data in single framework & apply various statistical tools to find out the dynamic on the market.
During the analysis stage, feedback from the stakeholder groups would be compared to determine areas of agreement as well as areas of divergence


