
Key Insights
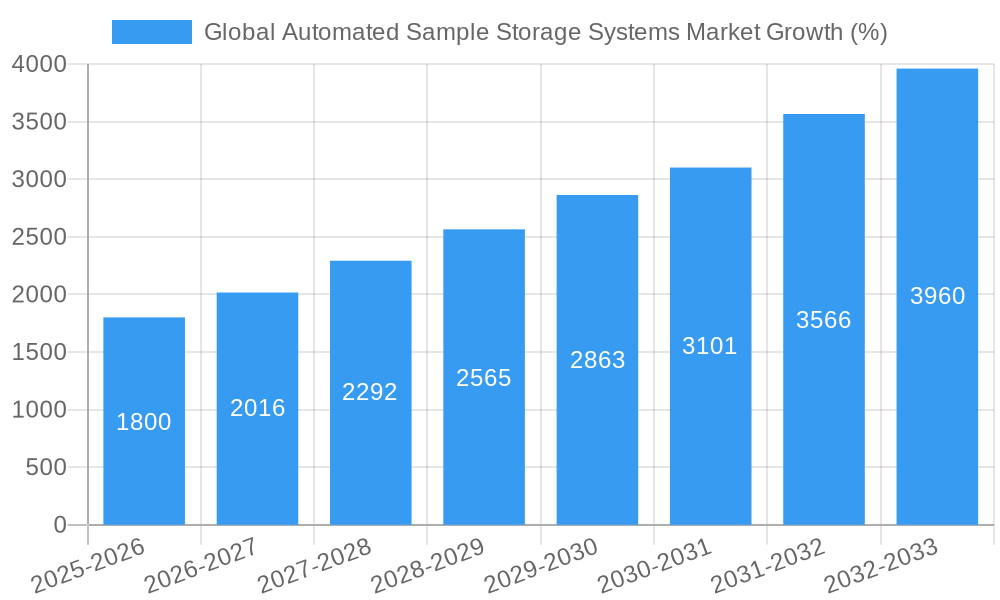
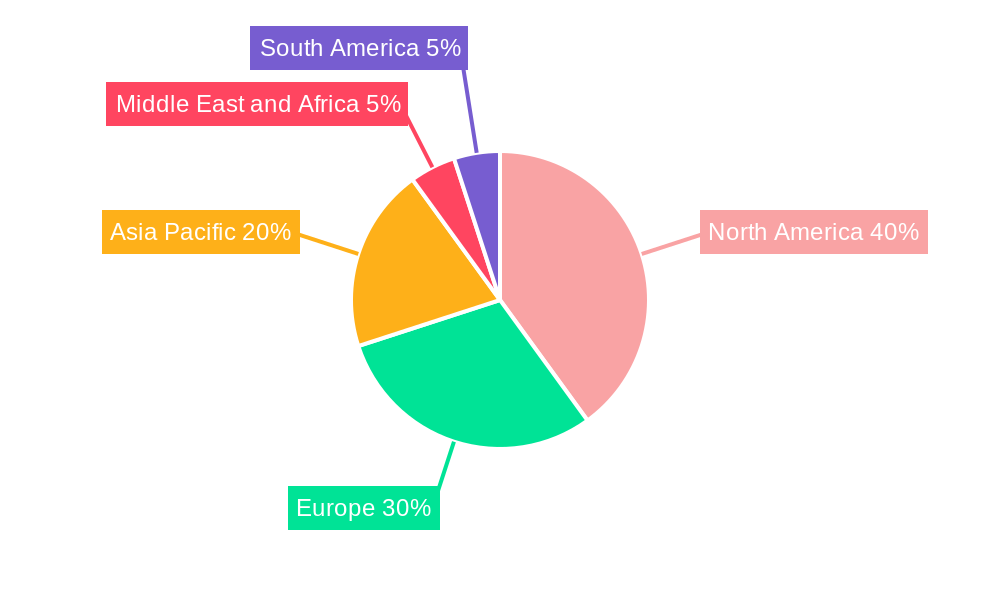
The global automated sample storage systems market is experiencing robust growth, driven by the increasing demand for efficient sample management in pharmaceutical and biotechnological research, clinical diagnostics, and industrial applications. The market's Compound Annual Growth Rate (CAGR) exceeding 12% from 2019 to 2024 signifies a significant expansion, projected to continue through 2033. Key drivers include the rising volume of biological and chemical samples generated in research and development, the need for improved sample traceability and integrity, and the increasing adoption of automation technologies to enhance efficiency and reduce human error. The market is segmented by product type (automated compound storage systems, automated liquid handling systems, and other products), sample type (biological samples, chemical compounds, and other sample types), and end-users (pharmaceutical and biotech companies, chemical industries, private biobanks, and others). The North American market currently holds a significant share due to the region's advanced healthcare infrastructure and robust pharmaceutical industry. However, the Asia-Pacific region is expected to exhibit substantial growth potential in the coming years, driven by expanding research activities and increasing investments in healthcare infrastructure in countries like China and India.
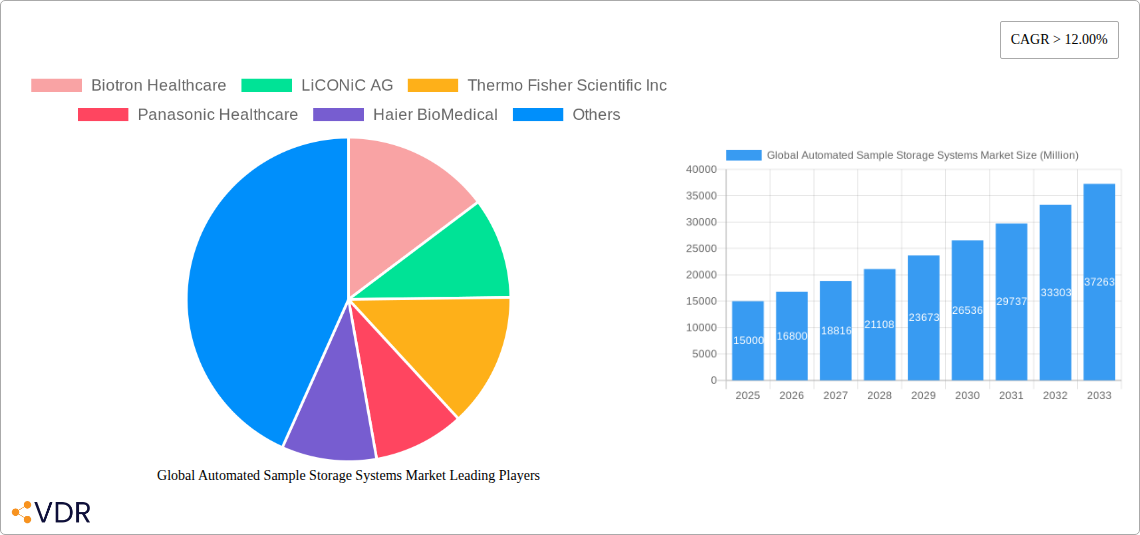
The competitive landscape is characterized by a mix of established players like Thermo Fisher Scientific, Panasonic Healthcare, and Hamilton Company, alongside specialized companies like Biotron Healthcare and LiCONiC AG. Technological advancements focusing on enhanced storage capacity, improved data management, and integration with laboratory information management systems (LIMS) are shaping the market dynamics. Furthermore, the increasing adoption of cloud-based solutions for data management and remote monitoring contributes to market expansion. While the market faces some restraints, such as high initial investment costs and the need for specialized expertise, the overall growth trajectory remains positive due to the undeniable advantages automated systems offer in terms of efficiency, data security, and cost savings in the long run. The forecast period (2025-2033) anticipates continuous growth, fueled by the aforementioned factors and emerging applications in personalized medicine and genomics.
Global Automated Sample Storage Systems Market Report: 2019-2033
This comprehensive report provides a detailed analysis of the global automated sample storage systems market, encompassing market dynamics, growth trends, regional dominance, product landscape, key players, and future outlook. The study period spans 2019-2033, with 2025 serving as the base and estimated year. The report segments the market by product (Automated Compound Storage Systems, Automated Liquid Handling Systems, Other Products), sample type (Biological Samples, Chemical Compounds, Other Sample Types), and end-users (Pharmaceutical and Biotech Companies, Chemical Industries, Private Biobanks, Other End-Users). The market is projected to reach xx Million by 2033.
Global Automated Sample Storage Systems Market Dynamics & Structure
The global automated sample storage systems market exhibits a moderately concentrated structure, with key players like Thermo Fisher Scientific Inc, Hamilton Company, and Brooks Automation holding significant market share. Technological innovation, particularly in areas like robotics, AI-driven sample management, and improved refrigeration systems, are primary growth drivers. Stringent regulatory frameworks concerning sample handling and storage, particularly within the pharmaceutical and healthcare sectors, influence market dynamics. Competitive pressures arise from the emergence of cost-effective alternatives and the increasing adoption of cloud-based sample management solutions. Mergers and acquisitions (M&A) activity, as seen in Brooks Automation's acquisition of Precise Automation, further shapes the competitive landscape. The pharmaceutical and biotech industries remain the dominant end-users, driving substantial demand.
- Market Concentration: Moderately concentrated, with top players holding xx% market share in 2025.
- Technological Innovation: Advancements in robotics, AI, and refrigeration are key drivers.
- Regulatory Landscape: Stringent regulations related to sample handling and storage influence market growth.
- Competitive Substitutes: Cloud-based sample management systems and manual storage methods pose competition.
- M&A Activity: Significant M&A activity observed, with xx deals recorded between 2019-2024.
- End-User Demographics: Pharmaceutical and biotech companies constitute the largest end-user segment (xx%).
Global Automated Sample Storage Systems Market Growth Trends & Insights
The global automated sample storage systems market witnessed robust growth during the historical period (2019-2024), expanding at a CAGR of xx%. This growth is attributed to increasing R&D investments in the pharmaceutical and biotech sectors, rising demand for high-throughput screening, and the growing need for efficient sample management in research laboratories. Technological advancements, such as the introduction of compact, high-capacity systems like Hamilton's Verso Q50 and Q75, have accelerated market adoption. The market penetration rate for automated systems is expected to reach xx% by 2033, driven by rising awareness about the benefits of automation, including reduced manual labor, enhanced sample safety, and improved data management. The shift towards personalized medicine and the growing adoption of automation in biobanks are further bolstering market growth. The forecast period (2025-2033) is expected to see continued expansion, with a projected CAGR of xx%.
Dominant Regions, Countries, or Segments in Global Automated Sample Storage Systems Market
North America currently holds the largest market share in the automated sample storage systems market, followed by Europe. This dominance is primarily driven by the strong presence of pharmaceutical and biotech companies, well-established research infrastructure, and higher adoption rates of advanced technologies. Within product segments, Automated Compound Storage Systems and Automated Liquid Handling Systems account for a significant portion of the market, due to their wide-ranging applications in drug discovery and development. Similarly, biological samples represent the largest segment by sample type, owing to the increased demand for efficient and secure storage of biological specimens.
- North America: High market share due to strong presence of pharmaceutical and biotech companies.
- Europe: Significant market growth fueled by increasing R&D investments.
- Asia-Pacific: Emerging market with high growth potential, driven by rising healthcare spending.
- Automated Compound Storage Systems: High demand driven by drug discovery and development activities.
- Biological Samples: Largest segment by sample type, driven by the need for efficient biospecimen storage.
Global Automated Sample Storage Systems Market Product Landscape
The market offers a diverse range of automated sample storage systems, varying in capacity, features, and technology. Recent innovations focus on enhancing sample security, improving user-friendliness, and integrating advanced technologies like robotics and AI for automated sample retrieval and tracking. Unique selling propositions include features such as compact design, enhanced refrigeration systems (redundant refrigeration in some models), and advanced data management capabilities. Integration with laboratory information management systems (LIMS) is also a key feature that is rapidly being adopted.
Key Drivers, Barriers & Challenges in Global Automated Sample Storage Systems Market
Key Drivers: Increasing R&D spending in the pharmaceutical and biotech sectors, growing demand for high-throughput screening, and the need for efficient sample management in research laboratories are key drivers. Government initiatives promoting automation in healthcare and research also contribute to market growth.
Challenges & Restraints: High initial investment costs, complex integration with existing lab infrastructure, and the need for skilled personnel to operate and maintain the systems represent significant challenges. Supply chain disruptions and regulatory hurdles further impede market expansion. The competitive landscape also presents challenges, with existing players and new entrants constantly striving for market share. These factors may negatively impact growth by an estimated xx% by 2030.
Emerging Opportunities in Global Automated Sample Storage Systems Market
Untapped markets in developing countries, particularly in Asia-Pacific, present significant growth opportunities. The increasing adoption of personalized medicine and the growing need for efficient biobanking solutions are driving demand. Innovative applications in areas such as point-of-care diagnostics and decentralized clinical trials are also creating new market segments. Furthermore, integration with cloud-based platforms and advancements in remote monitoring technologies offer further avenues for expansion.
Growth Accelerators in the Global Automated Sample Storage Systems Market Industry
Technological advancements, including AI-powered sample management and improved robotics, are key growth accelerators. Strategic partnerships and collaborations between technology providers and end-users are fueling innovation. Market expansion strategies, including targeted sales and marketing efforts in emerging markets and the development of customized solutions for specific applications, are driving market growth.
Key Players Shaping the Global Automated Sample Storage Systems Market Market
- Biotron Healthcare
- LiCONiC AG
- Thermo Fisher Scientific Inc
- Panasonic Healthcare
- Haier BioMedical
- Tsubakimoto Chain
- TTP LabTech
- Hamilton Company
- Brooks Automation
- ASKION GmbH
- Angelantoni Life Science
Notable Milestones in Global Automated Sample Storage Systems Market Sector
- April 2021: Brooks Automation, Inc. acquired Precise Automation, Inc., enhancing its automation capabilities.
- February 2022: Hamilton launched the Verso Q50 and Q75 automated sample storage systems, offering increased capacity and efficiency.
In-Depth Global Automated Sample Storage Systems Market Market Outlook
The global automated sample storage systems market is poised for substantial growth over the forecast period, driven by continuous technological innovation and increasing adoption across various industries. Strategic partnerships, market expansion into untapped regions, and the development of user-friendly, cost-effective solutions will further propel market expansion. The focus on improving data management capabilities and integrating systems with other laboratory technologies presents lucrative opportunities for market players. The market is expected to witness significant growth in the coming years, driven by the factors discussed above.
Global Automated Sample Storage Systems Market Segmentation
-
1. Products
- 1.1. Automated Compound Storage Systems
- 1.2. Automated Liquid Handling Systems
- 1.3. Other Products
-
2. Sample Type
- 2.1. Biological Samples
- 2.2. Chemical Compounds
- 2.3. Other Sample Types
-
3. End-Users
- 3.1. Pharmaceutical and Biotech Companies
- 3.2. Chemical Industries
- 3.3. Private Biobanks
- 3.4. Other End-Users
Global Automated Sample Storage Systems Market Segmentation By Geography
-
1. North America
- 1.1. United states
- 1.2. Canada
- 1.3. Mexico
-
2. Europe
- 2.1. Germany
- 2.2. United Kingdom
- 2.3. France
- 2.4. Italy
- 2.5. Spain
- 2.6. Rest of Europe
-
3. Asia Pacific
- 3.1. China
- 3.2. Japan
- 3.3. India
- 3.4. Australia
- 3.5. South Korea
- 3.6. Rest of Asia Pacific
-
4. Middle East and Africa
- 4.1. GCC
- 4.2. South Africa
- 4.3. Rest of Middle East and Africa
-
5. South America
- 5.1. Brazil
- 5.2. Argentina
- 5.3. Rest of South America
Global Automated Sample Storage Systems Market REPORT HIGHLIGHTS
| Aspects | Details |
|---|---|
| Study Period | 2019-2033 |
| Base Year | 2024 |
| Estimated Year | 2025 |
| Forecast Period | 2025-2033 |
| Historical Period | 2019-2024 |
| Growth Rate | CAGR of > 12.00% from 2019-2033 |
| Segmentation |
|
Table of Contents
- 1. Introduction
- 1.1. Research Scope
- 1.2. Market Segmentation
- 1.3. Research Methodology
- 1.4. Definitions and Assumptions
- 2. Executive Summary
- 2.1. Introduction
- 3. Market Dynamics
- 3.1. Introduction
- 3.2. Market Drivers
- 3.2.1. Increasing Research Activities in Biopharmaceutical Industry and Bio Banking Sectors; Reduced Labor Cost
- 3.3. Market Restrains
- 3.3.1. The Requirement for Consecutive Electricity; High Installation and Maintenance Cost
- 3.4. Market Trends
- 3.4.1. The Automated Compound Storage Systems Segment to Witness Significant Growth over the Forecast Period (2022-2027)
- 4. Market Factor Analysis
- 4.1. Porters Five Forces
- 4.2. Supply/Value Chain
- 4.3. PESTEL analysis
- 4.4. Market Entropy
- 4.5. Patent/Trademark Analysis
- 5. Global Automated Sample Storage Systems Market Analysis, Insights and Forecast, 2019-2031
- 5.1. Market Analysis, Insights and Forecast - by Products
- 5.1.1. Automated Compound Storage Systems
- 5.1.2. Automated Liquid Handling Systems
- 5.1.3. Other Products
- 5.2. Market Analysis, Insights and Forecast - by Sample Type
- 5.2.1. Biological Samples
- 5.2.2. Chemical Compounds
- 5.2.3. Other Sample Types
- 5.3. Market Analysis, Insights and Forecast - by End-Users
- 5.3.1. Pharmaceutical and Biotech Companies
- 5.3.2. Chemical Industries
- 5.3.3. Private Biobanks
- 5.3.4. Other End-Users
- 5.4. Market Analysis, Insights and Forecast - by Region
- 5.4.1. North America
- 5.4.2. Europe
- 5.4.3. Asia Pacific
- 5.4.4. Middle East and Africa
- 5.4.5. South America
- 5.1. Market Analysis, Insights and Forecast - by Products
- 6. North America Global Automated Sample Storage Systems Market Analysis, Insights and Forecast, 2019-2031
- 6.1. Market Analysis, Insights and Forecast - by Products
- 6.1.1. Automated Compound Storage Systems
- 6.1.2. Automated Liquid Handling Systems
- 6.1.3. Other Products
- 6.2. Market Analysis, Insights and Forecast - by Sample Type
- 6.2.1. Biological Samples
- 6.2.2. Chemical Compounds
- 6.2.3. Other Sample Types
- 6.3. Market Analysis, Insights and Forecast - by End-Users
- 6.3.1. Pharmaceutical and Biotech Companies
- 6.3.2. Chemical Industries
- 6.3.3. Private Biobanks
- 6.3.4. Other End-Users
- 6.1. Market Analysis, Insights and Forecast - by Products
- 7. Europe Global Automated Sample Storage Systems Market Analysis, Insights and Forecast, 2019-2031
- 7.1. Market Analysis, Insights and Forecast - by Products
- 7.1.1. Automated Compound Storage Systems
- 7.1.2. Automated Liquid Handling Systems
- 7.1.3. Other Products
- 7.2. Market Analysis, Insights and Forecast - by Sample Type
- 7.2.1. Biological Samples
- 7.2.2. Chemical Compounds
- 7.2.3. Other Sample Types
- 7.3. Market Analysis, Insights and Forecast - by End-Users
- 7.3.1. Pharmaceutical and Biotech Companies
- 7.3.2. Chemical Industries
- 7.3.3. Private Biobanks
- 7.3.4. Other End-Users
- 7.1. Market Analysis, Insights and Forecast - by Products
- 8. Asia Pacific Global Automated Sample Storage Systems Market Analysis, Insights and Forecast, 2019-2031
- 8.1. Market Analysis, Insights and Forecast - by Products
- 8.1.1. Automated Compound Storage Systems
- 8.1.2. Automated Liquid Handling Systems
- 8.1.3. Other Products
- 8.2. Market Analysis, Insights and Forecast - by Sample Type
- 8.2.1. Biological Samples
- 8.2.2. Chemical Compounds
- 8.2.3. Other Sample Types
- 8.3. Market Analysis, Insights and Forecast - by End-Users
- 8.3.1. Pharmaceutical and Biotech Companies
- 8.3.2. Chemical Industries
- 8.3.3. Private Biobanks
- 8.3.4. Other End-Users
- 8.1. Market Analysis, Insights and Forecast - by Products
- 9. Middle East and Africa Global Automated Sample Storage Systems Market Analysis, Insights and Forecast, 2019-2031
- 9.1. Market Analysis, Insights and Forecast - by Products
- 9.1.1. Automated Compound Storage Systems
- 9.1.2. Automated Liquid Handling Systems
- 9.1.3. Other Products
- 9.2. Market Analysis, Insights and Forecast - by Sample Type
- 9.2.1. Biological Samples
- 9.2.2. Chemical Compounds
- 9.2.3. Other Sample Types
- 9.3. Market Analysis, Insights and Forecast - by End-Users
- 9.3.1. Pharmaceutical and Biotech Companies
- 9.3.2. Chemical Industries
- 9.3.3. Private Biobanks
- 9.3.4. Other End-Users
- 9.1. Market Analysis, Insights and Forecast - by Products
- 10. South America Global Automated Sample Storage Systems Market Analysis, Insights and Forecast, 2019-2031
- 10.1. Market Analysis, Insights and Forecast - by Products
- 10.1.1. Automated Compound Storage Systems
- 10.1.2. Automated Liquid Handling Systems
- 10.1.3. Other Products
- 10.2. Market Analysis, Insights and Forecast - by Sample Type
- 10.2.1. Biological Samples
- 10.2.2. Chemical Compounds
- 10.2.3. Other Sample Types
- 10.3. Market Analysis, Insights and Forecast - by End-Users
- 10.3.1. Pharmaceutical and Biotech Companies
- 10.3.2. Chemical Industries
- 10.3.3. Private Biobanks
- 10.3.4. Other End-Users
- 10.1. Market Analysis, Insights and Forecast - by Products
- 11. North America Global Automated Sample Storage Systems Market Analysis, Insights and Forecast, 2019-2031
- 11.1. Market Analysis, Insights and Forecast - By Country/Sub-region
- 11.1.1 United states
- 11.1.2 Canada
- 11.1.3 Mexico
- 12. Europe Global Automated Sample Storage Systems Market Analysis, Insights and Forecast, 2019-2031
- 12.1. Market Analysis, Insights and Forecast - By Country/Sub-region
- 12.1.1 Germany
- 12.1.2 United Kingdom
- 12.1.3 France
- 12.1.4 Italy
- 12.1.5 Spain
- 12.1.6 Rest of Europe
- 13. Asia Pacific Global Automated Sample Storage Systems Market Analysis, Insights and Forecast, 2019-2031
- 13.1. Market Analysis, Insights and Forecast - By Country/Sub-region
- 13.1.1 China
- 13.1.2 Japan
- 13.1.3 India
- 13.1.4 Australia
- 13.1.5 South Korea
- 13.1.6 Rest of Asia Pacific
- 14. Middle East and Africa Global Automated Sample Storage Systems Market Analysis, Insights and Forecast, 2019-2031
- 14.1. Market Analysis, Insights and Forecast - By Country/Sub-region
- 14.1.1 GCC
- 14.1.2 South Africa
- 14.1.3 Rest of Middle East and Africa
- 15. South America Global Automated Sample Storage Systems Market Analysis, Insights and Forecast, 2019-2031
- 15.1. Market Analysis, Insights and Forecast - By Country/Sub-region
- 15.1.1 Brazil
- 15.1.2 Argentina
- 15.1.3 Rest of South America
- 16. Competitive Analysis
- 16.1. Market Share Analysis 2024
- 16.2. Company Profiles
- 16.2.1 Biotron Healthcare
- 16.2.1.1. Overview
- 16.2.1.2. Products
- 16.2.1.3. SWOT Analysis
- 16.2.1.4. Recent Developments
- 16.2.1.5. Financials (Based on Availability)
- 16.2.2 LiCONiC AG
- 16.2.2.1. Overview
- 16.2.2.2. Products
- 16.2.2.3. SWOT Analysis
- 16.2.2.4. Recent Developments
- 16.2.2.5. Financials (Based on Availability)
- 16.2.3 Thermo Fisher Scientific Inc
- 16.2.3.1. Overview
- 16.2.3.2. Products
- 16.2.3.3. SWOT Analysis
- 16.2.3.4. Recent Developments
- 16.2.3.5. Financials (Based on Availability)
- 16.2.4 Panasonic Healthcare
- 16.2.4.1. Overview
- 16.2.4.2. Products
- 16.2.4.3. SWOT Analysis
- 16.2.4.4. Recent Developments
- 16.2.4.5. Financials (Based on Availability)
- 16.2.5 Haier BioMedical
- 16.2.5.1. Overview
- 16.2.5.2. Products
- 16.2.5.3. SWOT Analysis
- 16.2.5.4. Recent Developments
- 16.2.5.5. Financials (Based on Availability)
- 16.2.6 Tsubakimoto Chain*List Not Exhaustive
- 16.2.6.1. Overview
- 16.2.6.2. Products
- 16.2.6.3. SWOT Analysis
- 16.2.6.4. Recent Developments
- 16.2.6.5. Financials (Based on Availability)
- 16.2.7 TTP LabTech
- 16.2.7.1. Overview
- 16.2.7.2. Products
- 16.2.7.3. SWOT Analysis
- 16.2.7.4. Recent Developments
- 16.2.7.5. Financials (Based on Availability)
- 16.2.8 Hamilton Company
- 16.2.8.1. Overview
- 16.2.8.2. Products
- 16.2.8.3. SWOT Analysis
- 16.2.8.4. Recent Developments
- 16.2.8.5. Financials (Based on Availability)
- 16.2.9 Brooks Automation
- 16.2.9.1. Overview
- 16.2.9.2. Products
- 16.2.9.3. SWOT Analysis
- 16.2.9.4. Recent Developments
- 16.2.9.5. Financials (Based on Availability)
- 16.2.10 ASKION GmbH
- 16.2.10.1. Overview
- 16.2.10.2. Products
- 16.2.10.3. SWOT Analysis
- 16.2.10.4. Recent Developments
- 16.2.10.5. Financials (Based on Availability)
- 16.2.11 Angelantoni Life Science
- 16.2.11.1. Overview
- 16.2.11.2. Products
- 16.2.11.3. SWOT Analysis
- 16.2.11.4. Recent Developments
- 16.2.11.5. Financials (Based on Availability)
- 16.2.1 Biotron Healthcare
List of Figures
- Figure 1: Global Global Automated Sample Storage Systems Market Revenue Breakdown (Million, %) by Region 2024 & 2032
- Figure 2: North America Global Automated Sample Storage Systems Market Revenue (Million), by Country 2024 & 2032
- Figure 3: North America Global Automated Sample Storage Systems Market Revenue Share (%), by Country 2024 & 2032
- Figure 4: Europe Global Automated Sample Storage Systems Market Revenue (Million), by Country 2024 & 2032
- Figure 5: Europe Global Automated Sample Storage Systems Market Revenue Share (%), by Country 2024 & 2032
- Figure 6: Asia Pacific Global Automated Sample Storage Systems Market Revenue (Million), by Country 2024 & 2032
- Figure 7: Asia Pacific Global Automated Sample Storage Systems Market Revenue Share (%), by Country 2024 & 2032
- Figure 8: Middle East and Africa Global Automated Sample Storage Systems Market Revenue (Million), by Country 2024 & 2032
- Figure 9: Middle East and Africa Global Automated Sample Storage Systems Market Revenue Share (%), by Country 2024 & 2032
- Figure 10: South America Global Automated Sample Storage Systems Market Revenue (Million), by Country 2024 & 2032
- Figure 11: South America Global Automated Sample Storage Systems Market Revenue Share (%), by Country 2024 & 2032
- Figure 12: North America Global Automated Sample Storage Systems Market Revenue (Million), by Products 2024 & 2032
- Figure 13: North America Global Automated Sample Storage Systems Market Revenue Share (%), by Products 2024 & 2032
- Figure 14: North America Global Automated Sample Storage Systems Market Revenue (Million), by Sample Type 2024 & 2032
- Figure 15: North America Global Automated Sample Storage Systems Market Revenue Share (%), by Sample Type 2024 & 2032
- Figure 16: North America Global Automated Sample Storage Systems Market Revenue (Million), by End-Users 2024 & 2032
- Figure 17: North America Global Automated Sample Storage Systems Market Revenue Share (%), by End-Users 2024 & 2032
- Figure 18: North America Global Automated Sample Storage Systems Market Revenue (Million), by Country 2024 & 2032
- Figure 19: North America Global Automated Sample Storage Systems Market Revenue Share (%), by Country 2024 & 2032
- Figure 20: Europe Global Automated Sample Storage Systems Market Revenue (Million), by Products 2024 & 2032
- Figure 21: Europe Global Automated Sample Storage Systems Market Revenue Share (%), by Products 2024 & 2032
- Figure 22: Europe Global Automated Sample Storage Systems Market Revenue (Million), by Sample Type 2024 & 2032
- Figure 23: Europe Global Automated Sample Storage Systems Market Revenue Share (%), by Sample Type 2024 & 2032
- Figure 24: Europe Global Automated Sample Storage Systems Market Revenue (Million), by End-Users 2024 & 2032
- Figure 25: Europe Global Automated Sample Storage Systems Market Revenue Share (%), by End-Users 2024 & 2032
- Figure 26: Europe Global Automated Sample Storage Systems Market Revenue (Million), by Country 2024 & 2032
- Figure 27: Europe Global Automated Sample Storage Systems Market Revenue Share (%), by Country 2024 & 2032
- Figure 28: Asia Pacific Global Automated Sample Storage Systems Market Revenue (Million), by Products 2024 & 2032
- Figure 29: Asia Pacific Global Automated Sample Storage Systems Market Revenue Share (%), by Products 2024 & 2032
- Figure 30: Asia Pacific Global Automated Sample Storage Systems Market Revenue (Million), by Sample Type 2024 & 2032
- Figure 31: Asia Pacific Global Automated Sample Storage Systems Market Revenue Share (%), by Sample Type 2024 & 2032
- Figure 32: Asia Pacific Global Automated Sample Storage Systems Market Revenue (Million), by End-Users 2024 & 2032
- Figure 33: Asia Pacific Global Automated Sample Storage Systems Market Revenue Share (%), by End-Users 2024 & 2032
- Figure 34: Asia Pacific Global Automated Sample Storage Systems Market Revenue (Million), by Country 2024 & 2032
- Figure 35: Asia Pacific Global Automated Sample Storage Systems Market Revenue Share (%), by Country 2024 & 2032
- Figure 36: Middle East and Africa Global Automated Sample Storage Systems Market Revenue (Million), by Products 2024 & 2032
- Figure 37: Middle East and Africa Global Automated Sample Storage Systems Market Revenue Share (%), by Products 2024 & 2032
- Figure 38: Middle East and Africa Global Automated Sample Storage Systems Market Revenue (Million), by Sample Type 2024 & 2032
- Figure 39: Middle East and Africa Global Automated Sample Storage Systems Market Revenue Share (%), by Sample Type 2024 & 2032
- Figure 40: Middle East and Africa Global Automated Sample Storage Systems Market Revenue (Million), by End-Users 2024 & 2032
- Figure 41: Middle East and Africa Global Automated Sample Storage Systems Market Revenue Share (%), by End-Users 2024 & 2032
- Figure 42: Middle East and Africa Global Automated Sample Storage Systems Market Revenue (Million), by Country 2024 & 2032
- Figure 43: Middle East and Africa Global Automated Sample Storage Systems Market Revenue Share (%), by Country 2024 & 2032
- Figure 44: South America Global Automated Sample Storage Systems Market Revenue (Million), by Products 2024 & 2032
- Figure 45: South America Global Automated Sample Storage Systems Market Revenue Share (%), by Products 2024 & 2032
- Figure 46: South America Global Automated Sample Storage Systems Market Revenue (Million), by Sample Type 2024 & 2032
- Figure 47: South America Global Automated Sample Storage Systems Market Revenue Share (%), by Sample Type 2024 & 2032
- Figure 48: South America Global Automated Sample Storage Systems Market Revenue (Million), by End-Users 2024 & 2032
- Figure 49: South America Global Automated Sample Storage Systems Market Revenue Share (%), by End-Users 2024 & 2032
- Figure 50: South America Global Automated Sample Storage Systems Market Revenue (Million), by Country 2024 & 2032
- Figure 51: South America Global Automated Sample Storage Systems Market Revenue Share (%), by Country 2024 & 2032
List of Tables
- Table 1: Global Automated Sample Storage Systems Market Revenue Million Forecast, by Region 2019 & 2032
- Table 2: Global Automated Sample Storage Systems Market Revenue Million Forecast, by Products 2019 & 2032
- Table 3: Global Automated Sample Storage Systems Market Revenue Million Forecast, by Sample Type 2019 & 2032
- Table 4: Global Automated Sample Storage Systems Market Revenue Million Forecast, by End-Users 2019 & 2032
- Table 5: Global Automated Sample Storage Systems Market Revenue Million Forecast, by Region 2019 & 2032
- Table 6: Global Automated Sample Storage Systems Market Revenue Million Forecast, by Country 2019 & 2032
- Table 7: United states Global Automated Sample Storage Systems Market Revenue (Million) Forecast, by Application 2019 & 2032
- Table 8: Canada Global Automated Sample Storage Systems Market Revenue (Million) Forecast, by Application 2019 & 2032
- Table 9: Mexico Global Automated Sample Storage Systems Market Revenue (Million) Forecast, by Application 2019 & 2032
- Table 10: Global Automated Sample Storage Systems Market Revenue Million Forecast, by Country 2019 & 2032
- Table 11: Germany Global Automated Sample Storage Systems Market Revenue (Million) Forecast, by Application 2019 & 2032
- Table 12: United Kingdom Global Automated Sample Storage Systems Market Revenue (Million) Forecast, by Application 2019 & 2032
- Table 13: France Global Automated Sample Storage Systems Market Revenue (Million) Forecast, by Application 2019 & 2032
- Table 14: Italy Global Automated Sample Storage Systems Market Revenue (Million) Forecast, by Application 2019 & 2032
- Table 15: Spain Global Automated Sample Storage Systems Market Revenue (Million) Forecast, by Application 2019 & 2032
- Table 16: Rest of Europe Global Automated Sample Storage Systems Market Revenue (Million) Forecast, by Application 2019 & 2032
- Table 17: Global Automated Sample Storage Systems Market Revenue Million Forecast, by Country 2019 & 2032
- Table 18: China Global Automated Sample Storage Systems Market Revenue (Million) Forecast, by Application 2019 & 2032
- Table 19: Japan Global Automated Sample Storage Systems Market Revenue (Million) Forecast, by Application 2019 & 2032
- Table 20: India Global Automated Sample Storage Systems Market Revenue (Million) Forecast, by Application 2019 & 2032
- Table 21: Australia Global Automated Sample Storage Systems Market Revenue (Million) Forecast, by Application 2019 & 2032
- Table 22: South Korea Global Automated Sample Storage Systems Market Revenue (Million) Forecast, by Application 2019 & 2032
- Table 23: Rest of Asia Pacific Global Automated Sample Storage Systems Market Revenue (Million) Forecast, by Application 2019 & 2032
- Table 24: Global Automated Sample Storage Systems Market Revenue Million Forecast, by Country 2019 & 2032
- Table 25: GCC Global Automated Sample Storage Systems Market Revenue (Million) Forecast, by Application 2019 & 2032
- Table 26: South Africa Global Automated Sample Storage Systems Market Revenue (Million) Forecast, by Application 2019 & 2032
- Table 27: Rest of Middle East and Africa Global Automated Sample Storage Systems Market Revenue (Million) Forecast, by Application 2019 & 2032
- Table 28: Global Automated Sample Storage Systems Market Revenue Million Forecast, by Country 2019 & 2032
- Table 29: Brazil Global Automated Sample Storage Systems Market Revenue (Million) Forecast, by Application 2019 & 2032
- Table 30: Argentina Global Automated Sample Storage Systems Market Revenue (Million) Forecast, by Application 2019 & 2032
- Table 31: Rest of South America Global Automated Sample Storage Systems Market Revenue (Million) Forecast, by Application 2019 & 2032
- Table 32: Global Automated Sample Storage Systems Market Revenue Million Forecast, by Products 2019 & 2032
- Table 33: Global Automated Sample Storage Systems Market Revenue Million Forecast, by Sample Type 2019 & 2032
- Table 34: Global Automated Sample Storage Systems Market Revenue Million Forecast, by End-Users 2019 & 2032
- Table 35: Global Automated Sample Storage Systems Market Revenue Million Forecast, by Country 2019 & 2032
- Table 36: United states Global Automated Sample Storage Systems Market Revenue (Million) Forecast, by Application 2019 & 2032
- Table 37: Canada Global Automated Sample Storage Systems Market Revenue (Million) Forecast, by Application 2019 & 2032
- Table 38: Mexico Global Automated Sample Storage Systems Market Revenue (Million) Forecast, by Application 2019 & 2032
- Table 39: Global Automated Sample Storage Systems Market Revenue Million Forecast, by Products 2019 & 2032
- Table 40: Global Automated Sample Storage Systems Market Revenue Million Forecast, by Sample Type 2019 & 2032
- Table 41: Global Automated Sample Storage Systems Market Revenue Million Forecast, by End-Users 2019 & 2032
- Table 42: Global Automated Sample Storage Systems Market Revenue Million Forecast, by Country 2019 & 2032
- Table 43: Germany Global Automated Sample Storage Systems Market Revenue (Million) Forecast, by Application 2019 & 2032
- Table 44: United Kingdom Global Automated Sample Storage Systems Market Revenue (Million) Forecast, by Application 2019 & 2032
- Table 45: France Global Automated Sample Storage Systems Market Revenue (Million) Forecast, by Application 2019 & 2032
- Table 46: Italy Global Automated Sample Storage Systems Market Revenue (Million) Forecast, by Application 2019 & 2032
- Table 47: Spain Global Automated Sample Storage Systems Market Revenue (Million) Forecast, by Application 2019 & 2032
- Table 48: Rest of Europe Global Automated Sample Storage Systems Market Revenue (Million) Forecast, by Application 2019 & 2032
- Table 49: Global Automated Sample Storage Systems Market Revenue Million Forecast, by Products 2019 & 2032
- Table 50: Global Automated Sample Storage Systems Market Revenue Million Forecast, by Sample Type 2019 & 2032
- Table 51: Global Automated Sample Storage Systems Market Revenue Million Forecast, by End-Users 2019 & 2032
- Table 52: Global Automated Sample Storage Systems Market Revenue Million Forecast, by Country 2019 & 2032
- Table 53: China Global Automated Sample Storage Systems Market Revenue (Million) Forecast, by Application 2019 & 2032
- Table 54: Japan Global Automated Sample Storage Systems Market Revenue (Million) Forecast, by Application 2019 & 2032
- Table 55: India Global Automated Sample Storage Systems Market Revenue (Million) Forecast, by Application 2019 & 2032
- Table 56: Australia Global Automated Sample Storage Systems Market Revenue (Million) Forecast, by Application 2019 & 2032
- Table 57: South Korea Global Automated Sample Storage Systems Market Revenue (Million) Forecast, by Application 2019 & 2032
- Table 58: Rest of Asia Pacific Global Automated Sample Storage Systems Market Revenue (Million) Forecast, by Application 2019 & 2032
- Table 59: Global Automated Sample Storage Systems Market Revenue Million Forecast, by Products 2019 & 2032
- Table 60: Global Automated Sample Storage Systems Market Revenue Million Forecast, by Sample Type 2019 & 2032
- Table 61: Global Automated Sample Storage Systems Market Revenue Million Forecast, by End-Users 2019 & 2032
- Table 62: Global Automated Sample Storage Systems Market Revenue Million Forecast, by Country 2019 & 2032
- Table 63: GCC Global Automated Sample Storage Systems Market Revenue (Million) Forecast, by Application 2019 & 2032
- Table 64: South Africa Global Automated Sample Storage Systems Market Revenue (Million) Forecast, by Application 2019 & 2032
- Table 65: Rest of Middle East and Africa Global Automated Sample Storage Systems Market Revenue (Million) Forecast, by Application 2019 & 2032
- Table 66: Global Automated Sample Storage Systems Market Revenue Million Forecast, by Products 2019 & 2032
- Table 67: Global Automated Sample Storage Systems Market Revenue Million Forecast, by Sample Type 2019 & 2032
- Table 68: Global Automated Sample Storage Systems Market Revenue Million Forecast, by End-Users 2019 & 2032
- Table 69: Global Automated Sample Storage Systems Market Revenue Million Forecast, by Country 2019 & 2032
- Table 70: Brazil Global Automated Sample Storage Systems Market Revenue (Million) Forecast, by Application 2019 & 2032
- Table 71: Argentina Global Automated Sample Storage Systems Market Revenue (Million) Forecast, by Application 2019 & 2032
- Table 72: Rest of South America Global Automated Sample Storage Systems Market Revenue (Million) Forecast, by Application 2019 & 2032
Frequently Asked Questions
1. What is the projected Compound Annual Growth Rate (CAGR) of the Global Automated Sample Storage Systems Market?
The projected CAGR is approximately > 12.00%.
2. Which companies are prominent players in the Global Automated Sample Storage Systems Market?
Key companies in the market include Biotron Healthcare, LiCONiC AG, Thermo Fisher Scientific Inc, Panasonic Healthcare, Haier BioMedical, Tsubakimoto Chain*List Not Exhaustive, TTP LabTech, Hamilton Company, Brooks Automation, ASKION GmbH, Angelantoni Life Science.
3. What are the main segments of the Global Automated Sample Storage Systems Market?
The market segments include Products, Sample Type, End-Users.
4. Can you provide details about the market size?
The market size is estimated to be USD XX Million as of 2022.
5. What are some drivers contributing to market growth?
Increasing Research Activities in Biopharmaceutical Industry and Bio Banking Sectors; Reduced Labor Cost.
6. What are the notable trends driving market growth?
The Automated Compound Storage Systems Segment to Witness Significant Growth over the Forecast Period (2022-2027).
7. Are there any restraints impacting market growth?
The Requirement for Consecutive Electricity; High Installation and Maintenance Cost.
8. Can you provide examples of recent developments in the market?
In April 2021, Brooks Automation, Inc. announced the acquisition of Precise Automation, Inc. Precise Automation's proprietary technology has enabled human-robot workflows in a safe and easy-to-use manner, automating processes. Precise Automation's products can be used in a variety of end markets including laboratory automation.
9. What pricing options are available for accessing the report?
Pricing options include single-user, multi-user, and enterprise licenses priced at USD 4750, USD 5250, and USD 8750 respectively.
10. Is the market size provided in terms of value or volume?
The market size is provided in terms of value, measured in Million.
11. Are there any specific market keywords associated with the report?
Yes, the market keyword associated with the report is "Global Automated Sample Storage Systems Market," which aids in identifying and referencing the specific market segment covered.
12. How do I determine which pricing option suits my needs best?
The pricing options vary based on user requirements and access needs. Individual users may opt for single-user licenses, while businesses requiring broader access may choose multi-user or enterprise licenses for cost-effective access to the report.
13. Are there any additional resources or data provided in the Global Automated Sample Storage Systems Market report?
While the report offers comprehensive insights, it's advisable to review the specific contents or supplementary materials provided to ascertain if additional resources or data are available.
14. How can I stay updated on further developments or reports in the Global Automated Sample Storage Systems Market?
To stay informed about further developments, trends, and reports in the Global Automated Sample Storage Systems Market, consider subscribing to industry newsletters, following relevant companies and organizations, or regularly checking reputable industry news sources and publications.
Methodology
Step 1 - Identification of Relevant Samples Size from Population Database


Step 2 - Approaches for Defining Global Market Size (Value, Volume* & Price*)

Note*: In applicable scenarios
Step 3 - Data Sources
Primary Research
- Web Analytics
- Survey Reports
- Research Institute
- Latest Research Reports
- Opinion Leaders
Secondary Research
- Annual Reports
- White Paper
- Latest Press Release
- Industry Association
- Paid Database
- Investor Presentations

Step 4 - Data Triangulation
Involves using different sources of information in order to increase the validity of a study
These sources are likely to be stakeholders in a program - participants, other researchers, program staff, other community members, and so on.
Then we put all data in single framework & apply various statistical tools to find out the dynamic on the market.
During the analysis stage, feedback from the stakeholder groups would be compared to determine areas of agreement as well as areas of divergence


