
Key Insights
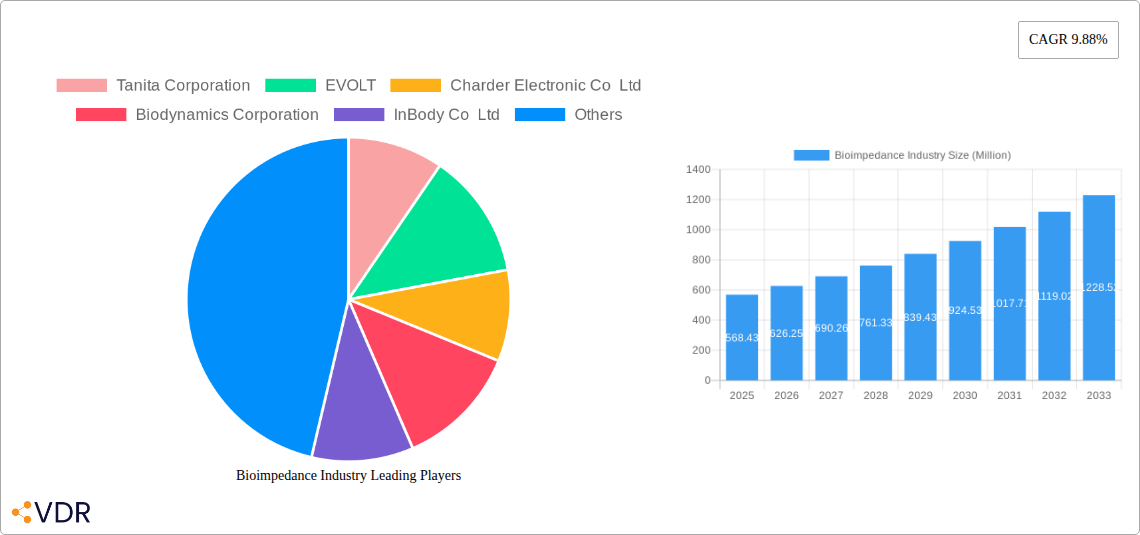
The global bioimpedance market, valued at $568.43 million in 2025, is projected to experience robust growth, driven by increasing prevalence of obesity and related health conditions, rising demand for point-of-care diagnostics, and technological advancements in bioimpedance devices. The market's Compound Annual Growth Rate (CAGR) of 9.88% from 2019 to 2024 suggests a significant expansion, expected to continue throughout the forecast period (2025-2033). Key market segments include wireless and wired modalities, catering to segmental and whole-body measurements with single, dual, and multiple-frequency devices. The increasing adoption of wireless devices, offering portability and convenience, is a significant trend. Furthermore, the integration of bioimpedance technology into consumer health devices and telehealth platforms fuels market growth. However, factors such as high initial investment costs for advanced devices and potential inaccuracies in measurement due to variations in hydration levels act as restraints. North America and Europe currently hold significant market share, attributed to advanced healthcare infrastructure and high adoption rates. However, the Asia-Pacific region is expected to witness substantial growth owing to rising healthcare expenditure and growing awareness of preventive healthcare. Leading companies like Tanita Corporation, InBody Co Ltd, and Omron Corporation are driving innovation and competition within the market. The consistent expansion in technological advancements and increasing adoption of sophisticated body composition analysis techniques will further enhance the market growth over the forecast period.
The competitive landscape is characterized by a mix of established players and emerging companies. Strategic partnerships, acquisitions, and the introduction of innovative products with enhanced features and user-friendly interfaces are common strategies employed by these companies to maintain their market share and expand their reach. Government initiatives promoting preventive healthcare and the increasing use of bioimpedance analysis in sports medicine and fitness centers are further boosting market growth. The rising demand for accurate and efficient body composition analysis is expected to fuel market expansion, especially in developing economies. Future growth will depend on factors such as technological innovation, regulatory approvals, and continued investment in research and development to improve accuracy and reliability.
Bioimpedance Industry Market Report: 2019-2033
This comprehensive report provides a detailed analysis of the Bioimpedance Industry, encompassing market dynamics, growth trends, regional segmentation, product landscape, key players, and future outlook. The study period covers 2019-2033, with 2025 as the base and estimated year. The report caters to industry professionals, investors, and researchers seeking insights into this rapidly evolving market. The total market size is estimated at xx Million in 2025 and is projected to reach xx Million by 2033.
Bioimpedance Industry Market Dynamics & Structure
The global bioimpedance market is characterized by moderate concentration, with several key players holding significant market share. Technological innovation, particularly in miniaturization and wireless capabilities, is a major driver. Regulatory frameworks, varying across regions, impact market access and product approvals. Competitive substitutes, such as DEXA scans, pose a challenge, but the affordability and convenience of bioimpedance technology maintain its strong market position. The end-user demographic is broad, ranging from individual consumers to healthcare professionals. M&A activity remains relatively modest, with xx deals recorded in the historical period (2019-2024), primarily focused on enhancing product portfolios and expanding geographical reach.
- Market Concentration: Moderately concentrated, with top 5 players holding approximately xx% market share in 2025.
- Technological Innovation: Miniaturization, improved accuracy, wireless connectivity, and integration with wearable devices are key drivers.
- Regulatory Landscape: Varying regulations across different geographies influence market entry and product approvals.
- Competitive Substitutes: DEXA scans and other body composition analysis methods pose competitive challenges.
- End-User Demographics: Individuals, healthcare professionals, fitness centers, and research institutions.
- M&A Activity: xx deals recorded between 2019 and 2024, primarily focused on expansion and portfolio diversification.
Bioimpedance Industry Growth Trends & Insights
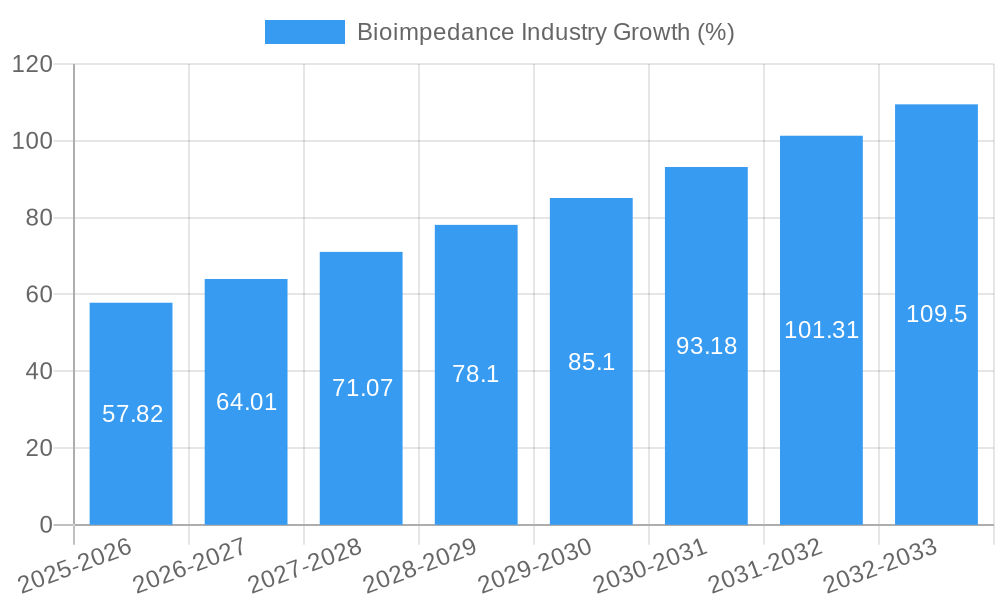
The bioimpedance market experienced significant growth during the historical period (2019-2024), driven by increasing health consciousness, rising obesity rates, and the growing adoption of wearable technology. The market size grew from xx Million in 2019 to xx Million in 2024, exhibiting a CAGR of xx%. This positive trend is expected to continue throughout the forecast period (2025-2033), with a projected CAGR of xx%, reaching xx Million by 2033. Technological advancements, such as the development of multi-frequency devices and improved algorithms, are enhancing accuracy and expanding applications. Consumer preferences are shifting towards user-friendly, wireless devices integrated with mobile applications.
Dominant Regions, Countries, or Segments in Bioimpedance Industry
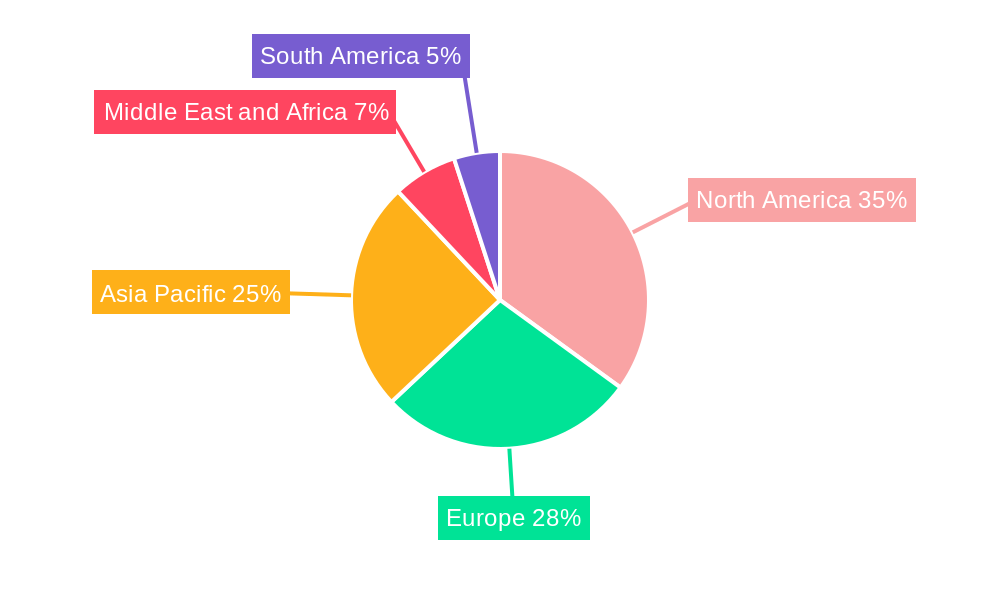
North America currently dominates the bioimpedance market, driven by high healthcare expenditure, technological advancements, and a high prevalence of obesity. Within this region, the United States holds the largest market share. The wireless modality segment shows the strongest growth, fueled by the increasing popularity of wearable devices and smartphones. The whole-body measurement application is experiencing wider adoption compared to segmental measurement due to its comprehensive nature and ease of use. Multi-frequency devices are gaining traction over single and dual-frequency counterparts because of their superior accuracy in body composition analysis.
- Key Drivers in North America: High healthcare spending, technological innovation, and high prevalence of obesity.
- Wireless Modality Growth: Driven by convenience and integration with wearable technology.
- Whole Body Measurement Dominance: Preferred for its comprehensive analysis capabilities.
- Multi-Frequency Product Type: Superior accuracy is driving increased adoption.
Bioimpedance Industry Product Landscape
The bioimpedance market offers a range of products, from basic single-frequency devices to advanced multi-frequency analyzers with sophisticated algorithms. Recent innovations focus on miniaturization, wireless connectivity, and seamless integration with mobile health apps. Unique selling propositions include enhanced accuracy, user-friendly interfaces, and expanded measurement parameters beyond basic body composition analysis. Technological advancements include the use of advanced signal processing techniques and the development of low-power, high-performance analog front-ends for wearable applications.
Key Drivers, Barriers & Challenges in Bioimpedance Industry
Key Drivers: Increasing health awareness, rising obesity rates, technological advancements (miniaturization, wireless connectivity), and integration with wearable devices drive market growth. Government initiatives promoting preventative healthcare and the rising adoption of telehealth also contribute significantly.
Challenges: Accuracy concerns compared to other methods (e.g., DEXA), regulatory hurdles in some regions, competition from substitute technologies, and supply chain disruptions impacting production costs pose significant barriers to market growth.
Emerging Opportunities in Bioimpedance Industry
Emerging opportunities lie in untapped markets (developing economies), innovative applications (e.g., monitoring hydration status, early detection of malnutrition), and the integration of bioimpedance technology with other health monitoring devices to provide comprehensive health assessments. Customization and personalization of bioimpedance analysis based on individual user profiles represent significant potential growth areas.
Growth Accelerators in the Bioimpedance Industry
Strategic partnerships between bioimpedance manufacturers and healthcare providers, coupled with continuous technological advancements resulting in higher accuracy and improved user experience, are key growth accelerators. Expansion into emerging markets and increased investment in research and development further fuel market expansion.
Key Players Shaping the Bioimpedance Industry Market
- Tanita Corporation
- EVOLT
- Charder Electronic Co Ltd
- Biodynamics Corporation
- InBody Co Ltd
- Fook Tin Group Holding Ltd
- Omron Corporation
- Bioparhom
- Lumsail Industrial Inc
- Biotekna
- Akern
- Bodystat Ltd
Notable Milestones in Bioimpedance Industry Sector
- September 2022: Xiaomi launched an eight-electrode body composition scale using dual-frequency bioimpedance technology, offering 35 body composition analysis reports. This signifies a move towards more sophisticated consumer-grade devices.
- March 2022: Analog Devices launched the MAX30009, a low-power analog front-end for wearable bioimpedance monitoring, enabling more accurate clinical-grade vital sign measurements in wearable devices.
In-Depth Bioimpedance Industry Market Outlook
The bioimpedance market exhibits significant growth potential, driven by continued technological innovation, expanding applications, and increasing health consciousness globally. Strategic partnerships, market expansion into emerging regions, and the development of innovative, user-friendly devices will be key to unlocking this potential and achieving sustainable long-term growth. The market is poised for further expansion as technology continues to improve accuracy and affordability, making bioimpedance analysis increasingly accessible to a wider range of consumers and healthcare professionals.
Bioimpedance Industry Segmentation
-
1. Product Type
- 1.1. Single-frequency
- 1.2. Dual-frequency
- 1.3. Multiple-frequency
-
2. Modality
- 2.1. Wireless
- 2.2. Wired
-
3. Application
- 3.1. Segmental Body Measurement
- 3.2. Whole Body Measurement
Bioimpedance Industry Segmentation By Geography
-
1. North America
- 1.1. United States
- 1.2. Canada
- 1.3. Mexico
-
2. Europe
- 2.1. Germany
- 2.2. United Kingdom
- 2.3. France
- 2.4. Italy
- 2.5. Spain
- 2.6. Rest of Europe
-
3. Asia Pacific
- 3.1. China
- 3.2. Japan
- 3.3. India
- 3.4. Australia
- 3.5. South Korea
- 3.6. Rest of Asia Pacific
-
4. Middle East and Africa
- 4.1. GCC
- 4.2. South Africa
- 4.3. Rest of Middle East and Africa
-
5. South America
- 5.1. Brazil
- 5.2. Argentina
- 5.3. Rest of South America
Bioimpedance Industry REPORT HIGHLIGHTS
| Aspects | Details |
|---|---|
| Study Period | 2019-2033 |
| Base Year | 2024 |
| Estimated Year | 2025 |
| Forecast Period | 2025-2033 |
| Historical Period | 2019-2024 |
| Growth Rate | CAGR of 9.88% from 2019-2033 |
| Segmentation |
|
Table of Contents
- 1. Introduction
- 1.1. Research Scope
- 1.2. Market Segmentation
- 1.3. Research Methodology
- 1.4. Definitions and Assumptions
- 2. Executive Summary
- 2.1. Introduction
- 3. Market Dynamics
- 3.1. Introduction
- 3.2. Market Drivers
- 3.2.1. Increasing Prevalence of Metabolic Disorders; Initiatives by Governments to Promote Healthy Lifestyles; Technological Advancements
- 3.3. Market Restrains
- 3.3.1. Inconsistency and Inaccuracy in Different Analyzers
- 3.4. Market Trends
- 3.4.1. Multi-frequency Bioimpedance Analysis Segment Expected to Witness the Highest Growth During the Forecast Period
- 4. Market Factor Analysis
- 4.1. Porters Five Forces
- 4.2. Supply/Value Chain
- 4.3. PESTEL analysis
- 4.4. Market Entropy
- 4.5. Patent/Trademark Analysis
- 5. Global Bioimpedance Industry Analysis, Insights and Forecast, 2019-2031
- 5.1. Market Analysis, Insights and Forecast - by Product Type
- 5.1.1. Single-frequency
- 5.1.2. Dual-frequency
- 5.1.3. Multiple-frequency
- 5.2. Market Analysis, Insights and Forecast - by Modality
- 5.2.1. Wireless
- 5.2.2. Wired
- 5.3. Market Analysis, Insights and Forecast - by Application
- 5.3.1. Segmental Body Measurement
- 5.3.2. Whole Body Measurement
- 5.4. Market Analysis, Insights and Forecast - by Region
- 5.4.1. North America
- 5.4.2. Europe
- 5.4.3. Asia Pacific
- 5.4.4. Middle East and Africa
- 5.4.5. South America
- 5.1. Market Analysis, Insights and Forecast - by Product Type
- 6. North America Bioimpedance Industry Analysis, Insights and Forecast, 2019-2031
- 6.1. Market Analysis, Insights and Forecast - by Product Type
- 6.1.1. Single-frequency
- 6.1.2. Dual-frequency
- 6.1.3. Multiple-frequency
- 6.2. Market Analysis, Insights and Forecast - by Modality
- 6.2.1. Wireless
- 6.2.2. Wired
- 6.3. Market Analysis, Insights and Forecast - by Application
- 6.3.1. Segmental Body Measurement
- 6.3.2. Whole Body Measurement
- 6.1. Market Analysis, Insights and Forecast - by Product Type
- 7. Europe Bioimpedance Industry Analysis, Insights and Forecast, 2019-2031
- 7.1. Market Analysis, Insights and Forecast - by Product Type
- 7.1.1. Single-frequency
- 7.1.2. Dual-frequency
- 7.1.3. Multiple-frequency
- 7.2. Market Analysis, Insights and Forecast - by Modality
- 7.2.1. Wireless
- 7.2.2. Wired
- 7.3. Market Analysis, Insights and Forecast - by Application
- 7.3.1. Segmental Body Measurement
- 7.3.2. Whole Body Measurement
- 7.1. Market Analysis, Insights and Forecast - by Product Type
- 8. Asia Pacific Bioimpedance Industry Analysis, Insights and Forecast, 2019-2031
- 8.1. Market Analysis, Insights and Forecast - by Product Type
- 8.1.1. Single-frequency
- 8.1.2. Dual-frequency
- 8.1.3. Multiple-frequency
- 8.2. Market Analysis, Insights and Forecast - by Modality
- 8.2.1. Wireless
- 8.2.2. Wired
- 8.3. Market Analysis, Insights and Forecast - by Application
- 8.3.1. Segmental Body Measurement
- 8.3.2. Whole Body Measurement
- 8.1. Market Analysis, Insights and Forecast - by Product Type
- 9. Middle East and Africa Bioimpedance Industry Analysis, Insights and Forecast, 2019-2031
- 9.1. Market Analysis, Insights and Forecast - by Product Type
- 9.1.1. Single-frequency
- 9.1.2. Dual-frequency
- 9.1.3. Multiple-frequency
- 9.2. Market Analysis, Insights and Forecast - by Modality
- 9.2.1. Wireless
- 9.2.2. Wired
- 9.3. Market Analysis, Insights and Forecast - by Application
- 9.3.1. Segmental Body Measurement
- 9.3.2. Whole Body Measurement
- 9.1. Market Analysis, Insights and Forecast - by Product Type
- 10. South America Bioimpedance Industry Analysis, Insights and Forecast, 2019-2031
- 10.1. Market Analysis, Insights and Forecast - by Product Type
- 10.1.1. Single-frequency
- 10.1.2. Dual-frequency
- 10.1.3. Multiple-frequency
- 10.2. Market Analysis, Insights and Forecast - by Modality
- 10.2.1. Wireless
- 10.2.2. Wired
- 10.3. Market Analysis, Insights and Forecast - by Application
- 10.3.1. Segmental Body Measurement
- 10.3.2. Whole Body Measurement
- 10.1. Market Analysis, Insights and Forecast - by Product Type
- 11. North America Bioimpedance Industry Analysis, Insights and Forecast, 2019-2031
- 11.1. Market Analysis, Insights and Forecast - By Country/Sub-region
- 11.1.1. undefined
- 12. Europe Bioimpedance Industry Analysis, Insights and Forecast, 2019-2031
- 12.1. Market Analysis, Insights and Forecast - By Country/Sub-region
- 12.1.1. undefined
- 13. Asia Pacific Bioimpedance Industry Analysis, Insights and Forecast, 2019-2031
- 13.1. Market Analysis, Insights and Forecast - By Country/Sub-region
- 13.1.1. undefined
- 14. Middle East and Africa Bioimpedance Industry Analysis, Insights and Forecast, 2019-2031
- 14.1. Market Analysis, Insights and Forecast - By Country/Sub-region
- 14.1.1. undefined
- 15. South America Bioimpedance Industry Analysis, Insights and Forecast, 2019-2031
- 15.1. Market Analysis, Insights and Forecast - By Country/Sub-region
- 15.1.1. undefined
- 16. Competitive Analysis
- 16.1. Global Market Share Analysis 2024
- 16.2. Company Profiles
- 16.2.1 Tanita Corporation
- 16.2.1.1. Overview
- 16.2.1.2. Products
- 16.2.1.3. SWOT Analysis
- 16.2.1.4. Recent Developments
- 16.2.1.5. Financials (Based on Availability)
- 16.2.2 EVOLT
- 16.2.2.1. Overview
- 16.2.2.2. Products
- 16.2.2.3. SWOT Analysis
- 16.2.2.4. Recent Developments
- 16.2.2.5. Financials (Based on Availability)
- 16.2.3 Charder Electronic Co Ltd
- 16.2.3.1. Overview
- 16.2.3.2. Products
- 16.2.3.3. SWOT Analysis
- 16.2.3.4. Recent Developments
- 16.2.3.5. Financials (Based on Availability)
- 16.2.4 Biodynamics Corporation
- 16.2.4.1. Overview
- 16.2.4.2. Products
- 16.2.4.3. SWOT Analysis
- 16.2.4.4. Recent Developments
- 16.2.4.5. Financials (Based on Availability)
- 16.2.5 InBody Co Ltd
- 16.2.5.1. Overview
- 16.2.5.2. Products
- 16.2.5.3. SWOT Analysis
- 16.2.5.4. Recent Developments
- 16.2.5.5. Financials (Based on Availability)
- 16.2.6 Fook Tin Group Holding Ltd
- 16.2.6.1. Overview
- 16.2.6.2. Products
- 16.2.6.3. SWOT Analysis
- 16.2.6.4. Recent Developments
- 16.2.6.5. Financials (Based on Availability)
- 16.2.7 Omron Corporation
- 16.2.7.1. Overview
- 16.2.7.2. Products
- 16.2.7.3. SWOT Analysis
- 16.2.7.4. Recent Developments
- 16.2.7.5. Financials (Based on Availability)
- 16.2.8 Bioparhom
- 16.2.8.1. Overview
- 16.2.8.2. Products
- 16.2.8.3. SWOT Analysis
- 16.2.8.4. Recent Developments
- 16.2.8.5. Financials (Based on Availability)
- 16.2.9 Lumsail Industrial Inc
- 16.2.9.1. Overview
- 16.2.9.2. Products
- 16.2.9.3. SWOT Analysis
- 16.2.9.4. Recent Developments
- 16.2.9.5. Financials (Based on Availability)
- 16.2.10 Biotekna
- 16.2.10.1. Overview
- 16.2.10.2. Products
- 16.2.10.3. SWOT Analysis
- 16.2.10.4. Recent Developments
- 16.2.10.5. Financials (Based on Availability)
- 16.2.11 Akern
- 16.2.11.1. Overview
- 16.2.11.2. Products
- 16.2.11.3. SWOT Analysis
- 16.2.11.4. Recent Developments
- 16.2.11.5. Financials (Based on Availability)
- 16.2.12 Bodystat Ltd
- 16.2.12.1. Overview
- 16.2.12.2. Products
- 16.2.12.3. SWOT Analysis
- 16.2.12.4. Recent Developments
- 16.2.12.5. Financials (Based on Availability)
- 16.2.1 Tanita Corporation
List of Figures
- Figure 1: Global Bioimpedance Industry Revenue Breakdown (Million, %) by Region 2024 & 2032
- Figure 2: Global Bioimpedance Industry Volume Breakdown (K Unit, %) by Region 2024 & 2032
- Figure 3: North America Bioimpedance Industry Revenue (Million), by Country 2024 & 2032
- Figure 4: North America Bioimpedance Industry Volume (K Unit), by Country 2024 & 2032
- Figure 5: North America Bioimpedance Industry Revenue Share (%), by Country 2024 & 2032
- Figure 6: North America Bioimpedance Industry Volume Share (%), by Country 2024 & 2032
- Figure 7: Europe Bioimpedance Industry Revenue (Million), by Country 2024 & 2032
- Figure 8: Europe Bioimpedance Industry Volume (K Unit), by Country 2024 & 2032
- Figure 9: Europe Bioimpedance Industry Revenue Share (%), by Country 2024 & 2032
- Figure 10: Europe Bioimpedance Industry Volume Share (%), by Country 2024 & 2032
- Figure 11: Asia Pacific Bioimpedance Industry Revenue (Million), by Country 2024 & 2032
- Figure 12: Asia Pacific Bioimpedance Industry Volume (K Unit), by Country 2024 & 2032
- Figure 13: Asia Pacific Bioimpedance Industry Revenue Share (%), by Country 2024 & 2032
- Figure 14: Asia Pacific Bioimpedance Industry Volume Share (%), by Country 2024 & 2032
- Figure 15: Middle East and Africa Bioimpedance Industry Revenue (Million), by Country 2024 & 2032
- Figure 16: Middle East and Africa Bioimpedance Industry Volume (K Unit), by Country 2024 & 2032
- Figure 17: Middle East and Africa Bioimpedance Industry Revenue Share (%), by Country 2024 & 2032
- Figure 18: Middle East and Africa Bioimpedance Industry Volume Share (%), by Country 2024 & 2032
- Figure 19: South America Bioimpedance Industry Revenue (Million), by Country 2024 & 2032
- Figure 20: South America Bioimpedance Industry Volume (K Unit), by Country 2024 & 2032
- Figure 21: South America Bioimpedance Industry Revenue Share (%), by Country 2024 & 2032
- Figure 22: South America Bioimpedance Industry Volume Share (%), by Country 2024 & 2032
- Figure 23: North America Bioimpedance Industry Revenue (Million), by Product Type 2024 & 2032
- Figure 24: North America Bioimpedance Industry Volume (K Unit), by Product Type 2024 & 2032
- Figure 25: North America Bioimpedance Industry Revenue Share (%), by Product Type 2024 & 2032
- Figure 26: North America Bioimpedance Industry Volume Share (%), by Product Type 2024 & 2032
- Figure 27: North America Bioimpedance Industry Revenue (Million), by Modality 2024 & 2032
- Figure 28: North America Bioimpedance Industry Volume (K Unit), by Modality 2024 & 2032
- Figure 29: North America Bioimpedance Industry Revenue Share (%), by Modality 2024 & 2032
- Figure 30: North America Bioimpedance Industry Volume Share (%), by Modality 2024 & 2032
- Figure 31: North America Bioimpedance Industry Revenue (Million), by Application 2024 & 2032
- Figure 32: North America Bioimpedance Industry Volume (K Unit), by Application 2024 & 2032
- Figure 33: North America Bioimpedance Industry Revenue Share (%), by Application 2024 & 2032
- Figure 34: North America Bioimpedance Industry Volume Share (%), by Application 2024 & 2032
- Figure 35: North America Bioimpedance Industry Revenue (Million), by Country 2024 & 2032
- Figure 36: North America Bioimpedance Industry Volume (K Unit), by Country 2024 & 2032
- Figure 37: North America Bioimpedance Industry Revenue Share (%), by Country 2024 & 2032
- Figure 38: North America Bioimpedance Industry Volume Share (%), by Country 2024 & 2032
- Figure 39: Europe Bioimpedance Industry Revenue (Million), by Product Type 2024 & 2032
- Figure 40: Europe Bioimpedance Industry Volume (K Unit), by Product Type 2024 & 2032
- Figure 41: Europe Bioimpedance Industry Revenue Share (%), by Product Type 2024 & 2032
- Figure 42: Europe Bioimpedance Industry Volume Share (%), by Product Type 2024 & 2032
- Figure 43: Europe Bioimpedance Industry Revenue (Million), by Modality 2024 & 2032
- Figure 44: Europe Bioimpedance Industry Volume (K Unit), by Modality 2024 & 2032
- Figure 45: Europe Bioimpedance Industry Revenue Share (%), by Modality 2024 & 2032
- Figure 46: Europe Bioimpedance Industry Volume Share (%), by Modality 2024 & 2032
- Figure 47: Europe Bioimpedance Industry Revenue (Million), by Application 2024 & 2032
- Figure 48: Europe Bioimpedance Industry Volume (K Unit), by Application 2024 & 2032
- Figure 49: Europe Bioimpedance Industry Revenue Share (%), by Application 2024 & 2032
- Figure 50: Europe Bioimpedance Industry Volume Share (%), by Application 2024 & 2032
- Figure 51: Europe Bioimpedance Industry Revenue (Million), by Country 2024 & 2032
- Figure 52: Europe Bioimpedance Industry Volume (K Unit), by Country 2024 & 2032
- Figure 53: Europe Bioimpedance Industry Revenue Share (%), by Country 2024 & 2032
- Figure 54: Europe Bioimpedance Industry Volume Share (%), by Country 2024 & 2032
- Figure 55: Asia Pacific Bioimpedance Industry Revenue (Million), by Product Type 2024 & 2032
- Figure 56: Asia Pacific Bioimpedance Industry Volume (K Unit), by Product Type 2024 & 2032
- Figure 57: Asia Pacific Bioimpedance Industry Revenue Share (%), by Product Type 2024 & 2032
- Figure 58: Asia Pacific Bioimpedance Industry Volume Share (%), by Product Type 2024 & 2032
- Figure 59: Asia Pacific Bioimpedance Industry Revenue (Million), by Modality 2024 & 2032
- Figure 60: Asia Pacific Bioimpedance Industry Volume (K Unit), by Modality 2024 & 2032
- Figure 61: Asia Pacific Bioimpedance Industry Revenue Share (%), by Modality 2024 & 2032
- Figure 62: Asia Pacific Bioimpedance Industry Volume Share (%), by Modality 2024 & 2032
- Figure 63: Asia Pacific Bioimpedance Industry Revenue (Million), by Application 2024 & 2032
- Figure 64: Asia Pacific Bioimpedance Industry Volume (K Unit), by Application 2024 & 2032
- Figure 65: Asia Pacific Bioimpedance Industry Revenue Share (%), by Application 2024 & 2032
- Figure 66: Asia Pacific Bioimpedance Industry Volume Share (%), by Application 2024 & 2032
- Figure 67: Asia Pacific Bioimpedance Industry Revenue (Million), by Country 2024 & 2032
- Figure 68: Asia Pacific Bioimpedance Industry Volume (K Unit), by Country 2024 & 2032
- Figure 69: Asia Pacific Bioimpedance Industry Revenue Share (%), by Country 2024 & 2032
- Figure 70: Asia Pacific Bioimpedance Industry Volume Share (%), by Country 2024 & 2032
- Figure 71: Middle East and Africa Bioimpedance Industry Revenue (Million), by Product Type 2024 & 2032
- Figure 72: Middle East and Africa Bioimpedance Industry Volume (K Unit), by Product Type 2024 & 2032
- Figure 73: Middle East and Africa Bioimpedance Industry Revenue Share (%), by Product Type 2024 & 2032
- Figure 74: Middle East and Africa Bioimpedance Industry Volume Share (%), by Product Type 2024 & 2032
- Figure 75: Middle East and Africa Bioimpedance Industry Revenue (Million), by Modality 2024 & 2032
- Figure 76: Middle East and Africa Bioimpedance Industry Volume (K Unit), by Modality 2024 & 2032
- Figure 77: Middle East and Africa Bioimpedance Industry Revenue Share (%), by Modality 2024 & 2032
- Figure 78: Middle East and Africa Bioimpedance Industry Volume Share (%), by Modality 2024 & 2032
- Figure 79: Middle East and Africa Bioimpedance Industry Revenue (Million), by Application 2024 & 2032
- Figure 80: Middle East and Africa Bioimpedance Industry Volume (K Unit), by Application 2024 & 2032
- Figure 81: Middle East and Africa Bioimpedance Industry Revenue Share (%), by Application 2024 & 2032
- Figure 82: Middle East and Africa Bioimpedance Industry Volume Share (%), by Application 2024 & 2032
- Figure 83: Middle East and Africa Bioimpedance Industry Revenue (Million), by Country 2024 & 2032
- Figure 84: Middle East and Africa Bioimpedance Industry Volume (K Unit), by Country 2024 & 2032
- Figure 85: Middle East and Africa Bioimpedance Industry Revenue Share (%), by Country 2024 & 2032
- Figure 86: Middle East and Africa Bioimpedance Industry Volume Share (%), by Country 2024 & 2032
- Figure 87: South America Bioimpedance Industry Revenue (Million), by Product Type 2024 & 2032
- Figure 88: South America Bioimpedance Industry Volume (K Unit), by Product Type 2024 & 2032
- Figure 89: South America Bioimpedance Industry Revenue Share (%), by Product Type 2024 & 2032
- Figure 90: South America Bioimpedance Industry Volume Share (%), by Product Type 2024 & 2032
- Figure 91: South America Bioimpedance Industry Revenue (Million), by Modality 2024 & 2032
- Figure 92: South America Bioimpedance Industry Volume (K Unit), by Modality 2024 & 2032
- Figure 93: South America Bioimpedance Industry Revenue Share (%), by Modality 2024 & 2032
- Figure 94: South America Bioimpedance Industry Volume Share (%), by Modality 2024 & 2032
- Figure 95: South America Bioimpedance Industry Revenue (Million), by Application 2024 & 2032
- Figure 96: South America Bioimpedance Industry Volume (K Unit), by Application 2024 & 2032
- Figure 97: South America Bioimpedance Industry Revenue Share (%), by Application 2024 & 2032
- Figure 98: South America Bioimpedance Industry Volume Share (%), by Application 2024 & 2032
- Figure 99: South America Bioimpedance Industry Revenue (Million), by Country 2024 & 2032
- Figure 100: South America Bioimpedance Industry Volume (K Unit), by Country 2024 & 2032
- Figure 101: South America Bioimpedance Industry Revenue Share (%), by Country 2024 & 2032
- Figure 102: South America Bioimpedance Industry Volume Share (%), by Country 2024 & 2032
List of Tables
- Table 1: Global Bioimpedance Industry Revenue Million Forecast, by Region 2019 & 2032
- Table 2: Global Bioimpedance Industry Volume K Unit Forecast, by Region 2019 & 2032
- Table 3: Global Bioimpedance Industry Revenue Million Forecast, by Product Type 2019 & 2032
- Table 4: Global Bioimpedance Industry Volume K Unit Forecast, by Product Type 2019 & 2032
- Table 5: Global Bioimpedance Industry Revenue Million Forecast, by Modality 2019 & 2032
- Table 6: Global Bioimpedance Industry Volume K Unit Forecast, by Modality 2019 & 2032
- Table 7: Global Bioimpedance Industry Revenue Million Forecast, by Application 2019 & 2032
- Table 8: Global Bioimpedance Industry Volume K Unit Forecast, by Application 2019 & 2032
- Table 9: Global Bioimpedance Industry Revenue Million Forecast, by Region 2019 & 2032
- Table 10: Global Bioimpedance Industry Volume K Unit Forecast, by Region 2019 & 2032
- Table 11: Global Bioimpedance Industry Revenue Million Forecast, by Country 2019 & 2032
- Table 12: Global Bioimpedance Industry Volume K Unit Forecast, by Country 2019 & 2032
- Table 13: Global Bioimpedance Industry Revenue Million Forecast, by Country 2019 & 2032
- Table 14: Global Bioimpedance Industry Volume K Unit Forecast, by Country 2019 & 2032
- Table 15: Global Bioimpedance Industry Revenue Million Forecast, by Country 2019 & 2032
- Table 16: Global Bioimpedance Industry Volume K Unit Forecast, by Country 2019 & 2032
- Table 17: Global Bioimpedance Industry Revenue Million Forecast, by Country 2019 & 2032
- Table 18: Global Bioimpedance Industry Volume K Unit Forecast, by Country 2019 & 2032
- Table 19: Global Bioimpedance Industry Revenue Million Forecast, by Country 2019 & 2032
- Table 20: Global Bioimpedance Industry Volume K Unit Forecast, by Country 2019 & 2032
- Table 21: Global Bioimpedance Industry Revenue Million Forecast, by Product Type 2019 & 2032
- Table 22: Global Bioimpedance Industry Volume K Unit Forecast, by Product Type 2019 & 2032
- Table 23: Global Bioimpedance Industry Revenue Million Forecast, by Modality 2019 & 2032
- Table 24: Global Bioimpedance Industry Volume K Unit Forecast, by Modality 2019 & 2032
- Table 25: Global Bioimpedance Industry Revenue Million Forecast, by Application 2019 & 2032
- Table 26: Global Bioimpedance Industry Volume K Unit Forecast, by Application 2019 & 2032
- Table 27: Global Bioimpedance Industry Revenue Million Forecast, by Country 2019 & 2032
- Table 28: Global Bioimpedance Industry Volume K Unit Forecast, by Country 2019 & 2032
- Table 29: United States Bioimpedance Industry Revenue (Million) Forecast, by Application 2019 & 2032
- Table 30: United States Bioimpedance Industry Volume (K Unit) Forecast, by Application 2019 & 2032
- Table 31: Canada Bioimpedance Industry Revenue (Million) Forecast, by Application 2019 & 2032
- Table 32: Canada Bioimpedance Industry Volume (K Unit) Forecast, by Application 2019 & 2032
- Table 33: Mexico Bioimpedance Industry Revenue (Million) Forecast, by Application 2019 & 2032
- Table 34: Mexico Bioimpedance Industry Volume (K Unit) Forecast, by Application 2019 & 2032
- Table 35: Global Bioimpedance Industry Revenue Million Forecast, by Product Type 2019 & 2032
- Table 36: Global Bioimpedance Industry Volume K Unit Forecast, by Product Type 2019 & 2032
- Table 37: Global Bioimpedance Industry Revenue Million Forecast, by Modality 2019 & 2032
- Table 38: Global Bioimpedance Industry Volume K Unit Forecast, by Modality 2019 & 2032
- Table 39: Global Bioimpedance Industry Revenue Million Forecast, by Application 2019 & 2032
- Table 40: Global Bioimpedance Industry Volume K Unit Forecast, by Application 2019 & 2032
- Table 41: Global Bioimpedance Industry Revenue Million Forecast, by Country 2019 & 2032
- Table 42: Global Bioimpedance Industry Volume K Unit Forecast, by Country 2019 & 2032
- Table 43: Germany Bioimpedance Industry Revenue (Million) Forecast, by Application 2019 & 2032
- Table 44: Germany Bioimpedance Industry Volume (K Unit) Forecast, by Application 2019 & 2032
- Table 45: United Kingdom Bioimpedance Industry Revenue (Million) Forecast, by Application 2019 & 2032
- Table 46: United Kingdom Bioimpedance Industry Volume (K Unit) Forecast, by Application 2019 & 2032
- Table 47: France Bioimpedance Industry Revenue (Million) Forecast, by Application 2019 & 2032
- Table 48: France Bioimpedance Industry Volume (K Unit) Forecast, by Application 2019 & 2032
- Table 49: Italy Bioimpedance Industry Revenue (Million) Forecast, by Application 2019 & 2032
- Table 50: Italy Bioimpedance Industry Volume (K Unit) Forecast, by Application 2019 & 2032
- Table 51: Spain Bioimpedance Industry Revenue (Million) Forecast, by Application 2019 & 2032
- Table 52: Spain Bioimpedance Industry Volume (K Unit) Forecast, by Application 2019 & 2032
- Table 53: Rest of Europe Bioimpedance Industry Revenue (Million) Forecast, by Application 2019 & 2032
- Table 54: Rest of Europe Bioimpedance Industry Volume (K Unit) Forecast, by Application 2019 & 2032
- Table 55: Global Bioimpedance Industry Revenue Million Forecast, by Product Type 2019 & 2032
- Table 56: Global Bioimpedance Industry Volume K Unit Forecast, by Product Type 2019 & 2032
- Table 57: Global Bioimpedance Industry Revenue Million Forecast, by Modality 2019 & 2032
- Table 58: Global Bioimpedance Industry Volume K Unit Forecast, by Modality 2019 & 2032
- Table 59: Global Bioimpedance Industry Revenue Million Forecast, by Application 2019 & 2032
- Table 60: Global Bioimpedance Industry Volume K Unit Forecast, by Application 2019 & 2032
- Table 61: Global Bioimpedance Industry Revenue Million Forecast, by Country 2019 & 2032
- Table 62: Global Bioimpedance Industry Volume K Unit Forecast, by Country 2019 & 2032
- Table 63: China Bioimpedance Industry Revenue (Million) Forecast, by Application 2019 & 2032
- Table 64: China Bioimpedance Industry Volume (K Unit) Forecast, by Application 2019 & 2032
- Table 65: Japan Bioimpedance Industry Revenue (Million) Forecast, by Application 2019 & 2032
- Table 66: Japan Bioimpedance Industry Volume (K Unit) Forecast, by Application 2019 & 2032
- Table 67: India Bioimpedance Industry Revenue (Million) Forecast, by Application 2019 & 2032
- Table 68: India Bioimpedance Industry Volume (K Unit) Forecast, by Application 2019 & 2032
- Table 69: Australia Bioimpedance Industry Revenue (Million) Forecast, by Application 2019 & 2032
- Table 70: Australia Bioimpedance Industry Volume (K Unit) Forecast, by Application 2019 & 2032
- Table 71: South Korea Bioimpedance Industry Revenue (Million) Forecast, by Application 2019 & 2032
- Table 72: South Korea Bioimpedance Industry Volume (K Unit) Forecast, by Application 2019 & 2032
- Table 73: Rest of Asia Pacific Bioimpedance Industry Revenue (Million) Forecast, by Application 2019 & 2032
- Table 74: Rest of Asia Pacific Bioimpedance Industry Volume (K Unit) Forecast, by Application 2019 & 2032
- Table 75: Global Bioimpedance Industry Revenue Million Forecast, by Product Type 2019 & 2032
- Table 76: Global Bioimpedance Industry Volume K Unit Forecast, by Product Type 2019 & 2032
- Table 77: Global Bioimpedance Industry Revenue Million Forecast, by Modality 2019 & 2032
- Table 78: Global Bioimpedance Industry Volume K Unit Forecast, by Modality 2019 & 2032
- Table 79: Global Bioimpedance Industry Revenue Million Forecast, by Application 2019 & 2032
- Table 80: Global Bioimpedance Industry Volume K Unit Forecast, by Application 2019 & 2032
- Table 81: Global Bioimpedance Industry Revenue Million Forecast, by Country 2019 & 2032
- Table 82: Global Bioimpedance Industry Volume K Unit Forecast, by Country 2019 & 2032
- Table 83: GCC Bioimpedance Industry Revenue (Million) Forecast, by Application 2019 & 2032
- Table 84: GCC Bioimpedance Industry Volume (K Unit) Forecast, by Application 2019 & 2032
- Table 85: South Africa Bioimpedance Industry Revenue (Million) Forecast, by Application 2019 & 2032
- Table 86: South Africa Bioimpedance Industry Volume (K Unit) Forecast, by Application 2019 & 2032
- Table 87: Rest of Middle East and Africa Bioimpedance Industry Revenue (Million) Forecast, by Application 2019 & 2032
- Table 88: Rest of Middle East and Africa Bioimpedance Industry Volume (K Unit) Forecast, by Application 2019 & 2032
- Table 89: Global Bioimpedance Industry Revenue Million Forecast, by Product Type 2019 & 2032
- Table 90: Global Bioimpedance Industry Volume K Unit Forecast, by Product Type 2019 & 2032
- Table 91: Global Bioimpedance Industry Revenue Million Forecast, by Modality 2019 & 2032
- Table 92: Global Bioimpedance Industry Volume K Unit Forecast, by Modality 2019 & 2032
- Table 93: Global Bioimpedance Industry Revenue Million Forecast, by Application 2019 & 2032
- Table 94: Global Bioimpedance Industry Volume K Unit Forecast, by Application 2019 & 2032
- Table 95: Global Bioimpedance Industry Revenue Million Forecast, by Country 2019 & 2032
- Table 96: Global Bioimpedance Industry Volume K Unit Forecast, by Country 2019 & 2032
- Table 97: Brazil Bioimpedance Industry Revenue (Million) Forecast, by Application 2019 & 2032
- Table 98: Brazil Bioimpedance Industry Volume (K Unit) Forecast, by Application 2019 & 2032
- Table 99: Argentina Bioimpedance Industry Revenue (Million) Forecast, by Application 2019 & 2032
- Table 100: Argentina Bioimpedance Industry Volume (K Unit) Forecast, by Application 2019 & 2032
- Table 101: Rest of South America Bioimpedance Industry Revenue (Million) Forecast, by Application 2019 & 2032
- Table 102: Rest of South America Bioimpedance Industry Volume (K Unit) Forecast, by Application 2019 & 2032
Frequently Asked Questions
1. What is the projected Compound Annual Growth Rate (CAGR) of the Bioimpedance Industry?
The projected CAGR is approximately 9.88%.
2. Which companies are prominent players in the Bioimpedance Industry?
Key companies in the market include Tanita Corporation, EVOLT, Charder Electronic Co Ltd, Biodynamics Corporation, InBody Co Ltd, Fook Tin Group Holding Ltd, Omron Corporation, Bioparhom, Lumsail Industrial Inc , Biotekna, Akern, Bodystat Ltd.
3. What are the main segments of the Bioimpedance Industry?
The market segments include Product Type, Modality, Application.
4. Can you provide details about the market size?
The market size is estimated to be USD 568.43 Million as of 2022.
5. What are some drivers contributing to market growth?
Increasing Prevalence of Metabolic Disorders; Initiatives by Governments to Promote Healthy Lifestyles; Technological Advancements.
6. What are the notable trends driving market growth?
Multi-frequency Bioimpedance Analysis Segment Expected to Witness the Highest Growth During the Forecast Period.
7. Are there any restraints impacting market growth?
Inconsistency and Inaccuracy in Different Analyzers.
8. Can you provide examples of recent developments in the market?
September 2022: Xiaomi launched an eight-electrode body composition scale that provides up to 35 body composition analysis reports. This body fat scale adopts a dual-frequency bioimpedance measurement technology to provide accurate measurements.
9. What pricing options are available for accessing the report?
Pricing options include single-user, multi-user, and enterprise licenses priced at USD 4750, USD 5250, and USD 8750 respectively.
10. Is the market size provided in terms of value or volume?
The market size is provided in terms of value, measured in Million and volume, measured in K Unit.
11. Are there any specific market keywords associated with the report?
Yes, the market keyword associated with the report is "Bioimpedance Industry," which aids in identifying and referencing the specific market segment covered.
12. How do I determine which pricing option suits my needs best?
The pricing options vary based on user requirements and access needs. Individual users may opt for single-user licenses, while businesses requiring broader access may choose multi-user or enterprise licenses for cost-effective access to the report.
13. Are there any additional resources or data provided in the Bioimpedance Industry report?
While the report offers comprehensive insights, it's advisable to review the specific contents or supplementary materials provided to ascertain if additional resources or data are available.
14. How can I stay updated on further developments or reports in the Bioimpedance Industry?
To stay informed about further developments, trends, and reports in the Bioimpedance Industry, consider subscribing to industry newsletters, following relevant companies and organizations, or regularly checking reputable industry news sources and publications.
Methodology
Step 1 - Identification of Relevant Samples Size from Population Database


Step 2 - Approaches for Defining Global Market Size (Value, Volume* & Price*)

Note*: In applicable scenarios
Step 3 - Data Sources
Primary Research
- Web Analytics
- Survey Reports
- Research Institute
- Latest Research Reports
- Opinion Leaders
Secondary Research
- Annual Reports
- White Paper
- Latest Press Release
- Industry Association
- Paid Database
- Investor Presentations

Step 4 - Data Triangulation
Involves using different sources of information in order to increase the validity of a study
These sources are likely to be stakeholders in a program - participants, other researchers, program staff, other community members, and so on.
Then we put all data in single framework & apply various statistical tools to find out the dynamic on the market.
During the analysis stage, feedback from the stakeholder groups would be compared to determine areas of agreement as well as areas of divergence


