

Key Insights
The global Healthcare Quality Management market is projected for significant expansion, with an estimated market size of $1.42 billion by 2025, growing at a CAGR of 12.1% from 2025 to 2033. This robust growth is underpinned by a heightened focus on patient safety and enhanced healthcare outcomes, compelling providers to implement advanced quality management systems. The proliferation of Electronic Health Records (EHRs) and the increasing volume of healthcare data create avenues for data-informed quality enhancement. Moreover, regulatory mandates and value-based care incentives are driving the adoption of these solutions to optimize efficiency and control costs. The market is segmented by software type (Business Intelligence and Analytics, Physician Quality Reporting, Clinical Risk Management, Provider Performance Improvement), deployment mode (cloud-based, on-premise), application (data management, risk management), and end-user (hospitals, ambulatory care centers). Cloud-based solutions are witnessing increased adoption due to their scalability, accessibility, and cost-efficiency.
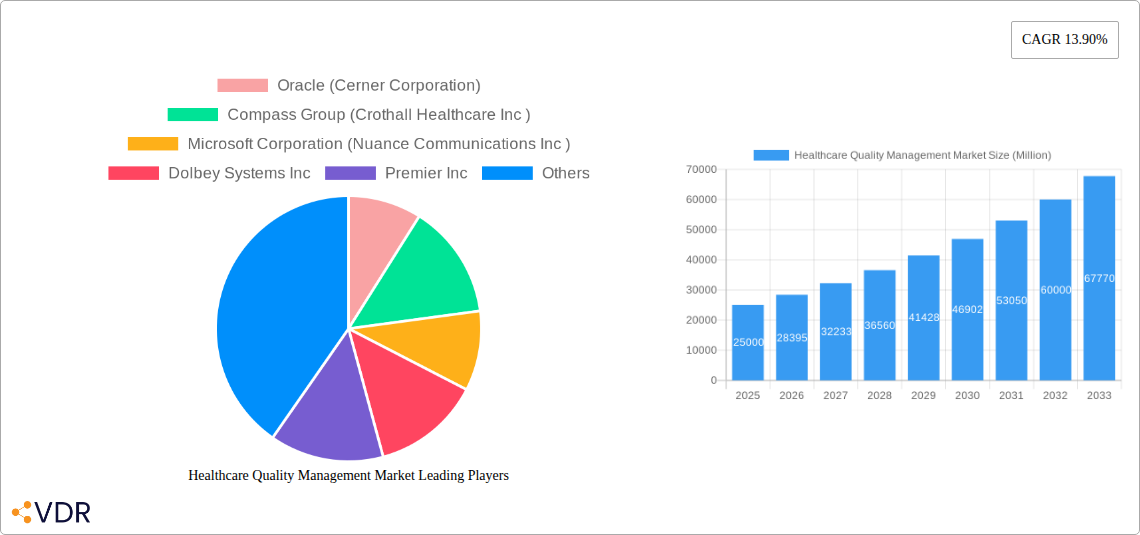
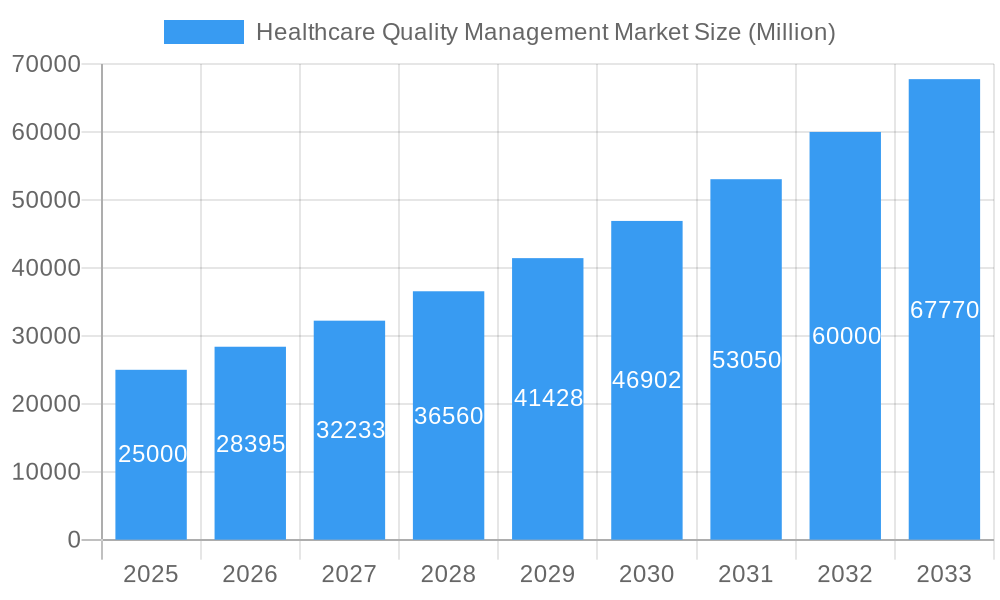
Healthcare Quality Management Market Market Size (In Billion)
The competitive arena features established enterprises such as Oracle (Cerner), Microsoft (Nuance), and McKesson, alongside specialized niche players. North America currently leads market share, followed by Europe and Asia Pacific. However, emerging Asia Pacific economies are anticipated to demonstrate substantial growth, propelled by escalating healthcare expenditure and technological advancements. Despite challenges including high implementation costs and data security concerns, the market's trajectory indicates sustained expansion driven by the demand for superior healthcare quality and efficiency. Innovations in artificial intelligence and machine learning are poised to further elevate the capabilities of healthcare quality management solutions, fostering future market growth.
Healthcare Quality Management Market Company Market Share
Healthcare Quality Management Market Report: 2019-2033
This comprehensive report provides a detailed analysis of the Healthcare Quality Management market, encompassing its dynamics, growth trends, regional segmentation, product landscape, key players, and future outlook. The study period covers 2019-2033, with 2025 as the base and estimated year. The report segments the market by software type, mode of delivery, application, and end-user, providing granular insights for strategic decision-making. This analysis is invaluable for healthcare providers, technology vendors, investors, and market researchers seeking to understand and capitalize on the evolving landscape of healthcare quality management. The market value is projected to reach xx Million by 2033.
Healthcare Quality Management Market Dynamics & Structure
The Healthcare Quality Management market is characterized by moderate concentration, with key players like Oracle (Cerner Corporation), Cerner, Compass Group (Crothall Healthcare Inc), Compass Group, Microsoft Corporation (Nuance Communications Inc), Dolbey Systems Inc, Premier Inc, RLDatix, Medisolv Inc, Change Healthcare, McKesson Corporation, CitiusTech Inc, and IBM competing for market share. Technological innovation, particularly in AI and data analytics, is a major driver, while regulatory frameworks like HIPAA influence market practices. The market faces competition from substitute solutions, but the increasing emphasis on improving healthcare quality and reducing costs fuels market growth. Mergers and acquisitions (M&A) activity, such as the IBM Watson Health asset sale in 2022, significantly reshape the competitive landscape.
- Market Concentration: Moderately concentrated, with top 5 players holding approximately xx% market share in 2025.
- Technological Innovation: AI-powered solutions, big data analytics, and cloud-based platforms are key drivers.
- Regulatory Landscape: HIPAA compliance and other regulations significantly impact market strategies.
- M&A Activity: Significant M&A activity, with xx deals recorded between 2019 and 2024, reshaping the competitive landscape. Deal value totaled approximately xx Million.
- End-User Demographics: Growth driven by increasing adoption across hospitals, ambulatory care centers, and other end-users.
Healthcare Quality Management Market Growth Trends & Insights
The Healthcare Quality Management market exhibits robust growth, driven by escalating healthcare costs, increasing demand for improved patient outcomes, and stringent regulatory requirements. The market size expanded from xx Million in 2019 to xx Million in 2024, demonstrating a CAGR of xx%. This growth is further fueled by the rising adoption of cloud-based solutions, the increasing integration of AI and machine learning in quality management systems, and the growing awareness of the importance of data-driven decision-making in healthcare. Market penetration is expected to reach xx% by 2033. Consumer behavior shifts toward personalized and proactive care further contribute to market growth. Technological disruptions, such as the integration of AI-powered solutions into EHR systems, are revolutionizing healthcare quality management. The market is poised for significant expansion in the forecast period (2025-2033), fueled by the factors mentioned above.
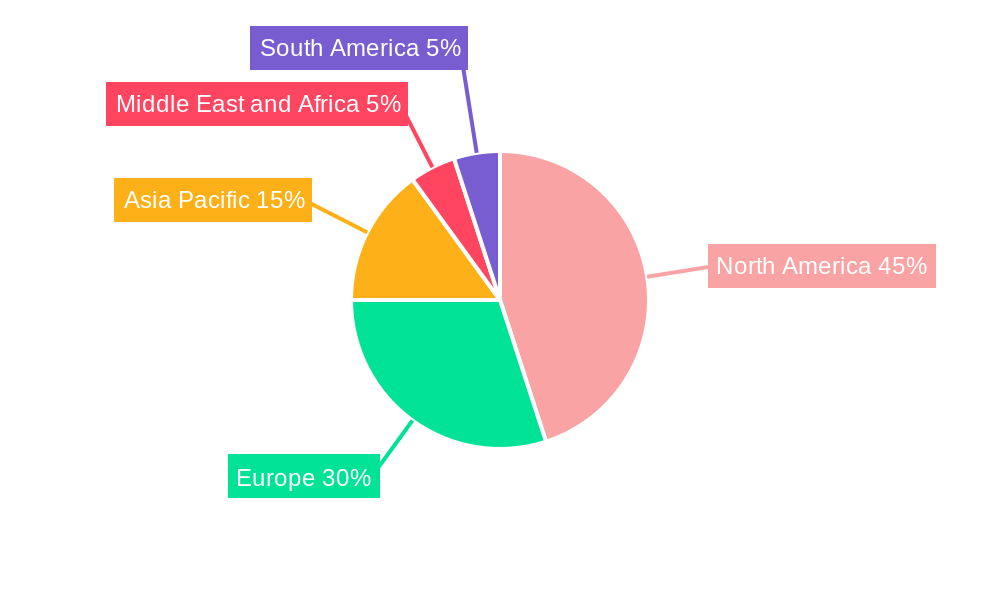
Dominant Regions, Countries, or Segments in Healthcare Quality Management Market
North America currently dominates the Healthcare Quality Management market, followed by Europe and Asia-Pacific. Within software types, Business Intelligence and Analytics Solutions hold the largest market share, driven by the increasing demand for data-driven insights to improve healthcare efficiency and quality. Cloud-based solutions are also gaining traction, outpacing on-premise solutions due to their scalability and cost-effectiveness. Hospitals remain the largest end-user segment, followed by ambulatory care centers.
- Leading Region: North America (holding approximately xx% market share in 2025)
- Key Drivers (North America): Robust healthcare infrastructure, high technological adoption rates, favorable regulatory environment.
- Key Drivers (Europe): Increasing government investments in healthcare IT, growing emphasis on patient safety and quality.
- Key Drivers (Asia-Pacific): Rising healthcare expenditure, improving healthcare infrastructure, increasing adoption of advanced technologies.
- Dominant Segment (Software Type): Business Intelligence and Analytics Solutions (holding xx% market share in 2025).
- Dominant Segment (Mode of Delivery): Cloud-based solutions are experiencing faster growth.
- Dominant Segment (End-User): Hospitals.
Healthcare Quality Management Market Product Landscape
The Healthcare Quality Management market offers a diverse range of software and services, encompassing business intelligence, clinical risk management, physician quality reporting, and provider performance improvement solutions. Recent innovations include AI-powered analytics platforms that offer predictive capabilities and improved decision-support tools. Key features include real-time data visualization, automated reporting, and seamless integration with EHR systems. These solutions enhance efficiency, reduce costs, and contribute to improved patient outcomes.
Key Drivers, Barriers & Challenges in Healthcare Quality Management Market
Key Drivers:
- Increasing emphasis on value-based care and accountable care organizations.
- Rising adoption of electronic health records (EHRs) and interoperability standards.
- Growing demand for data-driven insights to enhance clinical decision-making.
Key Barriers and Challenges:
- High implementation and maintenance costs of quality management systems.
- Data security and privacy concerns related to the handling of sensitive patient information.
- Integration challenges with legacy systems. This factor affects approximately xx% of healthcare institutions.
Emerging Opportunities in Healthcare Quality Management Market
Significant opportunities exist in developing AI-powered predictive analytics solutions that can identify patients at high risk of adverse events, personalized medicine initiatives, and expanding into untapped markets in developing countries. The increasing focus on population health management also presents substantial growth potential.
Growth Accelerators in the Healthcare Quality Management Market Industry
Strategic partnerships between technology vendors and healthcare providers are accelerating market growth. Technological advancements, such as the increasing sophistication of AI algorithms and the development of cloud-based platforms, are creating new opportunities for innovation. Market expansion strategies, such as entering new geographical regions or targeting specific healthcare specialties, are also contributing to growth.
Key Players Shaping the Healthcare Quality Management Market Market
- Oracle (Cerner Corporation)
- Compass Group (Crothall Healthcare Inc)
- Microsoft Corporation (Nuance Communications Inc)
- Dolbey Systems Inc
- Premier Inc
- RLDatix
- Medisolv Inc
- Change Healthcare
- McKesson Corporation
- CitiusTech Inc
- IBM
Notable Milestones in Healthcare Quality Management Market Sector
- March 2023: Nuance's DAX integrated into Cerner's EHR platform, enhancing administrative efficiency through conversational AI.
- January 2022: Francisco Partners acquires IBM's Watson Health data and analytics assets, significantly impacting the market's competitive landscape.
In-Depth Healthcare Quality Management Market Outlook
The Healthcare Quality Management market is poised for sustained growth, driven by increasing adoption of advanced technologies and a growing emphasis on improving healthcare quality and efficiency. Strategic partnerships, technological breakthroughs, and expansion into new markets present significant opportunities for growth. The market is expected to exhibit a strong CAGR of xx% over the forecast period (2025-2033), reaching a value of xx Million by 2033.
Healthcare Quality Management Market Segmentation
-
1. Software Type
- 1.1. Business Intelligence and Analytics Solutions
- 1.2. Physician Quality Reporting Solutions
- 1.3. Clinical Risk Management Solutions
- 1.4. Provider Performance Improvement Solutions
-
2. Mode of Delivery
- 2.1. Cloud-based Solutions
- 2.2. On-premise Solutions
-
3. Application
- 3.1. Data Management
- 3.2. Risk Management
-
4. End User
- 4.1. Hospitals
- 4.2. Ambulatory Care Centers
- 4.3. Other End Users
Healthcare Quality Management Market Segmentation By Geography
-
1. North America
- 1.1. United States
- 1.2. Canada
- 1.3. Mexico
-
2. Europe
- 2.1. Germany
- 2.2. United Kingdom
- 2.3. France
- 2.4. Italy
- 2.5. Spain
- 2.6. Rest of Europe
-
3. Asia Pacific
- 3.1. China
- 3.2. Japan
- 3.3. India
- 3.4. Australia
- 3.5. South Korea
- 3.6. Rest of Asia Pacific
-
4. Middle East and Africa
- 4.1. GCC
- 4.2. South Africa
- 4.3. Rest of Middle East
-
5. South America
- 5.1. Brazil
- 5.2. Argentina
- 5.3. Rest of South America
Healthcare Quality Management Market Regional Market Share
Geographic Coverage of Healthcare Quality Management Market
Healthcare Quality Management Market REPORT HIGHLIGHTS
| Aspects | Details |
|---|---|
| Study Period | 2020-2034 |
| Base Year | 2025 |
| Estimated Year | 2026 |
| Forecast Period | 2026-2034 |
| Historical Period | 2020-2025 |
| Growth Rate | CAGR of 12.1% from 2020-2034 |
| Segmentation |
|
Table of Contents
- 1. Introduction
- 1.1. Research Scope
- 1.2. Market Segmentation
- 1.3. Research Objective
- 1.4. Definitions and Assumptions
- 2. Executive Summary
- 2.1. Market Snapshot
- 3. Market Dynamics
- 3.1. Market Drivers
- 3.2. Market Restrains
- 3.3. Market Trends
- 3.4. Market Opportunities
- 4. Market Factor Analysis
- 4.1. Porters Five Forces
- 4.1.1. Bargaining Power of Suppliers
- 4.1.2. Bargaining Power of Buyers
- 4.1.3. Threat of New Entrants
- 4.1.4. Threat of Substitutes
- 4.1.5. Competitive Rivalry
- 4.2. PESTEL analysis
- 4.3. BCG Analysis
- 4.3.1. Stars (High Growth, High Market Share)
- 4.3.2. Cash Cows (Low Growth, High Market Share)
- 4.3.3. Question Mark (High Growth, Low Market Share)
- 4.3.4. Dogs (Low Growth, Low Market Share)
- 4.4. Ansoff Matrix Analysis
- 4.5. Supply Chain Analysis
- 4.6. Regulatory Landscape
- 4.7. Current Market Potential and Opportunity Assessment (TAM–SAM–SOM Framework)
- 4.8. VDR Analyst Note
- 4.1. Porters Five Forces
- 5. Market Analysis, Insights and Forecast 2021-2033
- 5.1. Market Analysis, Insights and Forecast - by Software Type
- 5.1.1. Business Intelligence and Analytics Solutions
- 5.1.2. Physician Quality Reporting Solutions
- 5.1.3. Clinical Risk Management Solutions
- 5.1.4. Provider Performance Improvement Solutions
- 5.2. Market Analysis, Insights and Forecast - by Mode of Delivery
- 5.2.1. Cloud-based Solutions
- 5.2.2. On-premise Solutions
- 5.3. Market Analysis, Insights and Forecast - by Application
- 5.3.1. Data Management
- 5.3.2. Risk Management
- 5.4. Market Analysis, Insights and Forecast - by End User
- 5.4.1. Hospitals
- 5.4.2. Ambulatory Care Centers
- 5.4.3. Other End Users
- 5.5. Market Analysis, Insights and Forecast - by Region
- 5.5.1. North America
- 5.5.2. Europe
- 5.5.3. Asia Pacific
- 5.5.4. Middle East and Africa
- 5.5.5. South America
- 5.1. Market Analysis, Insights and Forecast - by Software Type
- 6. Global Healthcare Quality Management Market Analysis, Insights and Forecast, 2021-2033
- 6.1. Market Analysis, Insights and Forecast - by Software Type
- 6.1.1. Business Intelligence and Analytics Solutions
- 6.1.2. Physician Quality Reporting Solutions
- 6.1.3. Clinical Risk Management Solutions
- 6.1.4. Provider Performance Improvement Solutions
- 6.2. Market Analysis, Insights and Forecast - by Mode of Delivery
- 6.2.1. Cloud-based Solutions
- 6.2.2. On-premise Solutions
- 6.3. Market Analysis, Insights and Forecast - by Application
- 6.3.1. Data Management
- 6.3.2. Risk Management
- 6.4. Market Analysis, Insights and Forecast - by End User
- 6.4.1. Hospitals
- 6.4.2. Ambulatory Care Centers
- 6.4.3. Other End Users
- 6.1. Market Analysis, Insights and Forecast - by Software Type
- 7. North America Healthcare Quality Management Market Analysis, Insights and Forecast, 2021-2033
- 7.1. Market Analysis, Insights and Forecast - by Software Type
- 7.1.1. Business Intelligence and Analytics Solutions
- 7.1.2. Physician Quality Reporting Solutions
- 7.1.3. Clinical Risk Management Solutions
- 7.1.4. Provider Performance Improvement Solutions
- 7.2. Market Analysis, Insights and Forecast - by Mode of Delivery
- 7.2.1. Cloud-based Solutions
- 7.2.2. On-premise Solutions
- 7.3. Market Analysis, Insights and Forecast - by Application
- 7.3.1. Data Management
- 7.3.2. Risk Management
- 7.4. Market Analysis, Insights and Forecast - by End User
- 7.4.1. Hospitals
- 7.4.2. Ambulatory Care Centers
- 7.4.3. Other End Users
- 7.1. Market Analysis, Insights and Forecast - by Software Type
- 8. Europe Healthcare Quality Management Market Analysis, Insights and Forecast, 2021-2033
- 8.1. Market Analysis, Insights and Forecast - by Software Type
- 8.1.1. Business Intelligence and Analytics Solutions
- 8.1.2. Physician Quality Reporting Solutions
- 8.1.3. Clinical Risk Management Solutions
- 8.1.4. Provider Performance Improvement Solutions
- 8.2. Market Analysis, Insights and Forecast - by Mode of Delivery
- 8.2.1. Cloud-based Solutions
- 8.2.2. On-premise Solutions
- 8.3. Market Analysis, Insights and Forecast - by Application
- 8.3.1. Data Management
- 8.3.2. Risk Management
- 8.4. Market Analysis, Insights and Forecast - by End User
- 8.4.1. Hospitals
- 8.4.2. Ambulatory Care Centers
- 8.4.3. Other End Users
- 8.1. Market Analysis, Insights and Forecast - by Software Type
- 9. Asia Pacific Healthcare Quality Management Market Analysis, Insights and Forecast, 2021-2033
- 9.1. Market Analysis, Insights and Forecast - by Software Type
- 9.1.1. Business Intelligence and Analytics Solutions
- 9.1.2. Physician Quality Reporting Solutions
- 9.1.3. Clinical Risk Management Solutions
- 9.1.4. Provider Performance Improvement Solutions
- 9.2. Market Analysis, Insights and Forecast - by Mode of Delivery
- 9.2.1. Cloud-based Solutions
- 9.2.2. On-premise Solutions
- 9.3. Market Analysis, Insights and Forecast - by Application
- 9.3.1. Data Management
- 9.3.2. Risk Management
- 9.4. Market Analysis, Insights and Forecast - by End User
- 9.4.1. Hospitals
- 9.4.2. Ambulatory Care Centers
- 9.4.3. Other End Users
- 9.1. Market Analysis, Insights and Forecast - by Software Type
- 10. Middle East and Africa Healthcare Quality Management Market Analysis, Insights and Forecast, 2021-2033
- 10.1. Market Analysis, Insights and Forecast - by Software Type
- 10.1.1. Business Intelligence and Analytics Solutions
- 10.1.2. Physician Quality Reporting Solutions
- 10.1.3. Clinical Risk Management Solutions
- 10.1.4. Provider Performance Improvement Solutions
- 10.2. Market Analysis, Insights and Forecast - by Mode of Delivery
- 10.2.1. Cloud-based Solutions
- 10.2.2. On-premise Solutions
- 10.3. Market Analysis, Insights and Forecast - by Application
- 10.3.1. Data Management
- 10.3.2. Risk Management
- 10.4. Market Analysis, Insights and Forecast - by End User
- 10.4.1. Hospitals
- 10.4.2. Ambulatory Care Centers
- 10.4.3. Other End Users
- 10.1. Market Analysis, Insights and Forecast - by Software Type
- 11. South America Healthcare Quality Management Market Analysis, Insights and Forecast, 2021-2033
- 11.1. Market Analysis, Insights and Forecast - by Software Type
- 11.1.1. Business Intelligence and Analytics Solutions
- 11.1.2. Physician Quality Reporting Solutions
- 11.1.3. Clinical Risk Management Solutions
- 11.1.4. Provider Performance Improvement Solutions
- 11.2. Market Analysis, Insights and Forecast - by Mode of Delivery
- 11.2.1. Cloud-based Solutions
- 11.2.2. On-premise Solutions
- 11.3. Market Analysis, Insights and Forecast - by Application
- 11.3.1. Data Management
- 11.3.2. Risk Management
- 11.4. Market Analysis, Insights and Forecast - by End User
- 11.4.1. Hospitals
- 11.4.2. Ambulatory Care Centers
- 11.4.3. Other End Users
- 11.1. Market Analysis, Insights and Forecast - by Software Type
- 12. Competitive Analysis
- 12.1. Company Profiles
- 12.1.1 Oracle (Cerner Corporation)
- 12.1.1.1. Company Overview
- 12.1.1.2. Products
- 12.1.1.3. Company Financials
- 12.1.1.4. SWOT Analysis
- 12.1.2 Compass Group (Crothall Healthcare Inc )
- 12.1.2.1. Company Overview
- 12.1.2.2. Products
- 12.1.2.3. Company Financials
- 12.1.2.4. SWOT Analysis
- 12.1.3 Microsoft Corporation (Nuance Communications Inc )
- 12.1.3.1. Company Overview
- 12.1.3.2. Products
- 12.1.3.3. Company Financials
- 12.1.3.4. SWOT Analysis
- 12.1.4 Dolbey Systems Inc
- 12.1.4.1. Company Overview
- 12.1.4.2. Products
- 12.1.4.3. Company Financials
- 12.1.4.4. SWOT Analysis
- 12.1.5 Premier Inc
- 12.1.5.1. Company Overview
- 12.1.5.2. Products
- 12.1.5.3. Company Financials
- 12.1.5.4. SWOT Analysis
- 12.1.6 RLDatix
- 12.1.6.1. Company Overview
- 12.1.6.2. Products
- 12.1.6.3. Company Financials
- 12.1.6.4. SWOT Analysis
- 12.1.7 Medisolv Inc
- 12.1.7.1. Company Overview
- 12.1.7.2. Products
- 12.1.7.3. Company Financials
- 12.1.7.4. SWOT Analysis
- 12.1.8 Change Healthcare
- 12.1.8.1. Company Overview
- 12.1.8.2. Products
- 12.1.8.3. Company Financials
- 12.1.8.4. SWOT Analysis
- 12.1.9 McKesson Corporation
- 12.1.9.1. Company Overview
- 12.1.9.2. Products
- 12.1.9.3. Company Financials
- 12.1.9.4. SWOT Analysis
- 12.1.10 CitiusTech Inc
- 12.1.10.1. Company Overview
- 12.1.10.2. Products
- 12.1.10.3. Company Financials
- 12.1.10.4. SWOT Analysis
- 12.1.11 IBM
- 12.1.11.1. Company Overview
- 12.1.11.2. Products
- 12.1.11.3. Company Financials
- 12.1.11.4. SWOT Analysis
- 12.1.1 Oracle (Cerner Corporation)
- 12.2. Market Entropy
- 12.2.1 Company's Key Areas Served
- 12.2.2 Recent Developments
- 12.3. Company Market Share Analysis 2025
- 12.3.1 Top 5 Companies Market Share Analysis
- 12.3.2 Top 3 Companies Market Share Analysis
- 12.4. List of Potential Customers
- 13. Research Methodology
List of Figures
- Figure 1: Global Healthcare Quality Management Market Revenue Breakdown (billion, %) by Region 2025 & 2033
- Figure 2: Global Healthcare Quality Management Market Volume Breakdown (K Unit, %) by Region 2025 & 2033
- Figure 3: North America Healthcare Quality Management Market Revenue (billion), by Software Type 2025 & 2033
- Figure 4: North America Healthcare Quality Management Market Volume (K Unit), by Software Type 2025 & 2033
- Figure 5: North America Healthcare Quality Management Market Revenue Share (%), by Software Type 2025 & 2033
- Figure 6: North America Healthcare Quality Management Market Volume Share (%), by Software Type 2025 & 2033
- Figure 7: North America Healthcare Quality Management Market Revenue (billion), by Mode of Delivery 2025 & 2033
- Figure 8: North America Healthcare Quality Management Market Volume (K Unit), by Mode of Delivery 2025 & 2033
- Figure 9: North America Healthcare Quality Management Market Revenue Share (%), by Mode of Delivery 2025 & 2033
- Figure 10: North America Healthcare Quality Management Market Volume Share (%), by Mode of Delivery 2025 & 2033
- Figure 11: North America Healthcare Quality Management Market Revenue (billion), by Application 2025 & 2033
- Figure 12: North America Healthcare Quality Management Market Volume (K Unit), by Application 2025 & 2033
- Figure 13: North America Healthcare Quality Management Market Revenue Share (%), by Application 2025 & 2033
- Figure 14: North America Healthcare Quality Management Market Volume Share (%), by Application 2025 & 2033
- Figure 15: North America Healthcare Quality Management Market Revenue (billion), by End User 2025 & 2033
- Figure 16: North America Healthcare Quality Management Market Volume (K Unit), by End User 2025 & 2033
- Figure 17: North America Healthcare Quality Management Market Revenue Share (%), by End User 2025 & 2033
- Figure 18: North America Healthcare Quality Management Market Volume Share (%), by End User 2025 & 2033
- Figure 19: North America Healthcare Quality Management Market Revenue (billion), by Country 2025 & 2033
- Figure 20: North America Healthcare Quality Management Market Volume (K Unit), by Country 2025 & 2033
- Figure 21: North America Healthcare Quality Management Market Revenue Share (%), by Country 2025 & 2033
- Figure 22: North America Healthcare Quality Management Market Volume Share (%), by Country 2025 & 2033
- Figure 23: Europe Healthcare Quality Management Market Revenue (billion), by Software Type 2025 & 2033
- Figure 24: Europe Healthcare Quality Management Market Volume (K Unit), by Software Type 2025 & 2033
- Figure 25: Europe Healthcare Quality Management Market Revenue Share (%), by Software Type 2025 & 2033
- Figure 26: Europe Healthcare Quality Management Market Volume Share (%), by Software Type 2025 & 2033
- Figure 27: Europe Healthcare Quality Management Market Revenue (billion), by Mode of Delivery 2025 & 2033
- Figure 28: Europe Healthcare Quality Management Market Volume (K Unit), by Mode of Delivery 2025 & 2033
- Figure 29: Europe Healthcare Quality Management Market Revenue Share (%), by Mode of Delivery 2025 & 2033
- Figure 30: Europe Healthcare Quality Management Market Volume Share (%), by Mode of Delivery 2025 & 2033
- Figure 31: Europe Healthcare Quality Management Market Revenue (billion), by Application 2025 & 2033
- Figure 32: Europe Healthcare Quality Management Market Volume (K Unit), by Application 2025 & 2033
- Figure 33: Europe Healthcare Quality Management Market Revenue Share (%), by Application 2025 & 2033
- Figure 34: Europe Healthcare Quality Management Market Volume Share (%), by Application 2025 & 2033
- Figure 35: Europe Healthcare Quality Management Market Revenue (billion), by End User 2025 & 2033
- Figure 36: Europe Healthcare Quality Management Market Volume (K Unit), by End User 2025 & 2033
- Figure 37: Europe Healthcare Quality Management Market Revenue Share (%), by End User 2025 & 2033
- Figure 38: Europe Healthcare Quality Management Market Volume Share (%), by End User 2025 & 2033
- Figure 39: Europe Healthcare Quality Management Market Revenue (billion), by Country 2025 & 2033
- Figure 40: Europe Healthcare Quality Management Market Volume (K Unit), by Country 2025 & 2033
- Figure 41: Europe Healthcare Quality Management Market Revenue Share (%), by Country 2025 & 2033
- Figure 42: Europe Healthcare Quality Management Market Volume Share (%), by Country 2025 & 2033
- Figure 43: Asia Pacific Healthcare Quality Management Market Revenue (billion), by Software Type 2025 & 2033
- Figure 44: Asia Pacific Healthcare Quality Management Market Volume (K Unit), by Software Type 2025 & 2033
- Figure 45: Asia Pacific Healthcare Quality Management Market Revenue Share (%), by Software Type 2025 & 2033
- Figure 46: Asia Pacific Healthcare Quality Management Market Volume Share (%), by Software Type 2025 & 2033
- Figure 47: Asia Pacific Healthcare Quality Management Market Revenue (billion), by Mode of Delivery 2025 & 2033
- Figure 48: Asia Pacific Healthcare Quality Management Market Volume (K Unit), by Mode of Delivery 2025 & 2033
- Figure 49: Asia Pacific Healthcare Quality Management Market Revenue Share (%), by Mode of Delivery 2025 & 2033
- Figure 50: Asia Pacific Healthcare Quality Management Market Volume Share (%), by Mode of Delivery 2025 & 2033
- Figure 51: Asia Pacific Healthcare Quality Management Market Revenue (billion), by Application 2025 & 2033
- Figure 52: Asia Pacific Healthcare Quality Management Market Volume (K Unit), by Application 2025 & 2033
- Figure 53: Asia Pacific Healthcare Quality Management Market Revenue Share (%), by Application 2025 & 2033
- Figure 54: Asia Pacific Healthcare Quality Management Market Volume Share (%), by Application 2025 & 2033
- Figure 55: Asia Pacific Healthcare Quality Management Market Revenue (billion), by End User 2025 & 2033
- Figure 56: Asia Pacific Healthcare Quality Management Market Volume (K Unit), by End User 2025 & 2033
- Figure 57: Asia Pacific Healthcare Quality Management Market Revenue Share (%), by End User 2025 & 2033
- Figure 58: Asia Pacific Healthcare Quality Management Market Volume Share (%), by End User 2025 & 2033
- Figure 59: Asia Pacific Healthcare Quality Management Market Revenue (billion), by Country 2025 & 2033
- Figure 60: Asia Pacific Healthcare Quality Management Market Volume (K Unit), by Country 2025 & 2033
- Figure 61: Asia Pacific Healthcare Quality Management Market Revenue Share (%), by Country 2025 & 2033
- Figure 62: Asia Pacific Healthcare Quality Management Market Volume Share (%), by Country 2025 & 2033
- Figure 63: Middle East and Africa Healthcare Quality Management Market Revenue (billion), by Software Type 2025 & 2033
- Figure 64: Middle East and Africa Healthcare Quality Management Market Volume (K Unit), by Software Type 2025 & 2033
- Figure 65: Middle East and Africa Healthcare Quality Management Market Revenue Share (%), by Software Type 2025 & 2033
- Figure 66: Middle East and Africa Healthcare Quality Management Market Volume Share (%), by Software Type 2025 & 2033
- Figure 67: Middle East and Africa Healthcare Quality Management Market Revenue (billion), by Mode of Delivery 2025 & 2033
- Figure 68: Middle East and Africa Healthcare Quality Management Market Volume (K Unit), by Mode of Delivery 2025 & 2033
- Figure 69: Middle East and Africa Healthcare Quality Management Market Revenue Share (%), by Mode of Delivery 2025 & 2033
- Figure 70: Middle East and Africa Healthcare Quality Management Market Volume Share (%), by Mode of Delivery 2025 & 2033
- Figure 71: Middle East and Africa Healthcare Quality Management Market Revenue (billion), by Application 2025 & 2033
- Figure 72: Middle East and Africa Healthcare Quality Management Market Volume (K Unit), by Application 2025 & 2033
- Figure 73: Middle East and Africa Healthcare Quality Management Market Revenue Share (%), by Application 2025 & 2033
- Figure 74: Middle East and Africa Healthcare Quality Management Market Volume Share (%), by Application 2025 & 2033
- Figure 75: Middle East and Africa Healthcare Quality Management Market Revenue (billion), by End User 2025 & 2033
- Figure 76: Middle East and Africa Healthcare Quality Management Market Volume (K Unit), by End User 2025 & 2033
- Figure 77: Middle East and Africa Healthcare Quality Management Market Revenue Share (%), by End User 2025 & 2033
- Figure 78: Middle East and Africa Healthcare Quality Management Market Volume Share (%), by End User 2025 & 2033
- Figure 79: Middle East and Africa Healthcare Quality Management Market Revenue (billion), by Country 2025 & 2033
- Figure 80: Middle East and Africa Healthcare Quality Management Market Volume (K Unit), by Country 2025 & 2033
- Figure 81: Middle East and Africa Healthcare Quality Management Market Revenue Share (%), by Country 2025 & 2033
- Figure 82: Middle East and Africa Healthcare Quality Management Market Volume Share (%), by Country 2025 & 2033
- Figure 83: South America Healthcare Quality Management Market Revenue (billion), by Software Type 2025 & 2033
- Figure 84: South America Healthcare Quality Management Market Volume (K Unit), by Software Type 2025 & 2033
- Figure 85: South America Healthcare Quality Management Market Revenue Share (%), by Software Type 2025 & 2033
- Figure 86: South America Healthcare Quality Management Market Volume Share (%), by Software Type 2025 & 2033
- Figure 87: South America Healthcare Quality Management Market Revenue (billion), by Mode of Delivery 2025 & 2033
- Figure 88: South America Healthcare Quality Management Market Volume (K Unit), by Mode of Delivery 2025 & 2033
- Figure 89: South America Healthcare Quality Management Market Revenue Share (%), by Mode of Delivery 2025 & 2033
- Figure 90: South America Healthcare Quality Management Market Volume Share (%), by Mode of Delivery 2025 & 2033
- Figure 91: South America Healthcare Quality Management Market Revenue (billion), by Application 2025 & 2033
- Figure 92: South America Healthcare Quality Management Market Volume (K Unit), by Application 2025 & 2033
- Figure 93: South America Healthcare Quality Management Market Revenue Share (%), by Application 2025 & 2033
- Figure 94: South America Healthcare Quality Management Market Volume Share (%), by Application 2025 & 2033
- Figure 95: South America Healthcare Quality Management Market Revenue (billion), by End User 2025 & 2033
- Figure 96: South America Healthcare Quality Management Market Volume (K Unit), by End User 2025 & 2033
- Figure 97: South America Healthcare Quality Management Market Revenue Share (%), by End User 2025 & 2033
- Figure 98: South America Healthcare Quality Management Market Volume Share (%), by End User 2025 & 2033
- Figure 99: South America Healthcare Quality Management Market Revenue (billion), by Country 2025 & 2033
- Figure 100: South America Healthcare Quality Management Market Volume (K Unit), by Country 2025 & 2033
- Figure 101: South America Healthcare Quality Management Market Revenue Share (%), by Country 2025 & 2033
- Figure 102: South America Healthcare Quality Management Market Volume Share (%), by Country 2025 & 2033
List of Tables
- Table 1: Global Healthcare Quality Management Market Revenue billion Forecast, by Software Type 2020 & 2033
- Table 2: Global Healthcare Quality Management Market Volume K Unit Forecast, by Software Type 2020 & 2033
- Table 3: Global Healthcare Quality Management Market Revenue billion Forecast, by Mode of Delivery 2020 & 2033
- Table 4: Global Healthcare Quality Management Market Volume K Unit Forecast, by Mode of Delivery 2020 & 2033
- Table 5: Global Healthcare Quality Management Market Revenue billion Forecast, by Application 2020 & 2033
- Table 6: Global Healthcare Quality Management Market Volume K Unit Forecast, by Application 2020 & 2033
- Table 7: Global Healthcare Quality Management Market Revenue billion Forecast, by End User 2020 & 2033
- Table 8: Global Healthcare Quality Management Market Volume K Unit Forecast, by End User 2020 & 2033
- Table 9: Global Healthcare Quality Management Market Revenue billion Forecast, by Region 2020 & 2033
- Table 10: Global Healthcare Quality Management Market Volume K Unit Forecast, by Region 2020 & 2033
- Table 11: Global Healthcare Quality Management Market Revenue billion Forecast, by Software Type 2020 & 2033
- Table 12: Global Healthcare Quality Management Market Volume K Unit Forecast, by Software Type 2020 & 2033
- Table 13: Global Healthcare Quality Management Market Revenue billion Forecast, by Mode of Delivery 2020 & 2033
- Table 14: Global Healthcare Quality Management Market Volume K Unit Forecast, by Mode of Delivery 2020 & 2033
- Table 15: Global Healthcare Quality Management Market Revenue billion Forecast, by Application 2020 & 2033
- Table 16: Global Healthcare Quality Management Market Volume K Unit Forecast, by Application 2020 & 2033
- Table 17: Global Healthcare Quality Management Market Revenue billion Forecast, by End User 2020 & 2033
- Table 18: Global Healthcare Quality Management Market Volume K Unit Forecast, by End User 2020 & 2033
- Table 19: Global Healthcare Quality Management Market Revenue billion Forecast, by Country 2020 & 2033
- Table 20: Global Healthcare Quality Management Market Volume K Unit Forecast, by Country 2020 & 2033
- Table 21: United States Healthcare Quality Management Market Revenue (billion) Forecast, by Application 2020 & 2033
- Table 22: United States Healthcare Quality Management Market Volume (K Unit) Forecast, by Application 2020 & 2033
- Table 23: Canada Healthcare Quality Management Market Revenue (billion) Forecast, by Application 2020 & 2033
- Table 24: Canada Healthcare Quality Management Market Volume (K Unit) Forecast, by Application 2020 & 2033
- Table 25: Mexico Healthcare Quality Management Market Revenue (billion) Forecast, by Application 2020 & 2033
- Table 26: Mexico Healthcare Quality Management Market Volume (K Unit) Forecast, by Application 2020 & 2033
- Table 27: Global Healthcare Quality Management Market Revenue billion Forecast, by Software Type 2020 & 2033
- Table 28: Global Healthcare Quality Management Market Volume K Unit Forecast, by Software Type 2020 & 2033
- Table 29: Global Healthcare Quality Management Market Revenue billion Forecast, by Mode of Delivery 2020 & 2033
- Table 30: Global Healthcare Quality Management Market Volume K Unit Forecast, by Mode of Delivery 2020 & 2033
- Table 31: Global Healthcare Quality Management Market Revenue billion Forecast, by Application 2020 & 2033
- Table 32: Global Healthcare Quality Management Market Volume K Unit Forecast, by Application 2020 & 2033
- Table 33: Global Healthcare Quality Management Market Revenue billion Forecast, by End User 2020 & 2033
- Table 34: Global Healthcare Quality Management Market Volume K Unit Forecast, by End User 2020 & 2033
- Table 35: Global Healthcare Quality Management Market Revenue billion Forecast, by Country 2020 & 2033
- Table 36: Global Healthcare Quality Management Market Volume K Unit Forecast, by Country 2020 & 2033
- Table 37: Germany Healthcare Quality Management Market Revenue (billion) Forecast, by Application 2020 & 2033
- Table 38: Germany Healthcare Quality Management Market Volume (K Unit) Forecast, by Application 2020 & 2033
- Table 39: United Kingdom Healthcare Quality Management Market Revenue (billion) Forecast, by Application 2020 & 2033
- Table 40: United Kingdom Healthcare Quality Management Market Volume (K Unit) Forecast, by Application 2020 & 2033
- Table 41: France Healthcare Quality Management Market Revenue (billion) Forecast, by Application 2020 & 2033
- Table 42: France Healthcare Quality Management Market Volume (K Unit) Forecast, by Application 2020 & 2033
- Table 43: Italy Healthcare Quality Management Market Revenue (billion) Forecast, by Application 2020 & 2033
- Table 44: Italy Healthcare Quality Management Market Volume (K Unit) Forecast, by Application 2020 & 2033
- Table 45: Spain Healthcare Quality Management Market Revenue (billion) Forecast, by Application 2020 & 2033
- Table 46: Spain Healthcare Quality Management Market Volume (K Unit) Forecast, by Application 2020 & 2033
- Table 47: Rest of Europe Healthcare Quality Management Market Revenue (billion) Forecast, by Application 2020 & 2033
- Table 48: Rest of Europe Healthcare Quality Management Market Volume (K Unit) Forecast, by Application 2020 & 2033
- Table 49: Global Healthcare Quality Management Market Revenue billion Forecast, by Software Type 2020 & 2033
- Table 50: Global Healthcare Quality Management Market Volume K Unit Forecast, by Software Type 2020 & 2033
- Table 51: Global Healthcare Quality Management Market Revenue billion Forecast, by Mode of Delivery 2020 & 2033
- Table 52: Global Healthcare Quality Management Market Volume K Unit Forecast, by Mode of Delivery 2020 & 2033
- Table 53: Global Healthcare Quality Management Market Revenue billion Forecast, by Application 2020 & 2033
- Table 54: Global Healthcare Quality Management Market Volume K Unit Forecast, by Application 2020 & 2033
- Table 55: Global Healthcare Quality Management Market Revenue billion Forecast, by End User 2020 & 2033
- Table 56: Global Healthcare Quality Management Market Volume K Unit Forecast, by End User 2020 & 2033
- Table 57: Global Healthcare Quality Management Market Revenue billion Forecast, by Country 2020 & 2033
- Table 58: Global Healthcare Quality Management Market Volume K Unit Forecast, by Country 2020 & 2033
- Table 59: China Healthcare Quality Management Market Revenue (billion) Forecast, by Application 2020 & 2033
- Table 60: China Healthcare Quality Management Market Volume (K Unit) Forecast, by Application 2020 & 2033
- Table 61: Japan Healthcare Quality Management Market Revenue (billion) Forecast, by Application 2020 & 2033
- Table 62: Japan Healthcare Quality Management Market Volume (K Unit) Forecast, by Application 2020 & 2033
- Table 63: India Healthcare Quality Management Market Revenue (billion) Forecast, by Application 2020 & 2033
- Table 64: India Healthcare Quality Management Market Volume (K Unit) Forecast, by Application 2020 & 2033
- Table 65: Australia Healthcare Quality Management Market Revenue (billion) Forecast, by Application 2020 & 2033
- Table 66: Australia Healthcare Quality Management Market Volume (K Unit) Forecast, by Application 2020 & 2033
- Table 67: South Korea Healthcare Quality Management Market Revenue (billion) Forecast, by Application 2020 & 2033
- Table 68: South Korea Healthcare Quality Management Market Volume (K Unit) Forecast, by Application 2020 & 2033
- Table 69: Rest of Asia Pacific Healthcare Quality Management Market Revenue (billion) Forecast, by Application 2020 & 2033
- Table 70: Rest of Asia Pacific Healthcare Quality Management Market Volume (K Unit) Forecast, by Application 2020 & 2033
- Table 71: Global Healthcare Quality Management Market Revenue billion Forecast, by Software Type 2020 & 2033
- Table 72: Global Healthcare Quality Management Market Volume K Unit Forecast, by Software Type 2020 & 2033
- Table 73: Global Healthcare Quality Management Market Revenue billion Forecast, by Mode of Delivery 2020 & 2033
- Table 74: Global Healthcare Quality Management Market Volume K Unit Forecast, by Mode of Delivery 2020 & 2033
- Table 75: Global Healthcare Quality Management Market Revenue billion Forecast, by Application 2020 & 2033
- Table 76: Global Healthcare Quality Management Market Volume K Unit Forecast, by Application 2020 & 2033
- Table 77: Global Healthcare Quality Management Market Revenue billion Forecast, by End User 2020 & 2033
- Table 78: Global Healthcare Quality Management Market Volume K Unit Forecast, by End User 2020 & 2033
- Table 79: Global Healthcare Quality Management Market Revenue billion Forecast, by Country 2020 & 2033
- Table 80: Global Healthcare Quality Management Market Volume K Unit Forecast, by Country 2020 & 2033
- Table 81: GCC Healthcare Quality Management Market Revenue (billion) Forecast, by Application 2020 & 2033
- Table 82: GCC Healthcare Quality Management Market Volume (K Unit) Forecast, by Application 2020 & 2033
- Table 83: South Africa Healthcare Quality Management Market Revenue (billion) Forecast, by Application 2020 & 2033
- Table 84: South Africa Healthcare Quality Management Market Volume (K Unit) Forecast, by Application 2020 & 2033
- Table 85: Rest of Middle East Healthcare Quality Management Market Revenue (billion) Forecast, by Application 2020 & 2033
- Table 86: Rest of Middle East Healthcare Quality Management Market Volume (K Unit) Forecast, by Application 2020 & 2033
- Table 87: Global Healthcare Quality Management Market Revenue billion Forecast, by Software Type 2020 & 2033
- Table 88: Global Healthcare Quality Management Market Volume K Unit Forecast, by Software Type 2020 & 2033
- Table 89: Global Healthcare Quality Management Market Revenue billion Forecast, by Mode of Delivery 2020 & 2033
- Table 90: Global Healthcare Quality Management Market Volume K Unit Forecast, by Mode of Delivery 2020 & 2033
- Table 91: Global Healthcare Quality Management Market Revenue billion Forecast, by Application 2020 & 2033
- Table 92: Global Healthcare Quality Management Market Volume K Unit Forecast, by Application 2020 & 2033
- Table 93: Global Healthcare Quality Management Market Revenue billion Forecast, by End User 2020 & 2033
- Table 94: Global Healthcare Quality Management Market Volume K Unit Forecast, by End User 2020 & 2033
- Table 95: Global Healthcare Quality Management Market Revenue billion Forecast, by Country 2020 & 2033
- Table 96: Global Healthcare Quality Management Market Volume K Unit Forecast, by Country 2020 & 2033
- Table 97: Brazil Healthcare Quality Management Market Revenue (billion) Forecast, by Application 2020 & 2033
- Table 98: Brazil Healthcare Quality Management Market Volume (K Unit) Forecast, by Application 2020 & 2033
- Table 99: Argentina Healthcare Quality Management Market Revenue (billion) Forecast, by Application 2020 & 2033
- Table 100: Argentina Healthcare Quality Management Market Volume (K Unit) Forecast, by Application 2020 & 2033
- Table 101: Rest of South America Healthcare Quality Management Market Revenue (billion) Forecast, by Application 2020 & 2033
- Table 102: Rest of South America Healthcare Quality Management Market Volume (K Unit) Forecast, by Application 2020 & 2033
Frequently Asked Questions
1. What is the projected Compound Annual Growth Rate (CAGR) of the Healthcare Quality Management Market?
The projected CAGR is approximately 12.1%.
2. Which companies are prominent players in the Healthcare Quality Management Market?
Key companies in the market include Oracle (Cerner Corporation), Compass Group (Crothall Healthcare Inc ), Microsoft Corporation (Nuance Communications Inc ), Dolbey Systems Inc, Premier Inc, RLDatix, Medisolv Inc, Change Healthcare, McKesson Corporation, CitiusTech Inc, IBM.
3. What are the main segments of the Healthcare Quality Management Market?
The market segments include Software Type, Mode of Delivery, Application, End User.
4. Can you provide details about the market size?
The market size is estimated to be USD 1.42 billion as of 2022.
5. What are some drivers contributing to market growth?
Government Mandates for the Healthcare Systems to Improve the Quality and Performance of the Healthcare Providers; Increasing Amount of Unstructured Data in Healthcare; Increase in Aging Population.
6. What are the notable trends driving market growth?
Business Intelligence and Analytics Solutions Segment is Expected to Register a Significant Growth Over the Forecast Period.
7. Are there any restraints impacting market growth?
Cost Associated with the Implementation of the Quality Reporting Systems; Data Security Issues Associated with the Quality Management Software.
8. Can you provide examples of recent developments in the market?
March 2023: Nuance's Dragon Ambient eXperience (DAX) will be integrated into Cerner's electronic health record (EHR) platform. Through conversational AI, DAX is aimed to simplify administrative labor for healthcare providers, extending the cooperation between Nuance and Cerner that began in 2020.
9. What pricing options are available for accessing the report?
Pricing options include single-user, multi-user, and enterprise licenses priced at USD 4750, USD 5250, and USD 8750 respectively.
10. Is the market size provided in terms of value or volume?
The market size is provided in terms of value, measured in billion and volume, measured in K Unit.
11. Are there any specific market keywords associated with the report?
Yes, the market keyword associated with the report is "Healthcare Quality Management Market," which aids in identifying and referencing the specific market segment covered.
12. How do I determine which pricing option suits my needs best?
The pricing options vary based on user requirements and access needs. Individual users may opt for single-user licenses, while businesses requiring broader access may choose multi-user or enterprise licenses for cost-effective access to the report.
13. Are there any additional resources or data provided in the Healthcare Quality Management Market report?
While the report offers comprehensive insights, it's advisable to review the specific contents or supplementary materials provided to ascertain if additional resources or data are available.
14. How can I stay updated on further developments or reports in the Healthcare Quality Management Market?
To stay informed about further developments, trends, and reports in the Healthcare Quality Management Market, consider subscribing to industry newsletters, following relevant companies and organizations, or regularly checking reputable industry news sources and publications.
Methodology
Step 1 - Identification of Relevant Samples Size from Population Database


Step 2 - Approaches for Defining Global Market Size (Value, Volume* & Price*)

Note*: In applicable scenarios
Step 3 - Data Sources
Primary Research
- Web Analytics
- Survey Reports
- Research Institute
- Latest Research Reports
- Opinion Leaders
Secondary Research
- Annual Reports
- White Paper
- Latest Press Release
- Industry Association
- Paid Database
- Investor Presentations

Step 4 - Data Triangulation
Involves using different sources of information in order to increase the validity of a study
These sources are likely to be stakeholders in a program - participants, other researchers, program staff, other community members, and so on.
Then we put all data in single framework & apply various statistical tools to find out the dynamic on the market.
During the analysis stage, feedback from the stakeholder groups would be compared to determine areas of agreement as well as areas of divergence