
Key Insights
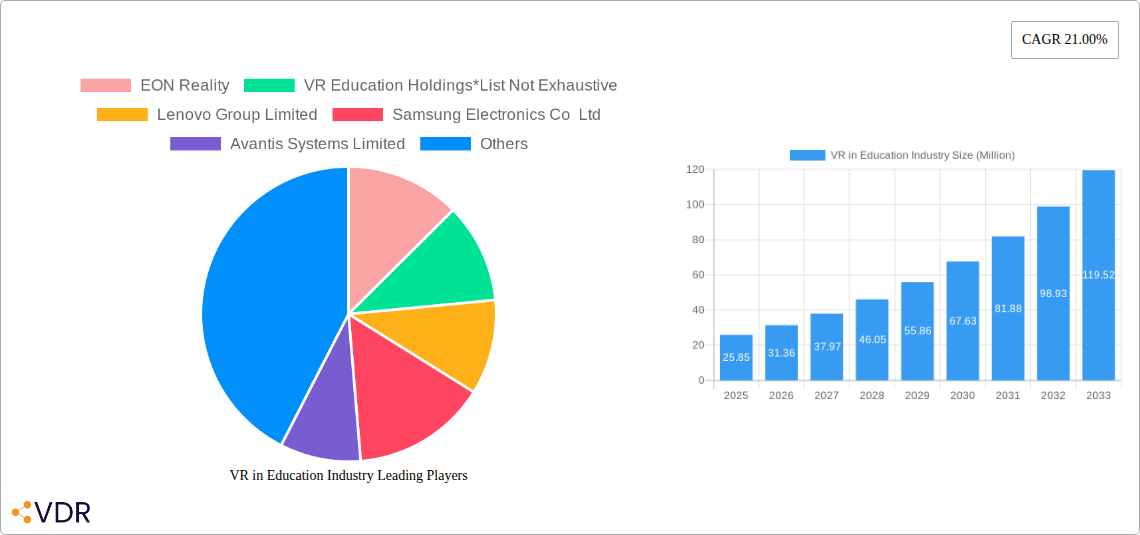
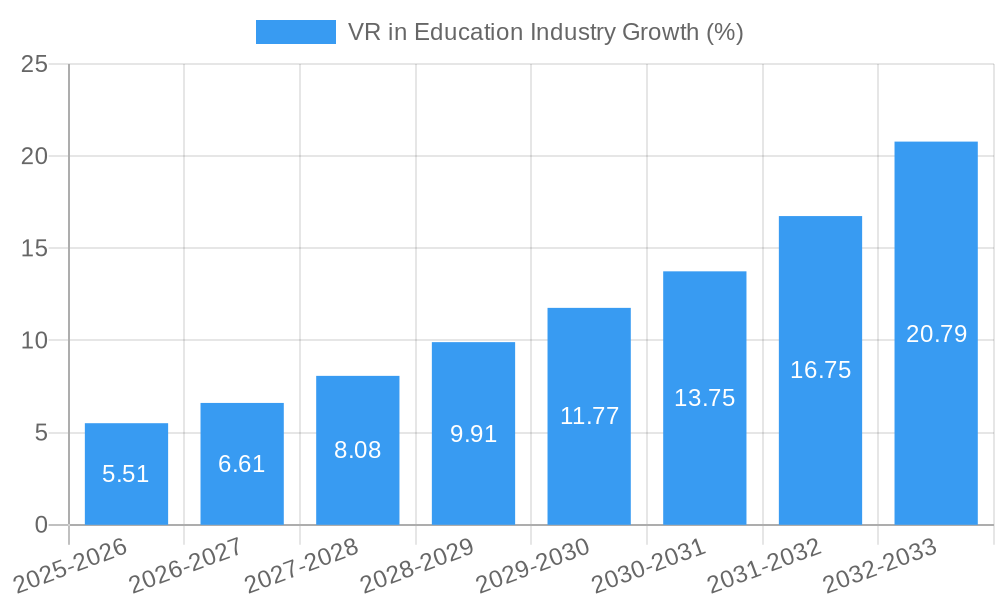
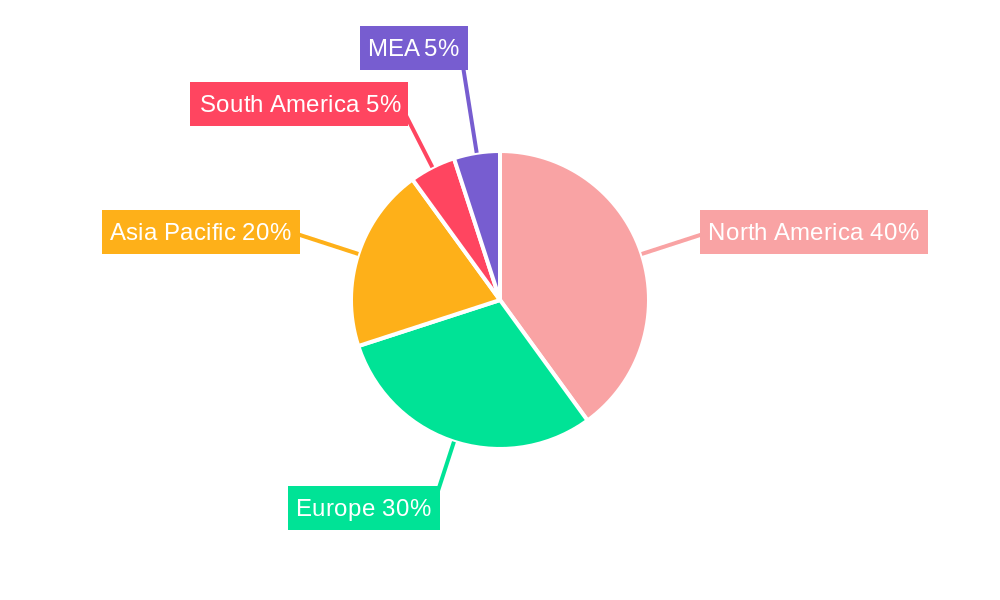
The global VR in education market is experiencing rapid growth, projected to reach \$25.85 million in 2025 and expand significantly over the forecast period (2025-2033). A compound annual growth rate (CAGR) of 21% indicates substantial market potential driven by several key factors. Increasing adoption of immersive technologies by educational institutions across all levels (K-12, higher education, corporate training) is a primary driver. The ability of VR to create engaging and interactive learning experiences, enhance student engagement and knowledge retention, and provide access to otherwise inaccessible environments and simulations is fueling this growth. Furthermore, advancements in VR hardware and software, offering more affordable and user-friendly solutions, are widening the market's accessibility. The market is segmented by type (hardware, software, services – encompassing training, consulting, and managed services) and end-user (academic institutions, higher education, corporate training). While North America currently holds a significant market share due to early adoption and technological advancements, regions like Asia-Pacific are expected to witness substantial growth driven by increasing investments in education technology and a growing student population. The market's continued expansion will be influenced by factors such as the development of more sophisticated VR content, integration with existing learning management systems, and addressing potential challenges related to cost, accessibility, and teacher training.
The competitive landscape is diverse, with key players ranging from established technology companies like Lenovo and Microsoft to specialized VR education providers such as EON Reality and VR Education Holdings. These companies are continuously innovating to offer comprehensive VR solutions catering to different educational needs. However, challenges such as the initial high cost of implementation, the need for robust internet infrastructure, and the requirement for teacher training to effectively integrate VR into the curriculum pose potential restraints to wider adoption. Despite these challenges, the long-term outlook for the VR in education market remains positive, with the potential to revolutionize the way students learn and educators teach, driving significant market expansion throughout the forecast period. Further research into the specific regional market share distribution and individual segment growth rates would provide more granular market understanding and refine business strategies.
VR in Education Industry: Market Report 2019-2033
This comprehensive report provides a detailed analysis of the Virtual Reality (VR) in Education market, encompassing market dynamics, growth trends, regional analysis, product landscape, key players, and future outlook. The study period covers 2019-2033, with 2025 as the base and estimated year. The forecast period spans 2025-2033, and the historical period is 2019-2024. This report is essential for industry professionals, investors, and educational institutions seeking to understand and capitalize on the burgeoning opportunities within the VR education sector. The total market size in 2025 is estimated at $xx Million.
VR in Education Industry Market Dynamics & Structure
The VR in Education market is characterized by moderate concentration, with several key players vying for market share. Technological innovation, particularly in areas like haptic feedback and immersive content creation, is a major driver of growth. Regulatory frameworks, while still evolving, are generally supportive of educational technology adoption. The market faces competition from traditional teaching methods, but the immersive and engaging nature of VR offers a compelling alternative. End-user demographics are expanding, encompassing K-12, higher education, and corporate training segments. M&A activity has been relatively robust, reflecting the strategic importance of this sector, with an estimated xx number of deals in the last 5 years.
- Market Concentration: Moderately concentrated, with top 5 players holding approximately xx% market share in 2025.
- Technological Innovation: Key drivers include advancements in haptic feedback, higher resolution displays, and improved content development tools.
- Regulatory Landscape: Generally supportive, with ongoing efforts to establish standards and ensure data privacy.
- Competitive Substitutes: Traditional teaching methods, augmented reality (AR) solutions.
- End-User Demographics: K-12, Higher Education (Universities and Colleges), Corporate Training.
- M&A Activity: Approximately xx deals in the past 5 years, indicating significant consolidation and investment.
VR in Education Industry Growth Trends & Insights
The VR in Education market has witnessed significant growth from 2019 to 2024, with a Compound Annual Growth Rate (CAGR) of xx%. This growth is propelled by increasing adoption rates across various educational levels, driven by factors like improved accessibility, cost reduction, and the demonstrable effectiveness of VR in enhancing learning outcomes. Technological advancements, such as more affordable hardware and easier-to-use software, are contributing to this expansion. A shift in consumer behavior, with increased acceptance of technology-driven learning solutions, further fuels market growth. The market penetration rate in 2025 is estimated at xx%. Market size is predicted to reach $xx Million by 2033. The report projects continued strong growth, fueled by ongoing technological advancements and increasing demand for immersive learning experiences.
Dominant Regions, Countries, or Segments in VR in Education Industry
North America currently holds the largest market share in the VR in Education sector, driven by high technological adoption rates, strong investment in education technology, and the presence of major market players. However, the Asia-Pacific region is exhibiting the fastest growth rate, fueled by increasing government initiatives, expanding digital infrastructure, and a large and growing student population. Within segments, the Software segment shows significant growth potential due to the ongoing development of innovative educational applications and platforms. The Higher Education sector is leading in VR adoption, followed by the Corporate Training sector.
- North America: High technology adoption, significant investment in EdTech.
- Asia-Pacific: Fastest-growing region, driven by government support and expanding digital infrastructure.
- Europe: Steady growth, driven by increasing awareness and adoption of VR in educational settings.
- Dominant Segments: Software is experiencing the highest growth, followed by Services (Training and Consulting). Higher Education leads in adoption rates.
VR in Education Industry Product Landscape
The VR in Education market offers a diverse range of products, including immersive headsets, interactive software platforms, and comprehensive training and consulting services. Hardware innovations focus on improved ergonomics, higher resolution displays, and enhanced tracking capabilities. Software developments emphasize intuitive interfaces, engaging content creation tools, and data analytics for performance measurement. The unique selling propositions are centered around enhanced learning engagement, personalized learning experiences, and cost-effective training solutions compared to traditional methods.
Key Drivers, Barriers & Challenges in VR in Education Industry
Key Drivers: Increased demand for engaging learning experiences, technological advancements in VR hardware and software, government initiatives promoting educational technology adoption, and the growing need for cost-effective training solutions.
Challenges: High initial investment costs for hardware and software, the need for robust internet connectivity, a lack of standardized curriculum and training materials, concerns about potential health effects associated with prolonged VR use, and the need to address the digital divide to ensure equitable access to VR technology.
Emerging Opportunities in VR in Education Industry
Emerging opportunities include the integration of VR with other educational technologies such as AR and AI, development of VR-based simulations for specific industries and professions, creation of immersive VR experiences for vocational training and education, expansion into new geographic markets, and increased personalization of learning experiences through adaptive VR learning platforms.
Growth Accelerators in the VR in Education Industry
Long-term growth will be accelerated by further technological advancements in VR hardware and software, strategic partnerships between educational institutions and technology providers, development of high-quality VR educational content, increased government funding and policy support, and the expansion of VR adoption across different educational levels and industries.
Key Players Shaping the VR in Education Industry Market
- EON Reality
- VR Education Holdings
- Lenovo Group Limited
- Samsung Electronics Co Ltd
- Avantis Systems Limited
- Virtalis Holdings Limited
- Unity Teach
- Microsoft Corporation
- zSpace Inc
- Nearpod Inc
- Veative Labs
- Alchemy VR Limited
- Meta Platforms Inc
- HTC Corporation
Notable Milestones in VR in Education Industry Sector
- October 2022: Jolly Good Inc. partners with Juntendo University to launch a VR medical education project in Thailand, providing VR equipment and content production facilities to Mahidol University.
- May 2022: XR Immersive Tech Inc.'s Synthesis VR partners with VictoryXR to distribute educational VR content to LBVR operators globally.
In-Depth VR in Education Industry Market Outlook
The VR in Education market is poised for continued strong growth, driven by technological advancements, strategic partnerships, and increasing demand for immersive and engaging learning experiences. The potential for VR to transform education across various sectors and geographical regions is immense, presenting significant opportunities for technology providers, educational institutions, and investors alike. Strategic investments in high-quality content development, accessible hardware, and effective teacher training will be crucial to fully realize the transformative potential of VR in education.
VR in Education Industry Segmentation
-
1. Type
- 1.1. Hardware
- 1.2. Software
- 1.3. Services
-
2. End User
-
2.1. Academic Institutions
- 2.1.1. K-12 Learning
- 2.1.2. Higher Education
-
2.2. Corporate Training
- 2.2.1. IT and Telecom
- 2.2.2. Healthcare
- 2.2.3. Retail and E-commerce
- 2.2.4. Other End users
-
2.1. Academic Institutions
VR in Education Industry Segmentation By Geography
- 1. North America
- 2. Europe
- 3. Asia Pacific
- 4. Rest of the World
VR in Education Industry REPORT HIGHLIGHTS
| Aspects | Details |
|---|---|
| Study Period | 2019-2033 |
| Base Year | 2024 |
| Estimated Year | 2025 |
| Forecast Period | 2025-2033 |
| Historical Period | 2019-2024 |
| Growth Rate | CAGR of 21.00% from 2019-2033 |
| Segmentation |
|
Table of Contents
- 1. Introduction
- 1.1. Research Scope
- 1.2. Market Segmentation
- 1.3. Research Methodology
- 1.4. Definitions and Assumptions
- 2. Executive Summary
- 2.1. Introduction
- 3. Market Dynamics
- 3.1. Introduction
- 3.2. Market Drivers
- 3.2.1. Increasing demand for interactive and personalized learning experience; Higher acceptance among stakeholders owing to higher engagement and scope for blended learning technology; VR-based technology benefits from being the first entrant in the education & corporate category; The role of education and training among corporates has transformed with the growth in digital engagement and compelling content
- 3.3. Market Restrains
- 3.3.1 Limited content and cost efficiency of consumer-grade applications; Dependence on external factors
- 3.3.2 such as bandwidth and network
- 3.3.3 for ensuring optimal experience
- 3.4. Market Trends
- 3.4.1. Increasing Demand For Interactive and Personalized Learning Experience
- 4. Market Factor Analysis
- 4.1. Porters Five Forces
- 4.2. Supply/Value Chain
- 4.3. PESTEL analysis
- 4.4. Market Entropy
- 4.5. Patent/Trademark Analysis
- 5. Global VR in Education Industry Analysis, Insights and Forecast, 2019-2031
- 5.1. Market Analysis, Insights and Forecast - by Type
- 5.1.1. Hardware
- 5.1.2. Software
- 5.1.3. Services
- 5.2. Market Analysis, Insights and Forecast - by End User
- 5.2.1. Academic Institutions
- 5.2.1.1. K-12 Learning
- 5.2.1.2. Higher Education
- 5.2.2. Corporate Training
- 5.2.2.1. IT and Telecom
- 5.2.2.2. Healthcare
- 5.2.2.3. Retail and E-commerce
- 5.2.2.4. Other End users
- 5.2.1. Academic Institutions
- 5.3. Market Analysis, Insights and Forecast - by Region
- 5.3.1. North America
- 5.3.2. Europe
- 5.3.3. Asia Pacific
- 5.3.4. Rest of the World
- 5.1. Market Analysis, Insights and Forecast - by Type
- 6. North America VR in Education Industry Analysis, Insights and Forecast, 2019-2031
- 6.1. Market Analysis, Insights and Forecast - by Type
- 6.1.1. Hardware
- 6.1.2. Software
- 6.1.3. Services
- 6.2. Market Analysis, Insights and Forecast - by End User
- 6.2.1. Academic Institutions
- 6.2.1.1. K-12 Learning
- 6.2.1.2. Higher Education
- 6.2.2. Corporate Training
- 6.2.2.1. IT and Telecom
- 6.2.2.2. Healthcare
- 6.2.2.3. Retail and E-commerce
- 6.2.2.4. Other End users
- 6.2.1. Academic Institutions
- 6.1. Market Analysis, Insights and Forecast - by Type
- 7. Europe VR in Education Industry Analysis, Insights and Forecast, 2019-2031
- 7.1. Market Analysis, Insights and Forecast - by Type
- 7.1.1. Hardware
- 7.1.2. Software
- 7.1.3. Services
- 7.2. Market Analysis, Insights and Forecast - by End User
- 7.2.1. Academic Institutions
- 7.2.1.1. K-12 Learning
- 7.2.1.2. Higher Education
- 7.2.2. Corporate Training
- 7.2.2.1. IT and Telecom
- 7.2.2.2. Healthcare
- 7.2.2.3. Retail and E-commerce
- 7.2.2.4. Other End users
- 7.2.1. Academic Institutions
- 7.1. Market Analysis, Insights and Forecast - by Type
- 8. Asia Pacific VR in Education Industry Analysis, Insights and Forecast, 2019-2031
- 8.1. Market Analysis, Insights and Forecast - by Type
- 8.1.1. Hardware
- 8.1.2. Software
- 8.1.3. Services
- 8.2. Market Analysis, Insights and Forecast - by End User
- 8.2.1. Academic Institutions
- 8.2.1.1. K-12 Learning
- 8.2.1.2. Higher Education
- 8.2.2. Corporate Training
- 8.2.2.1. IT and Telecom
- 8.2.2.2. Healthcare
- 8.2.2.3. Retail and E-commerce
- 8.2.2.4. Other End users
- 8.2.1. Academic Institutions
- 8.1. Market Analysis, Insights and Forecast - by Type
- 9. Rest of the World VR in Education Industry Analysis, Insights and Forecast, 2019-2031
- 9.1. Market Analysis, Insights and Forecast - by Type
- 9.1.1. Hardware
- 9.1.2. Software
- 9.1.3. Services
- 9.2. Market Analysis, Insights and Forecast - by End User
- 9.2.1. Academic Institutions
- 9.2.1.1. K-12 Learning
- 9.2.1.2. Higher Education
- 9.2.2. Corporate Training
- 9.2.2.1. IT and Telecom
- 9.2.2.2. Healthcare
- 9.2.2.3. Retail and E-commerce
- 9.2.2.4. Other End users
- 9.2.1. Academic Institutions
- 9.1. Market Analysis, Insights and Forecast - by Type
- 10. North America VR in Education Industry Analysis, Insights and Forecast, 2019-2031
- 10.1. Market Analysis, Insights and Forecast - By Country/Sub-region
- 10.1.1 United States
- 10.1.2 Canada
- 10.1.3 Mexico
- 11. Europe VR in Education Industry Analysis, Insights and Forecast, 2019-2031
- 11.1. Market Analysis, Insights and Forecast - By Country/Sub-region
- 11.1.1 Germany
- 11.1.2 United Kingdom
- 11.1.3 France
- 11.1.4 Spain
- 11.1.5 Italy
- 11.1.6 Spain
- 11.1.7 Belgium
- 11.1.8 Netherland
- 11.1.9 Nordics
- 11.1.10 Rest of Europe
- 12. Asia Pacific VR in Education Industry Analysis, Insights and Forecast, 2019-2031
- 12.1. Market Analysis, Insights and Forecast - By Country/Sub-region
- 12.1.1 China
- 12.1.2 Japan
- 12.1.3 India
- 12.1.4 South Korea
- 12.1.5 Southeast Asia
- 12.1.6 Australia
- 12.1.7 Indonesia
- 12.1.8 Phillipes
- 12.1.9 Singapore
- 12.1.10 Thailandc
- 12.1.11 Rest of Asia Pacific
- 13. South America VR in Education Industry Analysis, Insights and Forecast, 2019-2031
- 13.1. Market Analysis, Insights and Forecast - By Country/Sub-region
- 13.1.1 Brazil
- 13.1.2 Argentina
- 13.1.3 Peru
- 13.1.4 Chile
- 13.1.5 Colombia
- 13.1.6 Ecuador
- 13.1.7 Venezuela
- 13.1.8 Rest of South America
- 14. North America VR in Education Industry Analysis, Insights and Forecast, 2019-2031
- 14.1. Market Analysis, Insights and Forecast - By Country/Sub-region
- 14.1.1 United States
- 14.1.2 Canada
- 14.1.3 Mexico
- 15. MEA VR in Education Industry Analysis, Insights and Forecast, 2019-2031
- 15.1. Market Analysis, Insights and Forecast - By Country/Sub-region
- 15.1.1 United Arab Emirates
- 15.1.2 Saudi Arabia
- 15.1.3 South Africa
- 15.1.4 Rest of Middle East and Africa
- 16. Competitive Analysis
- 16.1. Global Market Share Analysis 2024
- 16.2. Company Profiles
- 16.2.1 EON Reality
- 16.2.1.1. Overview
- 16.2.1.2. Products
- 16.2.1.3. SWOT Analysis
- 16.2.1.4. Recent Developments
- 16.2.1.5. Financials (Based on Availability)
- 16.2.2 VR Education Holdings*List Not Exhaustive
- 16.2.2.1. Overview
- 16.2.2.2. Products
- 16.2.2.3. SWOT Analysis
- 16.2.2.4. Recent Developments
- 16.2.2.5. Financials (Based on Availability)
- 16.2.3 Lenovo Group Limited
- 16.2.3.1. Overview
- 16.2.3.2. Products
- 16.2.3.3. SWOT Analysis
- 16.2.3.4. Recent Developments
- 16.2.3.5. Financials (Based on Availability)
- 16.2.4 Samsung Electronics Co Ltd
- 16.2.4.1. Overview
- 16.2.4.2. Products
- 16.2.4.3. SWOT Analysis
- 16.2.4.4. Recent Developments
- 16.2.4.5. Financials (Based on Availability)
- 16.2.5 Avantis Systems Limited
- 16.2.5.1. Overview
- 16.2.5.2. Products
- 16.2.5.3. SWOT Analysis
- 16.2.5.4. Recent Developments
- 16.2.5.5. Financials (Based on Availability)
- 16.2.6 Virtalis Holdings Limited
- 16.2.6.1. Overview
- 16.2.6.2. Products
- 16.2.6.3. SWOT Analysis
- 16.2.6.4. Recent Developments
- 16.2.6.5. Financials (Based on Availability)
- 16.2.7 Unity Teach
- 16.2.7.1. Overview
- 16.2.7.2. Products
- 16.2.7.3. SWOT Analysis
- 16.2.7.4. Recent Developments
- 16.2.7.5. Financials (Based on Availability)
- 16.2.8 Microsoft Corporation
- 16.2.8.1. Overview
- 16.2.8.2. Products
- 16.2.8.3. SWOT Analysis
- 16.2.8.4. Recent Developments
- 16.2.8.5. Financials (Based on Availability)
- 16.2.9 zSpace Inc
- 16.2.9.1. Overview
- 16.2.9.2. Products
- 16.2.9.3. SWOT Analysis
- 16.2.9.4. Recent Developments
- 16.2.9.5. Financials (Based on Availability)
- 16.2.10 Nearpod Inc
- 16.2.10.1. Overview
- 16.2.10.2. Products
- 16.2.10.3. SWOT Analysis
- 16.2.10.4. Recent Developments
- 16.2.10.5. Financials (Based on Availability)
- 16.2.11 Veative Labs
- 16.2.11.1. Overview
- 16.2.11.2. Products
- 16.2.11.3. SWOT Analysis
- 16.2.11.4. Recent Developments
- 16.2.11.5. Financials (Based on Availability)
- 16.2.12 Alchemy VR Limited
- 16.2.12.1. Overview
- 16.2.12.2. Products
- 16.2.12.3. SWOT Analysis
- 16.2.12.4. Recent Developments
- 16.2.12.5. Financials (Based on Availability)
- 16.2.13 Meta Platforms Inc
- 16.2.13.1. Overview
- 16.2.13.2. Products
- 16.2.13.3. SWOT Analysis
- 16.2.13.4. Recent Developments
- 16.2.13.5. Financials (Based on Availability)
- 16.2.14 HTC Corporation
- 16.2.14.1. Overview
- 16.2.14.2. Products
- 16.2.14.3. SWOT Analysis
- 16.2.14.4. Recent Developments
- 16.2.14.5. Financials (Based on Availability)
- 16.2.1 EON Reality
List of Figures
- Figure 1: Global VR in Education Industry Revenue Breakdown (Million, %) by Region 2024 & 2032
- Figure 2: North America VR in Education Industry Revenue (Million), by Country 2024 & 2032
- Figure 3: North America VR in Education Industry Revenue Share (%), by Country 2024 & 2032
- Figure 4: Europe VR in Education Industry Revenue (Million), by Country 2024 & 2032
- Figure 5: Europe VR in Education Industry Revenue Share (%), by Country 2024 & 2032
- Figure 6: Asia Pacific VR in Education Industry Revenue (Million), by Country 2024 & 2032
- Figure 7: Asia Pacific VR in Education Industry Revenue Share (%), by Country 2024 & 2032
- Figure 8: South America VR in Education Industry Revenue (Million), by Country 2024 & 2032
- Figure 9: South America VR in Education Industry Revenue Share (%), by Country 2024 & 2032
- Figure 10: North America VR in Education Industry Revenue (Million), by Country 2024 & 2032
- Figure 11: North America VR in Education Industry Revenue Share (%), by Country 2024 & 2032
- Figure 12: MEA VR in Education Industry Revenue (Million), by Country 2024 & 2032
- Figure 13: MEA VR in Education Industry Revenue Share (%), by Country 2024 & 2032
- Figure 14: North America VR in Education Industry Revenue (Million), by Type 2024 & 2032
- Figure 15: North America VR in Education Industry Revenue Share (%), by Type 2024 & 2032
- Figure 16: North America VR in Education Industry Revenue (Million), by End User 2024 & 2032
- Figure 17: North America VR in Education Industry Revenue Share (%), by End User 2024 & 2032
- Figure 18: North America VR in Education Industry Revenue (Million), by Country 2024 & 2032
- Figure 19: North America VR in Education Industry Revenue Share (%), by Country 2024 & 2032
- Figure 20: Europe VR in Education Industry Revenue (Million), by Type 2024 & 2032
- Figure 21: Europe VR in Education Industry Revenue Share (%), by Type 2024 & 2032
- Figure 22: Europe VR in Education Industry Revenue (Million), by End User 2024 & 2032
- Figure 23: Europe VR in Education Industry Revenue Share (%), by End User 2024 & 2032
- Figure 24: Europe VR in Education Industry Revenue (Million), by Country 2024 & 2032
- Figure 25: Europe VR in Education Industry Revenue Share (%), by Country 2024 & 2032
- Figure 26: Asia Pacific VR in Education Industry Revenue (Million), by Type 2024 & 2032
- Figure 27: Asia Pacific VR in Education Industry Revenue Share (%), by Type 2024 & 2032
- Figure 28: Asia Pacific VR in Education Industry Revenue (Million), by End User 2024 & 2032
- Figure 29: Asia Pacific VR in Education Industry Revenue Share (%), by End User 2024 & 2032
- Figure 30: Asia Pacific VR in Education Industry Revenue (Million), by Country 2024 & 2032
- Figure 31: Asia Pacific VR in Education Industry Revenue Share (%), by Country 2024 & 2032
- Figure 32: Rest of the World VR in Education Industry Revenue (Million), by Type 2024 & 2032
- Figure 33: Rest of the World VR in Education Industry Revenue Share (%), by Type 2024 & 2032
- Figure 34: Rest of the World VR in Education Industry Revenue (Million), by End User 2024 & 2032
- Figure 35: Rest of the World VR in Education Industry Revenue Share (%), by End User 2024 & 2032
- Figure 36: Rest of the World VR in Education Industry Revenue (Million), by Country 2024 & 2032
- Figure 37: Rest of the World VR in Education Industry Revenue Share (%), by Country 2024 & 2032
List of Tables
- Table 1: Global VR in Education Industry Revenue Million Forecast, by Region 2019 & 2032
- Table 2: Global VR in Education Industry Revenue Million Forecast, by Type 2019 & 2032
- Table 3: Global VR in Education Industry Revenue Million Forecast, by End User 2019 & 2032
- Table 4: Global VR in Education Industry Revenue Million Forecast, by Region 2019 & 2032
- Table 5: Global VR in Education Industry Revenue Million Forecast, by Country 2019 & 2032
- Table 6: United States VR in Education Industry Revenue (Million) Forecast, by Application 2019 & 2032
- Table 7: Canada VR in Education Industry Revenue (Million) Forecast, by Application 2019 & 2032
- Table 8: Mexico VR in Education Industry Revenue (Million) Forecast, by Application 2019 & 2032
- Table 9: Global VR in Education Industry Revenue Million Forecast, by Country 2019 & 2032
- Table 10: Germany VR in Education Industry Revenue (Million) Forecast, by Application 2019 & 2032
- Table 11: United Kingdom VR in Education Industry Revenue (Million) Forecast, by Application 2019 & 2032
- Table 12: France VR in Education Industry Revenue (Million) Forecast, by Application 2019 & 2032
- Table 13: Spain VR in Education Industry Revenue (Million) Forecast, by Application 2019 & 2032
- Table 14: Italy VR in Education Industry Revenue (Million) Forecast, by Application 2019 & 2032
- Table 15: Spain VR in Education Industry Revenue (Million) Forecast, by Application 2019 & 2032
- Table 16: Belgium VR in Education Industry Revenue (Million) Forecast, by Application 2019 & 2032
- Table 17: Netherland VR in Education Industry Revenue (Million) Forecast, by Application 2019 & 2032
- Table 18: Nordics VR in Education Industry Revenue (Million) Forecast, by Application 2019 & 2032
- Table 19: Rest of Europe VR in Education Industry Revenue (Million) Forecast, by Application 2019 & 2032
- Table 20: Global VR in Education Industry Revenue Million Forecast, by Country 2019 & 2032
- Table 21: China VR in Education Industry Revenue (Million) Forecast, by Application 2019 & 2032
- Table 22: Japan VR in Education Industry Revenue (Million) Forecast, by Application 2019 & 2032
- Table 23: India VR in Education Industry Revenue (Million) Forecast, by Application 2019 & 2032
- Table 24: South Korea VR in Education Industry Revenue (Million) Forecast, by Application 2019 & 2032
- Table 25: Southeast Asia VR in Education Industry Revenue (Million) Forecast, by Application 2019 & 2032
- Table 26: Australia VR in Education Industry Revenue (Million) Forecast, by Application 2019 & 2032
- Table 27: Indonesia VR in Education Industry Revenue (Million) Forecast, by Application 2019 & 2032
- Table 28: Phillipes VR in Education Industry Revenue (Million) Forecast, by Application 2019 & 2032
- Table 29: Singapore VR in Education Industry Revenue (Million) Forecast, by Application 2019 & 2032
- Table 30: Thailandc VR in Education Industry Revenue (Million) Forecast, by Application 2019 & 2032
- Table 31: Rest of Asia Pacific VR in Education Industry Revenue (Million) Forecast, by Application 2019 & 2032
- Table 32: Global VR in Education Industry Revenue Million Forecast, by Country 2019 & 2032
- Table 33: Brazil VR in Education Industry Revenue (Million) Forecast, by Application 2019 & 2032
- Table 34: Argentina VR in Education Industry Revenue (Million) Forecast, by Application 2019 & 2032
- Table 35: Peru VR in Education Industry Revenue (Million) Forecast, by Application 2019 & 2032
- Table 36: Chile VR in Education Industry Revenue (Million) Forecast, by Application 2019 & 2032
- Table 37: Colombia VR in Education Industry Revenue (Million) Forecast, by Application 2019 & 2032
- Table 38: Ecuador VR in Education Industry Revenue (Million) Forecast, by Application 2019 & 2032
- Table 39: Venezuela VR in Education Industry Revenue (Million) Forecast, by Application 2019 & 2032
- Table 40: Rest of South America VR in Education Industry Revenue (Million) Forecast, by Application 2019 & 2032
- Table 41: Global VR in Education Industry Revenue Million Forecast, by Country 2019 & 2032
- Table 42: United States VR in Education Industry Revenue (Million) Forecast, by Application 2019 & 2032
- Table 43: Canada VR in Education Industry Revenue (Million) Forecast, by Application 2019 & 2032
- Table 44: Mexico VR in Education Industry Revenue (Million) Forecast, by Application 2019 & 2032
- Table 45: Global VR in Education Industry Revenue Million Forecast, by Country 2019 & 2032
- Table 46: United Arab Emirates VR in Education Industry Revenue (Million) Forecast, by Application 2019 & 2032
- Table 47: Saudi Arabia VR in Education Industry Revenue (Million) Forecast, by Application 2019 & 2032
- Table 48: South Africa VR in Education Industry Revenue (Million) Forecast, by Application 2019 & 2032
- Table 49: Rest of Middle East and Africa VR in Education Industry Revenue (Million) Forecast, by Application 2019 & 2032
- Table 50: Global VR in Education Industry Revenue Million Forecast, by Type 2019 & 2032
- Table 51: Global VR in Education Industry Revenue Million Forecast, by End User 2019 & 2032
- Table 52: Global VR in Education Industry Revenue Million Forecast, by Country 2019 & 2032
- Table 53: Global VR in Education Industry Revenue Million Forecast, by Type 2019 & 2032
- Table 54: Global VR in Education Industry Revenue Million Forecast, by End User 2019 & 2032
- Table 55: Global VR in Education Industry Revenue Million Forecast, by Country 2019 & 2032
- Table 56: Global VR in Education Industry Revenue Million Forecast, by Type 2019 & 2032
- Table 57: Global VR in Education Industry Revenue Million Forecast, by End User 2019 & 2032
- Table 58: Global VR in Education Industry Revenue Million Forecast, by Country 2019 & 2032
- Table 59: Global VR in Education Industry Revenue Million Forecast, by Type 2019 & 2032
- Table 60: Global VR in Education Industry Revenue Million Forecast, by End User 2019 & 2032
- Table 61: Global VR in Education Industry Revenue Million Forecast, by Country 2019 & 2032
Frequently Asked Questions
1. What is the projected Compound Annual Growth Rate (CAGR) of the VR in Education Industry?
The projected CAGR is approximately 21.00%.
2. Which companies are prominent players in the VR in Education Industry?
Key companies in the market include EON Reality, VR Education Holdings*List Not Exhaustive, Lenovo Group Limited, Samsung Electronics Co Ltd, Avantis Systems Limited, Virtalis Holdings Limited, Unity Teach, Microsoft Corporation, zSpace Inc, Nearpod Inc, Veative Labs, Alchemy VR Limited, Meta Platforms Inc, HTC Corporation.
3. What are the main segments of the VR in Education Industry?
The market segments include Type, End User.
4. Can you provide details about the market size?
The market size is estimated to be USD 25.85 Million as of 2022.
5. What are some drivers contributing to market growth?
Increasing demand for interactive and personalized learning experience; Higher acceptance among stakeholders owing to higher engagement and scope for blended learning technology; VR-based technology benefits from being the first entrant in the education & corporate category; The role of education and training among corporates has transformed with the growth in digital engagement and compelling content.
6. What are the notable trends driving market growth?
Increasing Demand For Interactive and Personalized Learning Experience.
7. Are there any restraints impacting market growth?
Limited content and cost efficiency of consumer-grade applications; Dependence on external factors. such as bandwidth and network. for ensuring optimal experience.
8. Can you provide examples of recent developments in the market?
October 2022: Japanese startup Jolly Good Inc., in partnership with Juntendo University, will commence a demonstration project to introduce medical education with virtual reality (VR) and develop human medical resources through VR at Royal Mahidol University and throughout Thailand. The company will provide Mahidol University with VR teaching material production facilities and VR experience equipment to create an environment that enables the self-production of VR teaching materials for infectious disease treatment education at the university.
9. What pricing options are available for accessing the report?
Pricing options include single-user, multi-user, and enterprise licenses priced at USD 4750, USD 5250, and USD 8750 respectively.
10. Is the market size provided in terms of value or volume?
The market size is provided in terms of value, measured in Million.
11. Are there any specific market keywords associated with the report?
Yes, the market keyword associated with the report is "VR in Education Industry," which aids in identifying and referencing the specific market segment covered.
12. How do I determine which pricing option suits my needs best?
The pricing options vary based on user requirements and access needs. Individual users may opt for single-user licenses, while businesses requiring broader access may choose multi-user or enterprise licenses for cost-effective access to the report.
13. Are there any additional resources or data provided in the VR in Education Industry report?
While the report offers comprehensive insights, it's advisable to review the specific contents or supplementary materials provided to ascertain if additional resources or data are available.
14. How can I stay updated on further developments or reports in the VR in Education Industry?
To stay informed about further developments, trends, and reports in the VR in Education Industry, consider subscribing to industry newsletters, following relevant companies and organizations, or regularly checking reputable industry news sources and publications.
Methodology
Step 1 - Identification of Relevant Samples Size from Population Database


Step 2 - Approaches for Defining Global Market Size (Value, Volume* & Price*)

Note*: In applicable scenarios
Step 3 - Data Sources
Primary Research
- Web Analytics
- Survey Reports
- Research Institute
- Latest Research Reports
- Opinion Leaders
Secondary Research
- Annual Reports
- White Paper
- Latest Press Release
- Industry Association
- Paid Database
- Investor Presentations

Step 4 - Data Triangulation
Involves using different sources of information in order to increase the validity of a study
These sources are likely to be stakeholders in a program - participants, other researchers, program staff, other community members, and so on.
Then we put all data in single framework & apply various statistical tools to find out the dynamic on the market.
During the analysis stage, feedback from the stakeholder groups would be compared to determine areas of agreement as well as areas of divergence


