

Key Insights
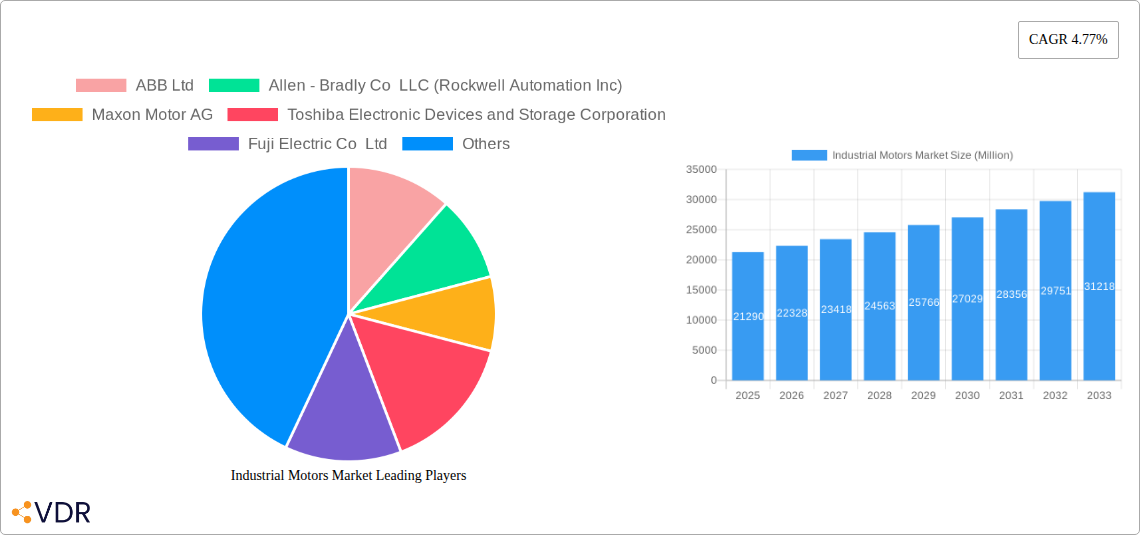
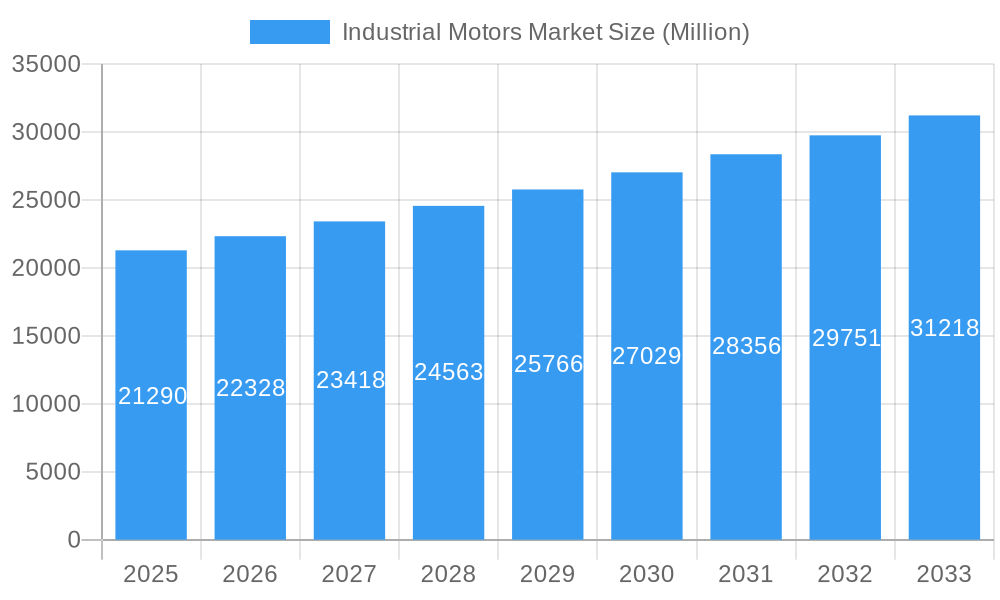
The global industrial motors market, valued at $21.29 billion in 2025, is projected to experience robust growth, driven by increasing automation across various industries and the rising demand for energy-efficient solutions. The market's Compound Annual Growth Rate (CAGR) of 4.77% from 2025 to 2033 indicates a significant expansion, fueled by several key factors. Growth in sectors such as oil and gas, power generation, and mining and metals, which heavily rely on industrial motors for their operations, is a primary driver. Furthermore, the ongoing trend towards Industry 4.0 and smart factories is boosting demand for advanced motor technologies, including servo and electronically commutated motors (EC motors), known for their precision and energy efficiency. The market is segmented by motor type (AC, DC, and others), voltage (high, medium, and low), and end-user industry, allowing for a granular understanding of specific market segments and their growth potential. While potential restraints like fluctuating raw material prices and supply chain disruptions might exist, the overall market outlook remains positive, driven by continuous technological advancements and the ever-increasing need for reliable and efficient industrial machinery across diverse sectors globally.
Industrial Motors Market Market Size (In Billion)
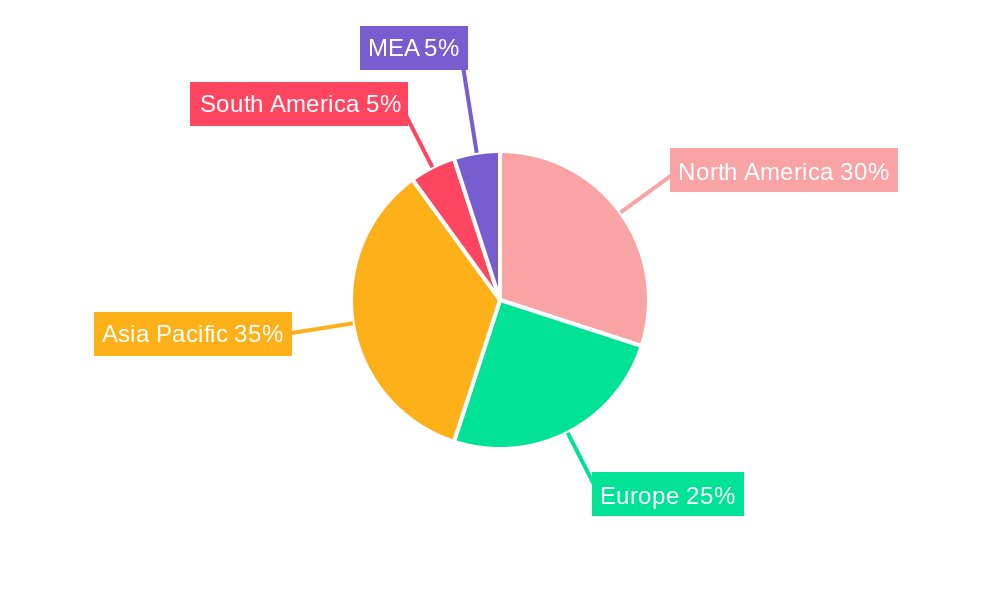
The regional distribution of the industrial motors market reflects the concentration of manufacturing and industrial activities across various geographic locations. North America and Europe are expected to maintain significant market shares, owing to the established industrial base and high adoption of advanced technologies. However, the Asia-Pacific region, particularly China and India, is poised for substantial growth due to rapid industrialization and infrastructure development. This region is expected to witness increased demand for industrial motors across diverse industries, contributing significantly to the overall market expansion. South America and the Middle East and Africa regions also present promising growth opportunities, albeit at potentially slower paces compared to the Asia-Pacific region. Competition within the market is intense, with major players such as ABB, Siemens, and others constantly innovating to enhance product offerings and capture market share. This competitive landscape fosters innovation and drives the development of more energy-efficient, durable, and intelligent industrial motors.
Industrial Motors Market Company Market Share
Industrial Motors Market: A Comprehensive Report (2019-2033)
This in-depth report provides a comprehensive analysis of the Industrial Motors Market, encompassing market dynamics, growth trends, regional dominance, product landscapes, and key players. The study period covers 2019-2033, with 2025 as the base and estimated year. The report is invaluable for industry professionals seeking actionable insights to navigate this dynamic sector. The market is segmented by type of motor (AC, DC, Other), voltage (High, Medium, Low), and end-user (Oil & Gas, Power Generation, Mining & Metals, Water & Wastewater, Chemicals & Petrochemicals, Discrete Manufacturing, Other).
Industrial Motors Market Dynamics & Structure
The industrial motors market is characterized by moderate concentration, with key players like ABB Ltd, Rockwell Automation Inc (Allen-Bradley), Siemens, and Nidec Industrial Solutions holding significant market share (estimated at xx%). Technological innovation, particularly in energy efficiency and smart motor technologies, is a primary growth driver. Stringent environmental regulations are pushing adoption of energy-efficient motors, while increasing automation across industries fuels demand. The market is also witnessing significant M&A activity, exemplified by ABB's acquisition of Siemens' low-voltage NEMA motor business in 2023. This trend is expected to continue, driven by the need for scale and technological advancements. Competitive substitutes include hydraulic and pneumatic systems, but the advantages of electric motors in terms of efficiency and control are bolstering their market dominance.
- Market Concentration: Moderately concentrated, with top players holding xx% market share.
- Technological Innovation: Focus on energy efficiency, smart motors, and digitalization.
- Regulatory Landscape: Stringent environmental regulations driving adoption of energy-efficient technologies.
- M&A Activity: High level of mergers and acquisitions, consolidating market share.
- Competitive Substitutes: Hydraulic and pneumatic systems, but electric motors remain dominant.
- End-User Demographics: Demand driven by growth across diverse industries, particularly in developing economies.
Industrial Motors Market Growth Trends & Insights
The industrial motors market is experiencing robust growth, driven by increasing industrial automation, rising energy efficiency standards, and infrastructure development across various sectors. The market size is estimated to reach xx million units in 2025, registering a CAGR of xx% during the forecast period (2025-2033). Technological disruptions like the integration of AI and IoT in motor control systems are reshaping the landscape, offering opportunities for enhanced performance and predictive maintenance. Shifts in consumer behavior, such as a preference for sustainable and energy-efficient solutions, further fuel market expansion. The adoption rate of advanced motor technologies, including servo and electronically commutated motors (EC motors), is steadily increasing, driven by their superior precision and efficiency.
(Note: XXX data source should be inserted here for specific CAGR and market penetration figures.)
Dominant Regions, Countries, or Segments in Industrial Motors Market
North America and Europe currently dominate the industrial motors market, driven by established industrial bases and high adoption rates of advanced technologies. However, Asia-Pacific is expected to witness the fastest growth during the forecast period, propelled by rapid industrialization and infrastructure development.
By Type of Motor: AC motors hold the largest market share, owing to their established technology and cost-effectiveness. However, the demand for DC motors and other advanced types (servo and EC motors) is growing rapidly, driven by their superior performance characteristics in specific applications.
By Voltage: Low-voltage motors dominate, reflecting the widespread use of these motors across various industrial applications. However, the market for medium and high-voltage motors is also growing, driven by demand from large-scale industrial operations.
By End-User: The Discrete Manufacturing and Oil and Gas sectors are significant drivers of market growth due to their extensive use of industrial motors.
- Key Drivers: Rapid industrialization, particularly in developing economies; increasing automation across industries; stringent environmental regulations; growing adoption of advanced motor technologies.
Industrial Motors Market Product Landscape
The industrial motor market showcases significant innovation in energy efficiency, control systems, and integration with Industry 4.0 technologies. Manufacturers are focusing on developing smaller, lighter, and more efficient motors. Advanced features like built-in sensors, data analytics capabilities, and predictive maintenance functionalities are enhancing motor performance and reliability. Unique selling propositions center on superior energy efficiency, reduced maintenance requirements, and enhanced operational reliability. Technological advancements are focused on integrating smart technologies, enhancing connectivity, and providing real-time performance monitoring.
Key Drivers, Barriers & Challenges in Industrial Motors Market
Key Drivers:
- Increasing industrial automation and digitization across various sectors.
- Growing demand for energy-efficient motors to meet sustainability goals.
- Infrastructure development and industrial expansion in developing economies.
Challenges and Restraints:
- Fluctuations in raw material prices and supply chain disruptions impacting production costs.
- Intense competition among established players and the emergence of new entrants.
- Stringent safety and regulatory compliance requirements.
Emerging Opportunities in Industrial Motors Market
Emerging opportunities include:
- Growing demand for energy-efficient motors in developing economies.
- Increased adoption of electric vehicles, creating demand for specialized motors.
- Growth in renewable energy sector driving demand for high-efficiency motors.
- Development of innovative motor designs for specialized applications (e.g., robotics, drones).
Growth Accelerators in the Industrial Motors Market Industry
Long-term growth will be driven by technological breakthroughs in motor design, increasing adoption of smart motor technologies, and strategic partnerships between motor manufacturers and industrial automation providers. Expansion into new markets, particularly in developing economies, also presents significant growth potential.
Key Players Shaping the Industrial Motors Market Market
- ABB Ltd
- Allen-Bradley Co LLC (Rockwell Automation Inc)
- Maxon Motor AG
- Toshiba Electronic Devices and Storage Corporation
- Fuji Electric Co Ltd
- ATB Austria Antriebstechnik AG
- Siemens
- Nidec Industrial Solutions
- Johnson Electric Holdings Limited
- Arc Systems Inc
- Emerson Electric Co
- Franklin Electric Co Inc
- Ametek Inc
- Menzel Elektromotoren Gmb
- Wolong Industrial Motors
Notable Milestones in Industrial Motors Market Sector
- May 2023: ABB acquires Siemens' low-voltage NEMA motor business, strengthening its market position.
- March 2023: Siemens launches "Innomotics," consolidating its motor-related businesses.
- September 2022: Mitsubishi Electric and TMEIC collaborate on an AI-powered motor design support system, accelerating development cycles.
In-Depth Industrial Motors Market Market Outlook
The industrial motors market is poised for continued growth, driven by the factors outlined above. Strategic opportunities lie in developing cutting-edge technologies, expanding into new and emerging markets, and fostering strategic partnerships to capture market share. The long-term outlook remains positive, with significant potential for market expansion and innovation.
Industrial Motors Market Segmentation
-
1. Type of Motor
- 1.1. Alternating Current (AC) Motors
- 1.2. Direct Current (DC) Motor
- 1.3. Other Ty
-
2. Voltage
- 2.1. High Voltage
- 2.2. Medium Voltage
- 2.3. Low Voltage
-
3. End User
- 3.1. Oil & Gas
- 3.2. Power Generation
- 3.3. Mining & Metals
- 3.4. Water & Wastewater Management
- 3.5. Chemicals & Petrochemicals
- 3.6. Discrete Manufacturing
- 3.7. Other End Users
Industrial Motors Market Segmentation By Geography
- 1. North America
- 2. Europe
- 3. Asia
- 4. Australia and New Zealand
- 5. Latin America
- 6. Middle East and Africa
Industrial Motors Market Regional Market Share
Geographic Coverage of Industrial Motors Market
Industrial Motors Market REPORT HIGHLIGHTS
| Aspects | Details |
|---|---|
| Study Period | 2020-2034 |
| Base Year | 2025 |
| Estimated Year | 2026 |
| Forecast Period | 2026-2034 |
| Historical Period | 2020-2025 |
| Growth Rate | CAGR of 4.77% from 2020-2034 |
| Segmentation |
|
Table of Contents
- 1. Introduction
- 1.1. Research Scope
- 1.2. Market Segmentation
- 1.3. Research Methodology
- 1.4. Definitions and Assumptions
- 2. Executive Summary
- 2.1. Introduction
- 3. Market Dynamics
- 3.1. Introduction
- 3.2. Market Drivers
- 3.2.1. Demand for Energy Efficiency Owing to Government Regulations; Growing Shift towards Smart Motors
- 3.3. Market Restrains
- 3.3.1. High Switching Costs May Act as a Restraint
- 3.4. Market Trends
- 3.4.1. Low Voltage to Hold Significant Market Share
- 4. Market Factor Analysis
- 4.1. Porters Five Forces
- 4.2. Supply/Value Chain
- 4.3. PESTEL analysis
- 4.4. Market Entropy
- 4.5. Patent/Trademark Analysis
- 5. Global Industrial Motors Market Analysis, Insights and Forecast, 2020-2032
- 5.1. Market Analysis, Insights and Forecast - by Type of Motor
- 5.1.1. Alternating Current (AC) Motors
- 5.1.2. Direct Current (DC) Motor
- 5.1.3. Other Ty
- 5.2. Market Analysis, Insights and Forecast - by Voltage
- 5.2.1. High Voltage
- 5.2.2. Medium Voltage
- 5.2.3. Low Voltage
- 5.3. Market Analysis, Insights and Forecast - by End User
- 5.3.1. Oil & Gas
- 5.3.2. Power Generation
- 5.3.3. Mining & Metals
- 5.3.4. Water & Wastewater Management
- 5.3.5. Chemicals & Petrochemicals
- 5.3.6. Discrete Manufacturing
- 5.3.7. Other End Users
- 5.4. Market Analysis, Insights and Forecast - by Region
- 5.4.1. North America
- 5.4.2. Europe
- 5.4.3. Asia
- 5.4.4. Australia and New Zealand
- 5.4.5. Latin America
- 5.4.6. Middle East and Africa
- 5.1. Market Analysis, Insights and Forecast - by Type of Motor
- 6. North America Industrial Motors Market Analysis, Insights and Forecast, 2020-2032
- 6.1. Market Analysis, Insights and Forecast - by Type of Motor
- 6.1.1. Alternating Current (AC) Motors
- 6.1.2. Direct Current (DC) Motor
- 6.1.3. Other Ty
- 6.2. Market Analysis, Insights and Forecast - by Voltage
- 6.2.1. High Voltage
- 6.2.2. Medium Voltage
- 6.2.3. Low Voltage
- 6.3. Market Analysis, Insights and Forecast - by End User
- 6.3.1. Oil & Gas
- 6.3.2. Power Generation
- 6.3.3. Mining & Metals
- 6.3.4. Water & Wastewater Management
- 6.3.5. Chemicals & Petrochemicals
- 6.3.6. Discrete Manufacturing
- 6.3.7. Other End Users
- 6.1. Market Analysis, Insights and Forecast - by Type of Motor
- 7. Europe Industrial Motors Market Analysis, Insights and Forecast, 2020-2032
- 7.1. Market Analysis, Insights and Forecast - by Type of Motor
- 7.1.1. Alternating Current (AC) Motors
- 7.1.2. Direct Current (DC) Motor
- 7.1.3. Other Ty
- 7.2. Market Analysis, Insights and Forecast - by Voltage
- 7.2.1. High Voltage
- 7.2.2. Medium Voltage
- 7.2.3. Low Voltage
- 7.3. Market Analysis, Insights and Forecast - by End User
- 7.3.1. Oil & Gas
- 7.3.2. Power Generation
- 7.3.3. Mining & Metals
- 7.3.4. Water & Wastewater Management
- 7.3.5. Chemicals & Petrochemicals
- 7.3.6. Discrete Manufacturing
- 7.3.7. Other End Users
- 7.1. Market Analysis, Insights and Forecast - by Type of Motor
- 8. Asia Industrial Motors Market Analysis, Insights and Forecast, 2020-2032
- 8.1. Market Analysis, Insights and Forecast - by Type of Motor
- 8.1.1. Alternating Current (AC) Motors
- 8.1.2. Direct Current (DC) Motor
- 8.1.3. Other Ty
- 8.2. Market Analysis, Insights and Forecast - by Voltage
- 8.2.1. High Voltage
- 8.2.2. Medium Voltage
- 8.2.3. Low Voltage
- 8.3. Market Analysis, Insights and Forecast - by End User
- 8.3.1. Oil & Gas
- 8.3.2. Power Generation
- 8.3.3. Mining & Metals
- 8.3.4. Water & Wastewater Management
- 8.3.5. Chemicals & Petrochemicals
- 8.3.6. Discrete Manufacturing
- 8.3.7. Other End Users
- 8.1. Market Analysis, Insights and Forecast - by Type of Motor
- 9. Australia and New Zealand Industrial Motors Market Analysis, Insights and Forecast, 2020-2032
- 9.1. Market Analysis, Insights and Forecast - by Type of Motor
- 9.1.1. Alternating Current (AC) Motors
- 9.1.2. Direct Current (DC) Motor
- 9.1.3. Other Ty
- 9.2. Market Analysis, Insights and Forecast - by Voltage
- 9.2.1. High Voltage
- 9.2.2. Medium Voltage
- 9.2.3. Low Voltage
- 9.3. Market Analysis, Insights and Forecast - by End User
- 9.3.1. Oil & Gas
- 9.3.2. Power Generation
- 9.3.3. Mining & Metals
- 9.3.4. Water & Wastewater Management
- 9.3.5. Chemicals & Petrochemicals
- 9.3.6. Discrete Manufacturing
- 9.3.7. Other End Users
- 9.1. Market Analysis, Insights and Forecast - by Type of Motor
- 10. Latin America Industrial Motors Market Analysis, Insights and Forecast, 2020-2032
- 10.1. Market Analysis, Insights and Forecast - by Type of Motor
- 10.1.1. Alternating Current (AC) Motors
- 10.1.2. Direct Current (DC) Motor
- 10.1.3. Other Ty
- 10.2. Market Analysis, Insights and Forecast - by Voltage
- 10.2.1. High Voltage
- 10.2.2. Medium Voltage
- 10.2.3. Low Voltage
- 10.3. Market Analysis, Insights and Forecast - by End User
- 10.3.1. Oil & Gas
- 10.3.2. Power Generation
- 10.3.3. Mining & Metals
- 10.3.4. Water & Wastewater Management
- 10.3.5. Chemicals & Petrochemicals
- 10.3.6. Discrete Manufacturing
- 10.3.7. Other End Users
- 10.1. Market Analysis, Insights and Forecast - by Type of Motor
- 11. Middle East and Africa Industrial Motors Market Analysis, Insights and Forecast, 2020-2032
- 11.1. Market Analysis, Insights and Forecast - by Type of Motor
- 11.1.1. Alternating Current (AC) Motors
- 11.1.2. Direct Current (DC) Motor
- 11.1.3. Other Ty
- 11.2. Market Analysis, Insights and Forecast - by Voltage
- 11.2.1. High Voltage
- 11.2.2. Medium Voltage
- 11.2.3. Low Voltage
- 11.3. Market Analysis, Insights and Forecast - by End User
- 11.3.1. Oil & Gas
- 11.3.2. Power Generation
- 11.3.3. Mining & Metals
- 11.3.4. Water & Wastewater Management
- 11.3.5. Chemicals & Petrochemicals
- 11.3.6. Discrete Manufacturing
- 11.3.7. Other End Users
- 11.1. Market Analysis, Insights and Forecast - by Type of Motor
- 12. Competitive Analysis
- 12.1. Global Market Share Analysis 2025
- 12.2. Company Profiles
- 12.2.1 ABB Ltd
- 12.2.1.1. Overview
- 12.2.1.2. Products
- 12.2.1.3. SWOT Analysis
- 12.2.1.4. Recent Developments
- 12.2.1.5. Financials (Based on Availability)
- 12.2.2 Allen - Bradly Co LLC (Rockwell Automation Inc)
- 12.2.2.1. Overview
- 12.2.2.2. Products
- 12.2.2.3. SWOT Analysis
- 12.2.2.4. Recent Developments
- 12.2.2.5. Financials (Based on Availability)
- 12.2.3 Maxon Motor AG
- 12.2.3.1. Overview
- 12.2.3.2. Products
- 12.2.3.3. SWOT Analysis
- 12.2.3.4. Recent Developments
- 12.2.3.5. Financials (Based on Availability)
- 12.2.4 Toshiba Electronic Devices and Storage Corporation
- 12.2.4.1. Overview
- 12.2.4.2. Products
- 12.2.4.3. SWOT Analysis
- 12.2.4.4. Recent Developments
- 12.2.4.5. Financials (Based on Availability)
- 12.2.5 Fuji Electric Co Ltd
- 12.2.5.1. Overview
- 12.2.5.2. Products
- 12.2.5.3. SWOT Analysis
- 12.2.5.4. Recent Developments
- 12.2.5.5. Financials (Based on Availability)
- 12.2.6 ATB Austria Antriebstechnik AG
- 12.2.6.1. Overview
- 12.2.6.2. Products
- 12.2.6.3. SWOT Analysis
- 12.2.6.4. Recent Developments
- 12.2.6.5. Financials (Based on Availability)
- 12.2.7 Siemens
- 12.2.7.1. Overview
- 12.2.7.2. Products
- 12.2.7.3. SWOT Analysis
- 12.2.7.4. Recent Developments
- 12.2.7.5. Financials (Based on Availability)
- 12.2.8 Nidec Industrial Solutions
- 12.2.8.1. Overview
- 12.2.8.2. Products
- 12.2.8.3. SWOT Analysis
- 12.2.8.4. Recent Developments
- 12.2.8.5. Financials (Based on Availability)
- 12.2.9 Johnson Electric Holdings Limited
- 12.2.9.1. Overview
- 12.2.9.2. Products
- 12.2.9.3. SWOT Analysis
- 12.2.9.4. Recent Developments
- 12.2.9.5. Financials (Based on Availability)
- 12.2.10 Arc Systems Inc
- 12.2.10.1. Overview
- 12.2.10.2. Products
- 12.2.10.3. SWOT Analysis
- 12.2.10.4. Recent Developments
- 12.2.10.5. Financials (Based on Availability)
- 12.2.11 Emerson Electric Co
- 12.2.11.1. Overview
- 12.2.11.2. Products
- 12.2.11.3. SWOT Analysis
- 12.2.11.4. Recent Developments
- 12.2.11.5. Financials (Based on Availability)
- 12.2.12 Franklin Electric Co Inc
- 12.2.12.1. Overview
- 12.2.12.2. Products
- 12.2.12.3. SWOT Analysis
- 12.2.12.4. Recent Developments
- 12.2.12.5. Financials (Based on Availability)
- 12.2.13 Ametek Inc
- 12.2.13.1. Overview
- 12.2.13.2. Products
- 12.2.13.3. SWOT Analysis
- 12.2.13.4. Recent Developments
- 12.2.13.5. Financials (Based on Availability)
- 12.2.14 Menzel Elektromotoren Gmb
- 12.2.14.1. Overview
- 12.2.14.2. Products
- 12.2.14.3. SWOT Analysis
- 12.2.14.4. Recent Developments
- 12.2.14.5. Financials (Based on Availability)
- 12.2.15 Wolong Industrial Motors
- 12.2.15.1. Overview
- 12.2.15.2. Products
- 12.2.15.3. SWOT Analysis
- 12.2.15.4. Recent Developments
- 12.2.15.5. Financials (Based on Availability)
- 12.2.1 ABB Ltd
List of Figures
- Figure 1: Global Industrial Motors Market Revenue Breakdown (Million, %) by Region 2025 & 2033
- Figure 2: Global Industrial Motors Market Volume Breakdown (K Units, %) by Region 2025 & 2033
- Figure 3: North America Industrial Motors Market Revenue (Million), by Type of Motor 2025 & 2033
- Figure 4: North America Industrial Motors Market Volume (K Units), by Type of Motor 2025 & 2033
- Figure 5: North America Industrial Motors Market Revenue Share (%), by Type of Motor 2025 & 2033
- Figure 6: North America Industrial Motors Market Volume Share (%), by Type of Motor 2025 & 2033
- Figure 7: North America Industrial Motors Market Revenue (Million), by Voltage 2025 & 2033
- Figure 8: North America Industrial Motors Market Volume (K Units), by Voltage 2025 & 2033
- Figure 9: North America Industrial Motors Market Revenue Share (%), by Voltage 2025 & 2033
- Figure 10: North America Industrial Motors Market Volume Share (%), by Voltage 2025 & 2033
- Figure 11: North America Industrial Motors Market Revenue (Million), by End User 2025 & 2033
- Figure 12: North America Industrial Motors Market Volume (K Units), by End User 2025 & 2033
- Figure 13: North America Industrial Motors Market Revenue Share (%), by End User 2025 & 2033
- Figure 14: North America Industrial Motors Market Volume Share (%), by End User 2025 & 2033
- Figure 15: North America Industrial Motors Market Revenue (Million), by Country 2025 & 2033
- Figure 16: North America Industrial Motors Market Volume (K Units), by Country 2025 & 2033
- Figure 17: North America Industrial Motors Market Revenue Share (%), by Country 2025 & 2033
- Figure 18: North America Industrial Motors Market Volume Share (%), by Country 2025 & 2033
- Figure 19: Europe Industrial Motors Market Revenue (Million), by Type of Motor 2025 & 2033
- Figure 20: Europe Industrial Motors Market Volume (K Units), by Type of Motor 2025 & 2033
- Figure 21: Europe Industrial Motors Market Revenue Share (%), by Type of Motor 2025 & 2033
- Figure 22: Europe Industrial Motors Market Volume Share (%), by Type of Motor 2025 & 2033
- Figure 23: Europe Industrial Motors Market Revenue (Million), by Voltage 2025 & 2033
- Figure 24: Europe Industrial Motors Market Volume (K Units), by Voltage 2025 & 2033
- Figure 25: Europe Industrial Motors Market Revenue Share (%), by Voltage 2025 & 2033
- Figure 26: Europe Industrial Motors Market Volume Share (%), by Voltage 2025 & 2033
- Figure 27: Europe Industrial Motors Market Revenue (Million), by End User 2025 & 2033
- Figure 28: Europe Industrial Motors Market Volume (K Units), by End User 2025 & 2033
- Figure 29: Europe Industrial Motors Market Revenue Share (%), by End User 2025 & 2033
- Figure 30: Europe Industrial Motors Market Volume Share (%), by End User 2025 & 2033
- Figure 31: Europe Industrial Motors Market Revenue (Million), by Country 2025 & 2033
- Figure 32: Europe Industrial Motors Market Volume (K Units), by Country 2025 & 2033
- Figure 33: Europe Industrial Motors Market Revenue Share (%), by Country 2025 & 2033
- Figure 34: Europe Industrial Motors Market Volume Share (%), by Country 2025 & 2033
- Figure 35: Asia Industrial Motors Market Revenue (Million), by Type of Motor 2025 & 2033
- Figure 36: Asia Industrial Motors Market Volume (K Units), by Type of Motor 2025 & 2033
- Figure 37: Asia Industrial Motors Market Revenue Share (%), by Type of Motor 2025 & 2033
- Figure 38: Asia Industrial Motors Market Volume Share (%), by Type of Motor 2025 & 2033
- Figure 39: Asia Industrial Motors Market Revenue (Million), by Voltage 2025 & 2033
- Figure 40: Asia Industrial Motors Market Volume (K Units), by Voltage 2025 & 2033
- Figure 41: Asia Industrial Motors Market Revenue Share (%), by Voltage 2025 & 2033
- Figure 42: Asia Industrial Motors Market Volume Share (%), by Voltage 2025 & 2033
- Figure 43: Asia Industrial Motors Market Revenue (Million), by End User 2025 & 2033
- Figure 44: Asia Industrial Motors Market Volume (K Units), by End User 2025 & 2033
- Figure 45: Asia Industrial Motors Market Revenue Share (%), by End User 2025 & 2033
- Figure 46: Asia Industrial Motors Market Volume Share (%), by End User 2025 & 2033
- Figure 47: Asia Industrial Motors Market Revenue (Million), by Country 2025 & 2033
- Figure 48: Asia Industrial Motors Market Volume (K Units), by Country 2025 & 2033
- Figure 49: Asia Industrial Motors Market Revenue Share (%), by Country 2025 & 2033
- Figure 50: Asia Industrial Motors Market Volume Share (%), by Country 2025 & 2033
- Figure 51: Australia and New Zealand Industrial Motors Market Revenue (Million), by Type of Motor 2025 & 2033
- Figure 52: Australia and New Zealand Industrial Motors Market Volume (K Units), by Type of Motor 2025 & 2033
- Figure 53: Australia and New Zealand Industrial Motors Market Revenue Share (%), by Type of Motor 2025 & 2033
- Figure 54: Australia and New Zealand Industrial Motors Market Volume Share (%), by Type of Motor 2025 & 2033
- Figure 55: Australia and New Zealand Industrial Motors Market Revenue (Million), by Voltage 2025 & 2033
- Figure 56: Australia and New Zealand Industrial Motors Market Volume (K Units), by Voltage 2025 & 2033
- Figure 57: Australia and New Zealand Industrial Motors Market Revenue Share (%), by Voltage 2025 & 2033
- Figure 58: Australia and New Zealand Industrial Motors Market Volume Share (%), by Voltage 2025 & 2033
- Figure 59: Australia and New Zealand Industrial Motors Market Revenue (Million), by End User 2025 & 2033
- Figure 60: Australia and New Zealand Industrial Motors Market Volume (K Units), by End User 2025 & 2033
- Figure 61: Australia and New Zealand Industrial Motors Market Revenue Share (%), by End User 2025 & 2033
- Figure 62: Australia and New Zealand Industrial Motors Market Volume Share (%), by End User 2025 & 2033
- Figure 63: Australia and New Zealand Industrial Motors Market Revenue (Million), by Country 2025 & 2033
- Figure 64: Australia and New Zealand Industrial Motors Market Volume (K Units), by Country 2025 & 2033
- Figure 65: Australia and New Zealand Industrial Motors Market Revenue Share (%), by Country 2025 & 2033
- Figure 66: Australia and New Zealand Industrial Motors Market Volume Share (%), by Country 2025 & 2033
- Figure 67: Latin America Industrial Motors Market Revenue (Million), by Type of Motor 2025 & 2033
- Figure 68: Latin America Industrial Motors Market Volume (K Units), by Type of Motor 2025 & 2033
- Figure 69: Latin America Industrial Motors Market Revenue Share (%), by Type of Motor 2025 & 2033
- Figure 70: Latin America Industrial Motors Market Volume Share (%), by Type of Motor 2025 & 2033
- Figure 71: Latin America Industrial Motors Market Revenue (Million), by Voltage 2025 & 2033
- Figure 72: Latin America Industrial Motors Market Volume (K Units), by Voltage 2025 & 2033
- Figure 73: Latin America Industrial Motors Market Revenue Share (%), by Voltage 2025 & 2033
- Figure 74: Latin America Industrial Motors Market Volume Share (%), by Voltage 2025 & 2033
- Figure 75: Latin America Industrial Motors Market Revenue (Million), by End User 2025 & 2033
- Figure 76: Latin America Industrial Motors Market Volume (K Units), by End User 2025 & 2033
- Figure 77: Latin America Industrial Motors Market Revenue Share (%), by End User 2025 & 2033
- Figure 78: Latin America Industrial Motors Market Volume Share (%), by End User 2025 & 2033
- Figure 79: Latin America Industrial Motors Market Revenue (Million), by Country 2025 & 2033
- Figure 80: Latin America Industrial Motors Market Volume (K Units), by Country 2025 & 2033
- Figure 81: Latin America Industrial Motors Market Revenue Share (%), by Country 2025 & 2033
- Figure 82: Latin America Industrial Motors Market Volume Share (%), by Country 2025 & 2033
- Figure 83: Middle East and Africa Industrial Motors Market Revenue (Million), by Type of Motor 2025 & 2033
- Figure 84: Middle East and Africa Industrial Motors Market Volume (K Units), by Type of Motor 2025 & 2033
- Figure 85: Middle East and Africa Industrial Motors Market Revenue Share (%), by Type of Motor 2025 & 2033
- Figure 86: Middle East and Africa Industrial Motors Market Volume Share (%), by Type of Motor 2025 & 2033
- Figure 87: Middle East and Africa Industrial Motors Market Revenue (Million), by Voltage 2025 & 2033
- Figure 88: Middle East and Africa Industrial Motors Market Volume (K Units), by Voltage 2025 & 2033
- Figure 89: Middle East and Africa Industrial Motors Market Revenue Share (%), by Voltage 2025 & 2033
- Figure 90: Middle East and Africa Industrial Motors Market Volume Share (%), by Voltage 2025 & 2033
- Figure 91: Middle East and Africa Industrial Motors Market Revenue (Million), by End User 2025 & 2033
- Figure 92: Middle East and Africa Industrial Motors Market Volume (K Units), by End User 2025 & 2033
- Figure 93: Middle East and Africa Industrial Motors Market Revenue Share (%), by End User 2025 & 2033
- Figure 94: Middle East and Africa Industrial Motors Market Volume Share (%), by End User 2025 & 2033
- Figure 95: Middle East and Africa Industrial Motors Market Revenue (Million), by Country 2025 & 2033
- Figure 96: Middle East and Africa Industrial Motors Market Volume (K Units), by Country 2025 & 2033
- Figure 97: Middle East and Africa Industrial Motors Market Revenue Share (%), by Country 2025 & 2033
- Figure 98: Middle East and Africa Industrial Motors Market Volume Share (%), by Country 2025 & 2033
List of Tables
- Table 1: Global Industrial Motors Market Revenue Million Forecast, by Type of Motor 2020 & 2033
- Table 2: Global Industrial Motors Market Volume K Units Forecast, by Type of Motor 2020 & 2033
- Table 3: Global Industrial Motors Market Revenue Million Forecast, by Voltage 2020 & 2033
- Table 4: Global Industrial Motors Market Volume K Units Forecast, by Voltage 2020 & 2033
- Table 5: Global Industrial Motors Market Revenue Million Forecast, by End User 2020 & 2033
- Table 6: Global Industrial Motors Market Volume K Units Forecast, by End User 2020 & 2033
- Table 7: Global Industrial Motors Market Revenue Million Forecast, by Region 2020 & 2033
- Table 8: Global Industrial Motors Market Volume K Units Forecast, by Region 2020 & 2033
- Table 9: Global Industrial Motors Market Revenue Million Forecast, by Type of Motor 2020 & 2033
- Table 10: Global Industrial Motors Market Volume K Units Forecast, by Type of Motor 2020 & 2033
- Table 11: Global Industrial Motors Market Revenue Million Forecast, by Voltage 2020 & 2033
- Table 12: Global Industrial Motors Market Volume K Units Forecast, by Voltage 2020 & 2033
- Table 13: Global Industrial Motors Market Revenue Million Forecast, by End User 2020 & 2033
- Table 14: Global Industrial Motors Market Volume K Units Forecast, by End User 2020 & 2033
- Table 15: Global Industrial Motors Market Revenue Million Forecast, by Country 2020 & 2033
- Table 16: Global Industrial Motors Market Volume K Units Forecast, by Country 2020 & 2033
- Table 17: Global Industrial Motors Market Revenue Million Forecast, by Type of Motor 2020 & 2033
- Table 18: Global Industrial Motors Market Volume K Units Forecast, by Type of Motor 2020 & 2033
- Table 19: Global Industrial Motors Market Revenue Million Forecast, by Voltage 2020 & 2033
- Table 20: Global Industrial Motors Market Volume K Units Forecast, by Voltage 2020 & 2033
- Table 21: Global Industrial Motors Market Revenue Million Forecast, by End User 2020 & 2033
- Table 22: Global Industrial Motors Market Volume K Units Forecast, by End User 2020 & 2033
- Table 23: Global Industrial Motors Market Revenue Million Forecast, by Country 2020 & 2033
- Table 24: Global Industrial Motors Market Volume K Units Forecast, by Country 2020 & 2033
- Table 25: Global Industrial Motors Market Revenue Million Forecast, by Type of Motor 2020 & 2033
- Table 26: Global Industrial Motors Market Volume K Units Forecast, by Type of Motor 2020 & 2033
- Table 27: Global Industrial Motors Market Revenue Million Forecast, by Voltage 2020 & 2033
- Table 28: Global Industrial Motors Market Volume K Units Forecast, by Voltage 2020 & 2033
- Table 29: Global Industrial Motors Market Revenue Million Forecast, by End User 2020 & 2033
- Table 30: Global Industrial Motors Market Volume K Units Forecast, by End User 2020 & 2033
- Table 31: Global Industrial Motors Market Revenue Million Forecast, by Country 2020 & 2033
- Table 32: Global Industrial Motors Market Volume K Units Forecast, by Country 2020 & 2033
- Table 33: Global Industrial Motors Market Revenue Million Forecast, by Type of Motor 2020 & 2033
- Table 34: Global Industrial Motors Market Volume K Units Forecast, by Type of Motor 2020 & 2033
- Table 35: Global Industrial Motors Market Revenue Million Forecast, by Voltage 2020 & 2033
- Table 36: Global Industrial Motors Market Volume K Units Forecast, by Voltage 2020 & 2033
- Table 37: Global Industrial Motors Market Revenue Million Forecast, by End User 2020 & 2033
- Table 38: Global Industrial Motors Market Volume K Units Forecast, by End User 2020 & 2033
- Table 39: Global Industrial Motors Market Revenue Million Forecast, by Country 2020 & 2033
- Table 40: Global Industrial Motors Market Volume K Units Forecast, by Country 2020 & 2033
- Table 41: Global Industrial Motors Market Revenue Million Forecast, by Type of Motor 2020 & 2033
- Table 42: Global Industrial Motors Market Volume K Units Forecast, by Type of Motor 2020 & 2033
- Table 43: Global Industrial Motors Market Revenue Million Forecast, by Voltage 2020 & 2033
- Table 44: Global Industrial Motors Market Volume K Units Forecast, by Voltage 2020 & 2033
- Table 45: Global Industrial Motors Market Revenue Million Forecast, by End User 2020 & 2033
- Table 46: Global Industrial Motors Market Volume K Units Forecast, by End User 2020 & 2033
- Table 47: Global Industrial Motors Market Revenue Million Forecast, by Country 2020 & 2033
- Table 48: Global Industrial Motors Market Volume K Units Forecast, by Country 2020 & 2033
- Table 49: Global Industrial Motors Market Revenue Million Forecast, by Type of Motor 2020 & 2033
- Table 50: Global Industrial Motors Market Volume K Units Forecast, by Type of Motor 2020 & 2033
- Table 51: Global Industrial Motors Market Revenue Million Forecast, by Voltage 2020 & 2033
- Table 52: Global Industrial Motors Market Volume K Units Forecast, by Voltage 2020 & 2033
- Table 53: Global Industrial Motors Market Revenue Million Forecast, by End User 2020 & 2033
- Table 54: Global Industrial Motors Market Volume K Units Forecast, by End User 2020 & 2033
- Table 55: Global Industrial Motors Market Revenue Million Forecast, by Country 2020 & 2033
- Table 56: Global Industrial Motors Market Volume K Units Forecast, by Country 2020 & 2033
Frequently Asked Questions
1. What is the projected Compound Annual Growth Rate (CAGR) of the Industrial Motors Market?
The projected CAGR is approximately 4.77%.
2. Which companies are prominent players in the Industrial Motors Market?
Key companies in the market include ABB Ltd, Allen - Bradly Co LLC (Rockwell Automation Inc), Maxon Motor AG, Toshiba Electronic Devices and Storage Corporation, Fuji Electric Co Ltd, ATB Austria Antriebstechnik AG, Siemens, Nidec Industrial Solutions, Johnson Electric Holdings Limited, Arc Systems Inc, Emerson Electric Co, Franklin Electric Co Inc, Ametek Inc, Menzel Elektromotoren Gmb, Wolong Industrial Motors.
3. What are the main segments of the Industrial Motors Market?
The market segments include Type of Motor, Voltage, End User.
4. Can you provide details about the market size?
The market size is estimated to be USD 21.29 Million as of 2022.
5. What are some drivers contributing to market growth?
Demand for Energy Efficiency Owing to Government Regulations; Growing Shift towards Smart Motors.
6. What are the notable trends driving market growth?
Low Voltage to Hold Significant Market Share.
7. Are there any restraints impacting market growth?
High Switching Costs May Act as a Restraint.
8. Can you provide examples of recent developments in the market?
May 2023: ABB announced the completion of its acquisition of the Siemens low voltage NEMA motor business. According to the company, the acquisition is part of ABB's Motion business area's growth strategy and strengthens ABB's position among the leading industrial NEMA motor manufacturers.
9. What pricing options are available for accessing the report?
Pricing options include single-user, multi-user, and enterprise licenses priced at USD 4750, USD 5250, and USD 8750 respectively.
10. Is the market size provided in terms of value or volume?
The market size is provided in terms of value, measured in Million and volume, measured in K Units.
11. Are there any specific market keywords associated with the report?
Yes, the market keyword associated with the report is "Industrial Motors Market," which aids in identifying and referencing the specific market segment covered.
12. How do I determine which pricing option suits my needs best?
The pricing options vary based on user requirements and access needs. Individual users may opt for single-user licenses, while businesses requiring broader access may choose multi-user or enterprise licenses for cost-effective access to the report.
13. Are there any additional resources or data provided in the Industrial Motors Market report?
While the report offers comprehensive insights, it's advisable to review the specific contents or supplementary materials provided to ascertain if additional resources or data are available.
14. How can I stay updated on further developments or reports in the Industrial Motors Market?
To stay informed about further developments, trends, and reports in the Industrial Motors Market, consider subscribing to industry newsletters, following relevant companies and organizations, or regularly checking reputable industry news sources and publications.
Methodology
Step 1 - Identification of Relevant Samples Size from Population Database


Step 2 - Approaches for Defining Global Market Size (Value, Volume* & Price*)

Note*: In applicable scenarios
Step 3 - Data Sources
Primary Research
- Web Analytics
- Survey Reports
- Research Institute
- Latest Research Reports
- Opinion Leaders
Secondary Research
- Annual Reports
- White Paper
- Latest Press Release
- Industry Association
- Paid Database
- Investor Presentations

Step 4 - Data Triangulation
Involves using different sources of information in order to increase the validity of a study
These sources are likely to be stakeholders in a program - participants, other researchers, program staff, other community members, and so on.
Then we put all data in single framework & apply various statistical tools to find out the dynamic on the market.
During the analysis stage, feedback from the stakeholder groups would be compared to determine areas of agreement as well as areas of divergence