
Key Insights
The global ventilation mask market is experiencing robust growth, driven by several key factors. The increasing prevalence of respiratory illnesses, such as chronic obstructive pulmonary disease (COPD), asthma, and cystic fibrosis, is a major catalyst. Furthermore, the rising geriatric population, which is more susceptible to respiratory complications, significantly contributes to market expansion. Technological advancements in ventilation mask design, leading to improved comfort, ease of use, and enhanced therapeutic efficacy, are also fueling market growth. The incorporation of features like advanced materials for breathability and reduced skin irritation, along with integrated monitoring capabilities, are driving premium segment growth. The market is segmented by type (e.g., full-face masks, nasal masks, and oral masks), material (e.g., silicone, PVC, and other materials), and end-user (hospitals, home healthcare, and others). Competitive rivalry among established players like Air Liquide, Philips, and ResMed is shaping market dynamics, stimulating innovation and price competition. However, factors such as high initial costs associated with advanced ventilation masks and the potential for complications related to improper mask usage pose challenges to market growth.
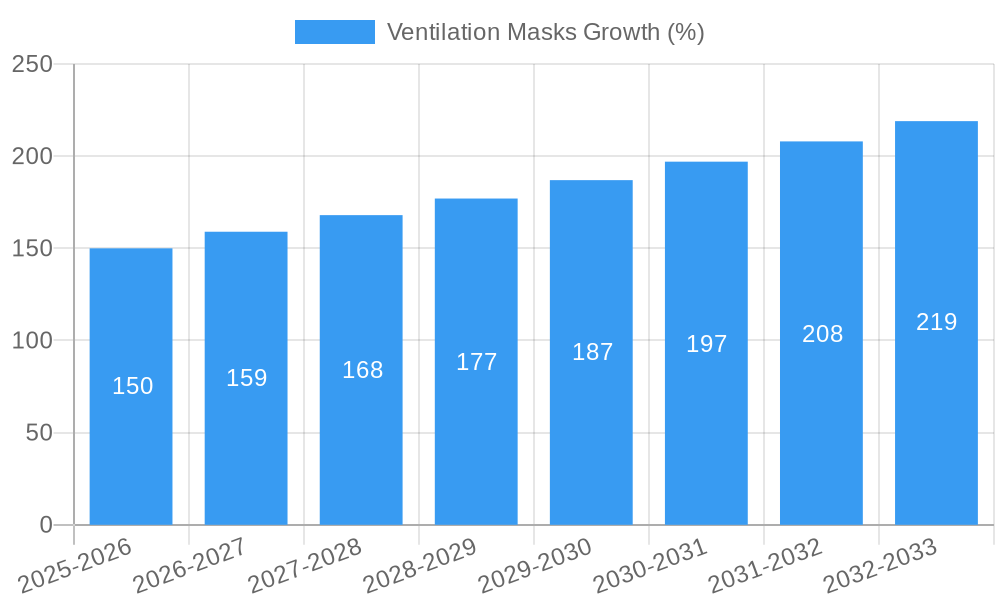
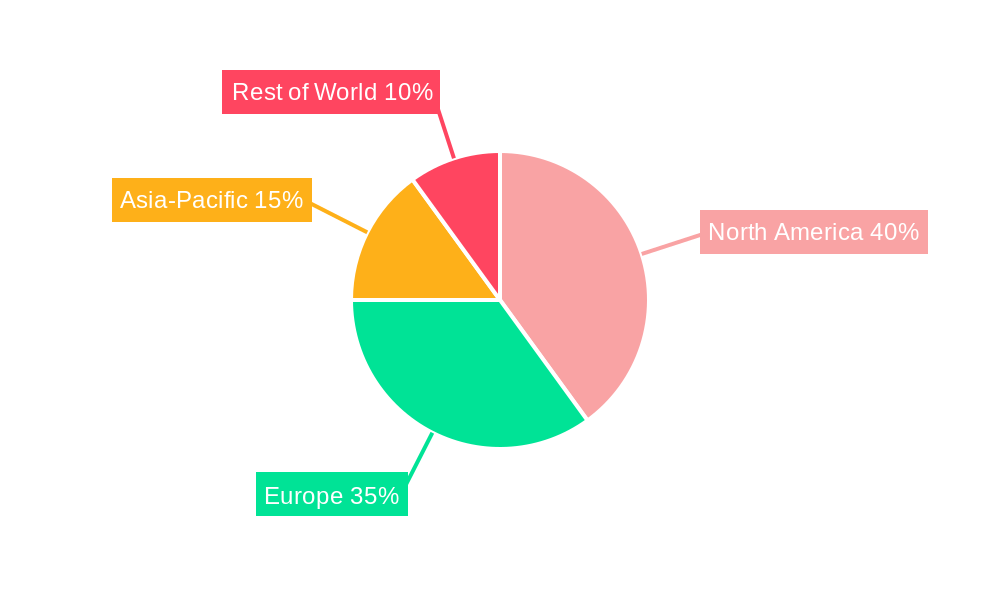
Despite these restraints, the market is projected to maintain a healthy compound annual growth rate (CAGR) of approximately 6% between 2025 and 2033. This growth trajectory reflects the sustained demand for effective respiratory support solutions and continuous technological improvements in the field. Regional variations exist, with North America and Europe currently commanding significant market shares. However, growth in emerging economies in Asia-Pacific and Latin America is expected to contribute significantly to the overall expansion of the global ventilation mask market over the forecast period. The market is poised for continued expansion as healthcare systems prioritize respiratory care and adopt innovative technologies to improve patient outcomes. This will also drive further segmentation and innovation within the ventilation mask sector.
Ventilation Masks Market Report: 2019-2033
This comprehensive report provides an in-depth analysis of the global Ventilation Masks market, encompassing market dynamics, growth trends, regional analysis, competitive landscape, and future outlook. The study period covers 2019-2033, with 2025 as the base and estimated year. The forecast period extends from 2025 to 2033, analyzing historical data from 2019-2024. This report is essential for industry professionals, investors, and stakeholders seeking a clear understanding of this critical sector within the broader Medical Devices and Respiratory Care markets (parent and child markets). The market size in 2025 is estimated at xx million units.
Ventilation Masks Market Dynamics & Structure
The global ventilation masks market is characterized by moderate concentration, with key players holding significant market share. Technological innovation, driven by advancements in materials science and manufacturing processes, is a key growth driver. Stringent regulatory frameworks, particularly concerning safety and efficacy, shape market dynamics. Competitive product substitutes, including alternative respiratory support devices, pose a challenge. The end-user demographics are largely comprised of hospitals, clinics, and home healthcare settings. Mergers and acquisitions (M&A) activity has been relatively moderate in recent years, with xx deals recorded between 2019 and 2024, resulting in a market share shift of approximately xx%.
- Market Concentration: Moderately concentrated, with top 5 players holding xx% market share in 2025.
- Technological Innovation: Focus on lightweight materials, improved comfort, and reusable/disposable options.
- Regulatory Landscape: Stringent safety and efficacy standards, impacting product development and market entry.
- Competitive Substitutes: Alternative respiratory support devices, impacting market growth.
- End-User Demographics: Hospitals (xx million units), Clinics (xx million units), Home Healthcare (xx million units) are the major end-users in 2025.
- M&A Activity: xx deals between 2019-2024, resulting in xx% market share shift. Innovation barriers include high R&D costs and stringent regulatory approvals.
Ventilation Masks Growth Trends & Insights
The ventilation masks market experienced a CAGR of xx% during the historical period (2019-2024), reaching an estimated xx million units in 2025. Adoption rates are influenced by factors such as increasing prevalence of respiratory illnesses, technological advancements leading to improved patient comfort and efficacy, and growing awareness of respiratory health. Technological disruptions, such as the introduction of innovative materials and design features, are driving market expansion. Shifting consumer preferences towards comfortable and effective devices also contribute to market growth. The forecast period (2025-2033) projects continued growth, with a projected CAGR of xx%, driven by factors such as increasing demand in emerging markets and the development of new product variants. Market penetration is expected to reach xx% by 2033.
Dominant Regions, Countries, or Segments in Ventilation Masks
North America currently dominates the ventilation masks market, holding a xx% share in 2025, followed by Europe with xx%. This dominance is primarily attributed to factors such as robust healthcare infrastructure, high healthcare expenditure, and a higher prevalence of respiratory diseases. Strong regulatory frameworks and a high level of technological advancement also contribute to the region's leading position. Asia-Pacific is projected to witness the fastest growth rate during the forecast period, driven by rising healthcare spending, increasing prevalence of chronic respiratory diseases, and expanding healthcare infrastructure.
- Key Drivers in North America: Advanced healthcare infrastructure, high healthcare expenditure, and high prevalence of respiratory diseases.
- Key Drivers in Europe: Established healthcare systems, strong regulatory frameworks, and significant technological advancements.
- Key Drivers in Asia-Pacific: Rising healthcare spending, increasing prevalence of chronic respiratory illnesses, and expanding healthcare infrastructure.
Ventilation Masks Product Landscape
The ventilation mask market encompasses a range of products, including reusable and disposable masks, varying in material composition, design, and features. Innovations focus on improved patient comfort, reduced skin irritation, enhanced seal performance, and easier application. Key performance metrics include leak rate, breathability, and durability. Unique selling propositions often center around superior comfort, ease of use, and improved patient compliance. Technological advancements include the integration of sensors for monitoring patient parameters and the use of innovative materials to enhance performance and hygiene.
Key Drivers, Barriers & Challenges in Ventilation Masks
Key Drivers: The increasing prevalence of chronic respiratory diseases, technological advancements leading to improved comfort and efficacy, and growing awareness of respiratory health are key drivers of market growth. Government initiatives promoting respiratory healthcare and expanding healthcare infrastructure also contribute.
Key Barriers and Challenges: Stringent regulatory hurdles increase the time and cost of product development and market entry. Supply chain disruptions can lead to shortages and price volatility. Intense competition among established and emerging players also poses a challenge, putting pressure on profit margins. Estimated impact of supply chain issues on market growth: xx% in 2025.
Emerging Opportunities in Ventilation Masks
Emerging opportunities lie in the development of smart ventilation masks incorporating sensors for continuous monitoring of respiratory parameters. Untapped markets in developing countries present significant growth potential. Personalized ventilation masks catering to individual patient needs offer another promising area for development. Focus on sustainable and eco-friendly materials addresses growing environmental concerns.
Growth Accelerators in the Ventilation Masks Industry
Technological breakthroughs in materials science and manufacturing processes are key growth accelerators, enabling the development of more comfortable, efficient, and durable masks. Strategic partnerships between device manufacturers and healthcare providers facilitate market penetration and product adoption. Expansion into emerging markets and diversification of product offerings are critical strategies for long-term growth.
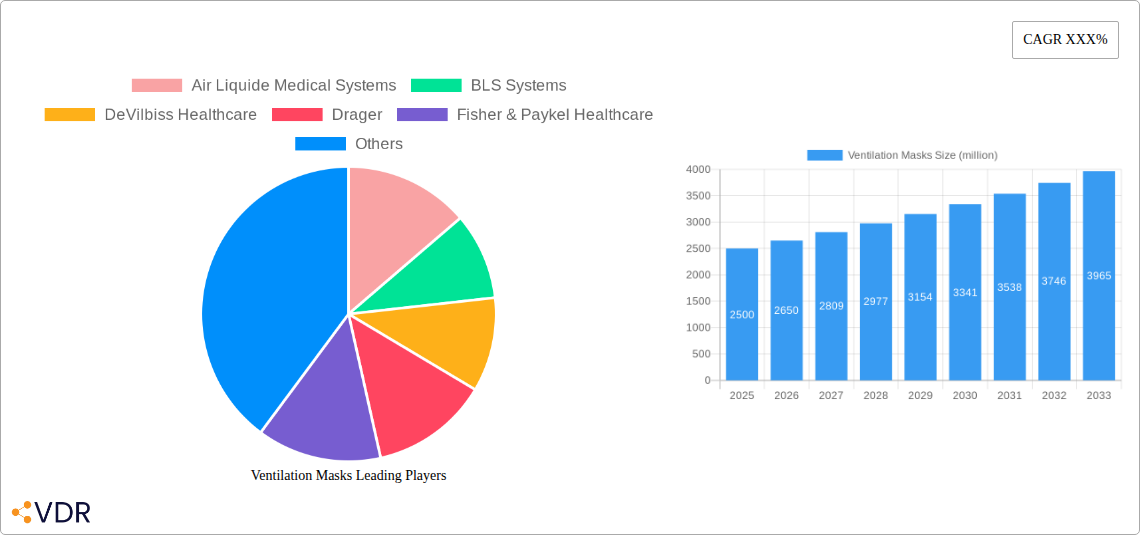
Key Players Shaping the Ventilation Masks Market
- Air Liquide Medical Systems
- BLS Systems
- DeVilbiss Healthcare
- Drager
- Fisher & Paykel Healthcare
- HOFFRICHTER
- Inspiration Healthcare
- medin Medical Innovations
- Philips Healthcare
- ResMed Europe
- Sleepnet
- Viomedex
- Vyaire Medical
Notable Milestones in Ventilation Masks Sector
- 2020: Increased demand due to the COVID-19 pandemic.
- 2021: Several new product launches focusing on improved comfort and hygiene.
- 2022: Significant investment in R&D for advanced sensor integration.
- 2023: Several mergers and acquisitions aimed at expanding market reach.
In-Depth Ventilation Masks Market Outlook
The ventilation masks market is poised for continued growth, driven by technological advancements, increasing prevalence of respiratory diseases, and expansion into emerging markets. Strategic partnerships, product diversification, and a focus on innovation will be key to success in this dynamic sector. The market is expected to reach xx million units by 2033, presenting significant opportunities for both established and emerging players.
Ventilation Masks Segmentation
-
1. Application
- 1.1. Adult
- 1.2. Child
-
2. Type
- 2.1. Intrusive Ventilation Masks
- 2.2. Non-invasive Ventilation Masks
Ventilation Masks Segmentation By Geography
-
1. North America
- 1.1. United States
- 1.2. Canada
- 1.3. Mexico
-
2. South America
- 2.1. Brazil
- 2.2. Argentina
- 2.3. Rest of South America
-
3. Europe
- 3.1. United Kingdom
- 3.2. Germany
- 3.3. France
- 3.4. Italy
- 3.5. Spain
- 3.6. Russia
- 3.7. Benelux
- 3.8. Nordics
- 3.9. Rest of Europe
-
4. Middle East & Africa
- 4.1. Turkey
- 4.2. Israel
- 4.3. GCC
- 4.4. North Africa
- 4.5. South Africa
- 4.6. Rest of Middle East & Africa
-
5. Asia Pacific
- 5.1. China
- 5.2. India
- 5.3. Japan
- 5.4. South Korea
- 5.5. ASEAN
- 5.6. Oceania
- 5.7. Rest of Asia Pacific
Ventilation Masks REPORT HIGHLIGHTS
| Aspects | Details |
|---|---|
| Study Period | 2019-2033 |
| Base Year | 2024 |
| Estimated Year | 2025 |
| Forecast Period | 2025-2033 |
| Historical Period | 2019-2024 |
| Growth Rate | CAGR of XXX% from 2019-2033 |
| Segmentation |
|
Table of Contents
- 1. Introduction
- 1.1. Research Scope
- 1.2. Market Segmentation
- 1.3. Research Methodology
- 1.4. Definitions and Assumptions
- 2. Executive Summary
- 2.1. Introduction
- 3. Market Dynamics
- 3.1. Introduction
- 3.2. Market Drivers
- 3.3. Market Restrains
- 3.4. Market Trends
- 4. Market Factor Analysis
- 4.1. Porters Five Forces
- 4.2. Supply/Value Chain
- 4.3. PESTEL analysis
- 4.4. Market Entropy
- 4.5. Patent/Trademark Analysis
- 5. Global Ventilation Masks Analysis, Insights and Forecast, 2019-2031
- 5.1. Market Analysis, Insights and Forecast - by Application
- 5.1.1. Adult
- 5.1.2. Child
- 5.2. Market Analysis, Insights and Forecast - by Type
- 5.2.1. Intrusive Ventilation Masks
- 5.2.2. Non-invasive Ventilation Masks
- 5.3. Market Analysis, Insights and Forecast - by Region
- 5.3.1. North America
- 5.3.2. South America
- 5.3.3. Europe
- 5.3.4. Middle East & Africa
- 5.3.5. Asia Pacific
- 5.1. Market Analysis, Insights and Forecast - by Application
- 6. North America Ventilation Masks Analysis, Insights and Forecast, 2019-2031
- 6.1. Market Analysis, Insights and Forecast - by Application
- 6.1.1. Adult
- 6.1.2. Child
- 6.2. Market Analysis, Insights and Forecast - by Type
- 6.2.1. Intrusive Ventilation Masks
- 6.2.2. Non-invasive Ventilation Masks
- 6.1. Market Analysis, Insights and Forecast - by Application
- 7. South America Ventilation Masks Analysis, Insights and Forecast, 2019-2031
- 7.1. Market Analysis, Insights and Forecast - by Application
- 7.1.1. Adult
- 7.1.2. Child
- 7.2. Market Analysis, Insights and Forecast - by Type
- 7.2.1. Intrusive Ventilation Masks
- 7.2.2. Non-invasive Ventilation Masks
- 7.1. Market Analysis, Insights and Forecast - by Application
- 8. Europe Ventilation Masks Analysis, Insights and Forecast, 2019-2031
- 8.1. Market Analysis, Insights and Forecast - by Application
- 8.1.1. Adult
- 8.1.2. Child
- 8.2. Market Analysis, Insights and Forecast - by Type
- 8.2.1. Intrusive Ventilation Masks
- 8.2.2. Non-invasive Ventilation Masks
- 8.1. Market Analysis, Insights and Forecast - by Application
- 9. Middle East & Africa Ventilation Masks Analysis, Insights and Forecast, 2019-2031
- 9.1. Market Analysis, Insights and Forecast - by Application
- 9.1.1. Adult
- 9.1.2. Child
- 9.2. Market Analysis, Insights and Forecast - by Type
- 9.2.1. Intrusive Ventilation Masks
- 9.2.2. Non-invasive Ventilation Masks
- 9.1. Market Analysis, Insights and Forecast - by Application
- 10. Asia Pacific Ventilation Masks Analysis, Insights and Forecast, 2019-2031
- 10.1. Market Analysis, Insights and Forecast - by Application
- 10.1.1. Adult
- 10.1.2. Child
- 10.2. Market Analysis, Insights and Forecast - by Type
- 10.2.1. Intrusive Ventilation Masks
- 10.2.2. Non-invasive Ventilation Masks
- 10.1. Market Analysis, Insights and Forecast - by Application
- 11. Competitive Analysis
- 11.1. Global Market Share Analysis 2024
- 11.2. Company Profiles
- 11.2.1 Air Liquide Medical Systems
- 11.2.1.1. Overview
- 11.2.1.2. Products
- 11.2.1.3. SWOT Analysis
- 11.2.1.4. Recent Developments
- 11.2.1.5. Financials (Based on Availability)
- 11.2.2 BLS Systems
- 11.2.2.1. Overview
- 11.2.2.2. Products
- 11.2.2.3. SWOT Analysis
- 11.2.2.4. Recent Developments
- 11.2.2.5. Financials (Based on Availability)
- 11.2.3 DeVilbiss Healthcare
- 11.2.3.1. Overview
- 11.2.3.2. Products
- 11.2.3.3. SWOT Analysis
- 11.2.3.4. Recent Developments
- 11.2.3.5. Financials (Based on Availability)
- 11.2.4 Drager
- 11.2.4.1. Overview
- 11.2.4.2. Products
- 11.2.4.3. SWOT Analysis
- 11.2.4.4. Recent Developments
- 11.2.4.5. Financials (Based on Availability)
- 11.2.5 Fisher & Paykel Healthcare
- 11.2.5.1. Overview
- 11.2.5.2. Products
- 11.2.5.3. SWOT Analysis
- 11.2.5.4. Recent Developments
- 11.2.5.5. Financials (Based on Availability)
- 11.2.6 HOFFRICHTER
- 11.2.6.1. Overview
- 11.2.6.2. Products
- 11.2.6.3. SWOT Analysis
- 11.2.6.4. Recent Developments
- 11.2.6.5. Financials (Based on Availability)
- 11.2.7 Inspiration Healthcare
- 11.2.7.1. Overview
- 11.2.7.2. Products
- 11.2.7.3. SWOT Analysis
- 11.2.7.4. Recent Developments
- 11.2.7.5. Financials (Based on Availability)
- 11.2.8 medin Medical Innovations
- 11.2.8.1. Overview
- 11.2.8.2. Products
- 11.2.8.3. SWOT Analysis
- 11.2.8.4. Recent Developments
- 11.2.8.5. Financials (Based on Availability)
- 11.2.9 Philips Healthcare
- 11.2.9.1. Overview
- 11.2.9.2. Products
- 11.2.9.3. SWOT Analysis
- 11.2.9.4. Recent Developments
- 11.2.9.5. Financials (Based on Availability)
- 11.2.10 ResMed Europe
- 11.2.10.1. Overview
- 11.2.10.2. Products
- 11.2.10.3. SWOT Analysis
- 11.2.10.4. Recent Developments
- 11.2.10.5. Financials (Based on Availability)
- 11.2.11 Sleepnet
- 11.2.11.1. Overview
- 11.2.11.2. Products
- 11.2.11.3. SWOT Analysis
- 11.2.11.4. Recent Developments
- 11.2.11.5. Financials (Based on Availability)
- 11.2.12 Viomedex
- 11.2.12.1. Overview
- 11.2.12.2. Products
- 11.2.12.3. SWOT Analysis
- 11.2.12.4. Recent Developments
- 11.2.12.5. Financials (Based on Availability)
- 11.2.13 Vyaire Medical
- 11.2.13.1. Overview
- 11.2.13.2. Products
- 11.2.13.3. SWOT Analysis
- 11.2.13.4. Recent Developments
- 11.2.13.5. Financials (Based on Availability)
- 11.2.1 Air Liquide Medical Systems
List of Figures
- Figure 1: Global Ventilation Masks Revenue Breakdown (million, %) by Region 2024 & 2032
- Figure 2: Global Ventilation Masks Volume Breakdown (K, %) by Region 2024 & 2032
- Figure 3: North America Ventilation Masks Revenue (million), by Application 2024 & 2032
- Figure 4: North America Ventilation Masks Volume (K), by Application 2024 & 2032
- Figure 5: North America Ventilation Masks Revenue Share (%), by Application 2024 & 2032
- Figure 6: North America Ventilation Masks Volume Share (%), by Application 2024 & 2032
- Figure 7: North America Ventilation Masks Revenue (million), by Type 2024 & 2032
- Figure 8: North America Ventilation Masks Volume (K), by Type 2024 & 2032
- Figure 9: North America Ventilation Masks Revenue Share (%), by Type 2024 & 2032
- Figure 10: North America Ventilation Masks Volume Share (%), by Type 2024 & 2032
- Figure 11: North America Ventilation Masks Revenue (million), by Country 2024 & 2032
- Figure 12: North America Ventilation Masks Volume (K), by Country 2024 & 2032
- Figure 13: North America Ventilation Masks Revenue Share (%), by Country 2024 & 2032
- Figure 14: North America Ventilation Masks Volume Share (%), by Country 2024 & 2032
- Figure 15: South America Ventilation Masks Revenue (million), by Application 2024 & 2032
- Figure 16: South America Ventilation Masks Volume (K), by Application 2024 & 2032
- Figure 17: South America Ventilation Masks Revenue Share (%), by Application 2024 & 2032
- Figure 18: South America Ventilation Masks Volume Share (%), by Application 2024 & 2032
- Figure 19: South America Ventilation Masks Revenue (million), by Type 2024 & 2032
- Figure 20: South America Ventilation Masks Volume (K), by Type 2024 & 2032
- Figure 21: South America Ventilation Masks Revenue Share (%), by Type 2024 & 2032
- Figure 22: South America Ventilation Masks Volume Share (%), by Type 2024 & 2032
- Figure 23: South America Ventilation Masks Revenue (million), by Country 2024 & 2032
- Figure 24: South America Ventilation Masks Volume (K), by Country 2024 & 2032
- Figure 25: South America Ventilation Masks Revenue Share (%), by Country 2024 & 2032
- Figure 26: South America Ventilation Masks Volume Share (%), by Country 2024 & 2032
- Figure 27: Europe Ventilation Masks Revenue (million), by Application 2024 & 2032
- Figure 28: Europe Ventilation Masks Volume (K), by Application 2024 & 2032
- Figure 29: Europe Ventilation Masks Revenue Share (%), by Application 2024 & 2032
- Figure 30: Europe Ventilation Masks Volume Share (%), by Application 2024 & 2032
- Figure 31: Europe Ventilation Masks Revenue (million), by Type 2024 & 2032
- Figure 32: Europe Ventilation Masks Volume (K), by Type 2024 & 2032
- Figure 33: Europe Ventilation Masks Revenue Share (%), by Type 2024 & 2032
- Figure 34: Europe Ventilation Masks Volume Share (%), by Type 2024 & 2032
- Figure 35: Europe Ventilation Masks Revenue (million), by Country 2024 & 2032
- Figure 36: Europe Ventilation Masks Volume (K), by Country 2024 & 2032
- Figure 37: Europe Ventilation Masks Revenue Share (%), by Country 2024 & 2032
- Figure 38: Europe Ventilation Masks Volume Share (%), by Country 2024 & 2032
- Figure 39: Middle East & Africa Ventilation Masks Revenue (million), by Application 2024 & 2032
- Figure 40: Middle East & Africa Ventilation Masks Volume (K), by Application 2024 & 2032
- Figure 41: Middle East & Africa Ventilation Masks Revenue Share (%), by Application 2024 & 2032
- Figure 42: Middle East & Africa Ventilation Masks Volume Share (%), by Application 2024 & 2032
- Figure 43: Middle East & Africa Ventilation Masks Revenue (million), by Type 2024 & 2032
- Figure 44: Middle East & Africa Ventilation Masks Volume (K), by Type 2024 & 2032
- Figure 45: Middle East & Africa Ventilation Masks Revenue Share (%), by Type 2024 & 2032
- Figure 46: Middle East & Africa Ventilation Masks Volume Share (%), by Type 2024 & 2032
- Figure 47: Middle East & Africa Ventilation Masks Revenue (million), by Country 2024 & 2032
- Figure 48: Middle East & Africa Ventilation Masks Volume (K), by Country 2024 & 2032
- Figure 49: Middle East & Africa Ventilation Masks Revenue Share (%), by Country 2024 & 2032
- Figure 50: Middle East & Africa Ventilation Masks Volume Share (%), by Country 2024 & 2032
- Figure 51: Asia Pacific Ventilation Masks Revenue (million), by Application 2024 & 2032
- Figure 52: Asia Pacific Ventilation Masks Volume (K), by Application 2024 & 2032
- Figure 53: Asia Pacific Ventilation Masks Revenue Share (%), by Application 2024 & 2032
- Figure 54: Asia Pacific Ventilation Masks Volume Share (%), by Application 2024 & 2032
- Figure 55: Asia Pacific Ventilation Masks Revenue (million), by Type 2024 & 2032
- Figure 56: Asia Pacific Ventilation Masks Volume (K), by Type 2024 & 2032
- Figure 57: Asia Pacific Ventilation Masks Revenue Share (%), by Type 2024 & 2032
- Figure 58: Asia Pacific Ventilation Masks Volume Share (%), by Type 2024 & 2032
- Figure 59: Asia Pacific Ventilation Masks Revenue (million), by Country 2024 & 2032
- Figure 60: Asia Pacific Ventilation Masks Volume (K), by Country 2024 & 2032
- Figure 61: Asia Pacific Ventilation Masks Revenue Share (%), by Country 2024 & 2032
- Figure 62: Asia Pacific Ventilation Masks Volume Share (%), by Country 2024 & 2032
List of Tables
- Table 1: Global Ventilation Masks Revenue million Forecast, by Region 2019 & 2032
- Table 2: Global Ventilation Masks Volume K Forecast, by Region 2019 & 2032
- Table 3: Global Ventilation Masks Revenue million Forecast, by Application 2019 & 2032
- Table 4: Global Ventilation Masks Volume K Forecast, by Application 2019 & 2032
- Table 5: Global Ventilation Masks Revenue million Forecast, by Type 2019 & 2032
- Table 6: Global Ventilation Masks Volume K Forecast, by Type 2019 & 2032
- Table 7: Global Ventilation Masks Revenue million Forecast, by Region 2019 & 2032
- Table 8: Global Ventilation Masks Volume K Forecast, by Region 2019 & 2032
- Table 9: Global Ventilation Masks Revenue million Forecast, by Application 2019 & 2032
- Table 10: Global Ventilation Masks Volume K Forecast, by Application 2019 & 2032
- Table 11: Global Ventilation Masks Revenue million Forecast, by Type 2019 & 2032
- Table 12: Global Ventilation Masks Volume K Forecast, by Type 2019 & 2032
- Table 13: Global Ventilation Masks Revenue million Forecast, by Country 2019 & 2032
- Table 14: Global Ventilation Masks Volume K Forecast, by Country 2019 & 2032
- Table 15: United States Ventilation Masks Revenue (million) Forecast, by Application 2019 & 2032
- Table 16: United States Ventilation Masks Volume (K) Forecast, by Application 2019 & 2032
- Table 17: Canada Ventilation Masks Revenue (million) Forecast, by Application 2019 & 2032
- Table 18: Canada Ventilation Masks Volume (K) Forecast, by Application 2019 & 2032
- Table 19: Mexico Ventilation Masks Revenue (million) Forecast, by Application 2019 & 2032
- Table 20: Mexico Ventilation Masks Volume (K) Forecast, by Application 2019 & 2032
- Table 21: Global Ventilation Masks Revenue million Forecast, by Application 2019 & 2032
- Table 22: Global Ventilation Masks Volume K Forecast, by Application 2019 & 2032
- Table 23: Global Ventilation Masks Revenue million Forecast, by Type 2019 & 2032
- Table 24: Global Ventilation Masks Volume K Forecast, by Type 2019 & 2032
- Table 25: Global Ventilation Masks Revenue million Forecast, by Country 2019 & 2032
- Table 26: Global Ventilation Masks Volume K Forecast, by Country 2019 & 2032
- Table 27: Brazil Ventilation Masks Revenue (million) Forecast, by Application 2019 & 2032
- Table 28: Brazil Ventilation Masks Volume (K) Forecast, by Application 2019 & 2032
- Table 29: Argentina Ventilation Masks Revenue (million) Forecast, by Application 2019 & 2032
- Table 30: Argentina Ventilation Masks Volume (K) Forecast, by Application 2019 & 2032
- Table 31: Rest of South America Ventilation Masks Revenue (million) Forecast, by Application 2019 & 2032
- Table 32: Rest of South America Ventilation Masks Volume (K) Forecast, by Application 2019 & 2032
- Table 33: Global Ventilation Masks Revenue million Forecast, by Application 2019 & 2032
- Table 34: Global Ventilation Masks Volume K Forecast, by Application 2019 & 2032
- Table 35: Global Ventilation Masks Revenue million Forecast, by Type 2019 & 2032
- Table 36: Global Ventilation Masks Volume K Forecast, by Type 2019 & 2032
- Table 37: Global Ventilation Masks Revenue million Forecast, by Country 2019 & 2032
- Table 38: Global Ventilation Masks Volume K Forecast, by Country 2019 & 2032
- Table 39: United Kingdom Ventilation Masks Revenue (million) Forecast, by Application 2019 & 2032
- Table 40: United Kingdom Ventilation Masks Volume (K) Forecast, by Application 2019 & 2032
- Table 41: Germany Ventilation Masks Revenue (million) Forecast, by Application 2019 & 2032
- Table 42: Germany Ventilation Masks Volume (K) Forecast, by Application 2019 & 2032
- Table 43: France Ventilation Masks Revenue (million) Forecast, by Application 2019 & 2032
- Table 44: France Ventilation Masks Volume (K) Forecast, by Application 2019 & 2032
- Table 45: Italy Ventilation Masks Revenue (million) Forecast, by Application 2019 & 2032
- Table 46: Italy Ventilation Masks Volume (K) Forecast, by Application 2019 & 2032
- Table 47: Spain Ventilation Masks Revenue (million) Forecast, by Application 2019 & 2032
- Table 48: Spain Ventilation Masks Volume (K) Forecast, by Application 2019 & 2032
- Table 49: Russia Ventilation Masks Revenue (million) Forecast, by Application 2019 & 2032
- Table 50: Russia Ventilation Masks Volume (K) Forecast, by Application 2019 & 2032
- Table 51: Benelux Ventilation Masks Revenue (million) Forecast, by Application 2019 & 2032
- Table 52: Benelux Ventilation Masks Volume (K) Forecast, by Application 2019 & 2032
- Table 53: Nordics Ventilation Masks Revenue (million) Forecast, by Application 2019 & 2032
- Table 54: Nordics Ventilation Masks Volume (K) Forecast, by Application 2019 & 2032
- Table 55: Rest of Europe Ventilation Masks Revenue (million) Forecast, by Application 2019 & 2032
- Table 56: Rest of Europe Ventilation Masks Volume (K) Forecast, by Application 2019 & 2032
- Table 57: Global Ventilation Masks Revenue million Forecast, by Application 2019 & 2032
- Table 58: Global Ventilation Masks Volume K Forecast, by Application 2019 & 2032
- Table 59: Global Ventilation Masks Revenue million Forecast, by Type 2019 & 2032
- Table 60: Global Ventilation Masks Volume K Forecast, by Type 2019 & 2032
- Table 61: Global Ventilation Masks Revenue million Forecast, by Country 2019 & 2032
- Table 62: Global Ventilation Masks Volume K Forecast, by Country 2019 & 2032
- Table 63: Turkey Ventilation Masks Revenue (million) Forecast, by Application 2019 & 2032
- Table 64: Turkey Ventilation Masks Volume (K) Forecast, by Application 2019 & 2032
- Table 65: Israel Ventilation Masks Revenue (million) Forecast, by Application 2019 & 2032
- Table 66: Israel Ventilation Masks Volume (K) Forecast, by Application 2019 & 2032
- Table 67: GCC Ventilation Masks Revenue (million) Forecast, by Application 2019 & 2032
- Table 68: GCC Ventilation Masks Volume (K) Forecast, by Application 2019 & 2032
- Table 69: North Africa Ventilation Masks Revenue (million) Forecast, by Application 2019 & 2032
- Table 70: North Africa Ventilation Masks Volume (K) Forecast, by Application 2019 & 2032
- Table 71: South Africa Ventilation Masks Revenue (million) Forecast, by Application 2019 & 2032
- Table 72: South Africa Ventilation Masks Volume (K) Forecast, by Application 2019 & 2032
- Table 73: Rest of Middle East & Africa Ventilation Masks Revenue (million) Forecast, by Application 2019 & 2032
- Table 74: Rest of Middle East & Africa Ventilation Masks Volume (K) Forecast, by Application 2019 & 2032
- Table 75: Global Ventilation Masks Revenue million Forecast, by Application 2019 & 2032
- Table 76: Global Ventilation Masks Volume K Forecast, by Application 2019 & 2032
- Table 77: Global Ventilation Masks Revenue million Forecast, by Type 2019 & 2032
- Table 78: Global Ventilation Masks Volume K Forecast, by Type 2019 & 2032
- Table 79: Global Ventilation Masks Revenue million Forecast, by Country 2019 & 2032
- Table 80: Global Ventilation Masks Volume K Forecast, by Country 2019 & 2032
- Table 81: China Ventilation Masks Revenue (million) Forecast, by Application 2019 & 2032
- Table 82: China Ventilation Masks Volume (K) Forecast, by Application 2019 & 2032
- Table 83: India Ventilation Masks Revenue (million) Forecast, by Application 2019 & 2032
- Table 84: India Ventilation Masks Volume (K) Forecast, by Application 2019 & 2032
- Table 85: Japan Ventilation Masks Revenue (million) Forecast, by Application 2019 & 2032
- Table 86: Japan Ventilation Masks Volume (K) Forecast, by Application 2019 & 2032
- Table 87: South Korea Ventilation Masks Revenue (million) Forecast, by Application 2019 & 2032
- Table 88: South Korea Ventilation Masks Volume (K) Forecast, by Application 2019 & 2032
- Table 89: ASEAN Ventilation Masks Revenue (million) Forecast, by Application 2019 & 2032
- Table 90: ASEAN Ventilation Masks Volume (K) Forecast, by Application 2019 & 2032
- Table 91: Oceania Ventilation Masks Revenue (million) Forecast, by Application 2019 & 2032
- Table 92: Oceania Ventilation Masks Volume (K) Forecast, by Application 2019 & 2032
- Table 93: Rest of Asia Pacific Ventilation Masks Revenue (million) Forecast, by Application 2019 & 2032
- Table 94: Rest of Asia Pacific Ventilation Masks Volume (K) Forecast, by Application 2019 & 2032
Frequently Asked Questions
1. What is the projected Compound Annual Growth Rate (CAGR) of the Ventilation Masks?
The projected CAGR is approximately XXX%.
2. Which companies are prominent players in the Ventilation Masks?
Key companies in the market include Air Liquide Medical Systems, BLS Systems, DeVilbiss Healthcare, Drager, Fisher & Paykel Healthcare, HOFFRICHTER, Inspiration Healthcare, medin Medical Innovations, Philips Healthcare, ResMed Europe, Sleepnet, Viomedex, Vyaire Medical.
3. What are the main segments of the Ventilation Masks?
The market segments include Application, Type.
4. Can you provide details about the market size?
The market size is estimated to be USD XXX million as of 2022.
5. What are some drivers contributing to market growth?
N/A
6. What are the notable trends driving market growth?
N/A
7. Are there any restraints impacting market growth?
N/A
8. Can you provide examples of recent developments in the market?
N/A
9. What pricing options are available for accessing the report?
Pricing options include single-user, multi-user, and enterprise licenses priced at USD 3950.00, USD 5925.00, and USD 7900.00 respectively.
10. Is the market size provided in terms of value or volume?
The market size is provided in terms of value, measured in million and volume, measured in K.
11. Are there any specific market keywords associated with the report?
Yes, the market keyword associated with the report is "Ventilation Masks," which aids in identifying and referencing the specific market segment covered.
12. How do I determine which pricing option suits my needs best?
The pricing options vary based on user requirements and access needs. Individual users may opt for single-user licenses, while businesses requiring broader access may choose multi-user or enterprise licenses for cost-effective access to the report.
13. Are there any additional resources or data provided in the Ventilation Masks report?
While the report offers comprehensive insights, it's advisable to review the specific contents or supplementary materials provided to ascertain if additional resources or data are available.
14. How can I stay updated on further developments or reports in the Ventilation Masks?
To stay informed about further developments, trends, and reports in the Ventilation Masks, consider subscribing to industry newsletters, following relevant companies and organizations, or regularly checking reputable industry news sources and publications.
Methodology
Step 1 - Identification of Relevant Samples Size from Population Database


Step 2 - Approaches for Defining Global Market Size (Value, Volume* & Price*)

Note*: In applicable scenarios
Step 3 - Data Sources
Primary Research
- Web Analytics
- Survey Reports
- Research Institute
- Latest Research Reports
- Opinion Leaders
Secondary Research
- Annual Reports
- White Paper
- Latest Press Release
- Industry Association
- Paid Database
- Investor Presentations

Step 4 - Data Triangulation
Involves using different sources of information in order to increase the validity of a study
These sources are likely to be stakeholders in a program - participants, other researchers, program staff, other community members, and so on.
Then we put all data in single framework & apply various statistical tools to find out the dynamic on the market.
During the analysis stage, feedback from the stakeholder groups would be compared to determine areas of agreement as well as areas of divergence


