
Key Insights
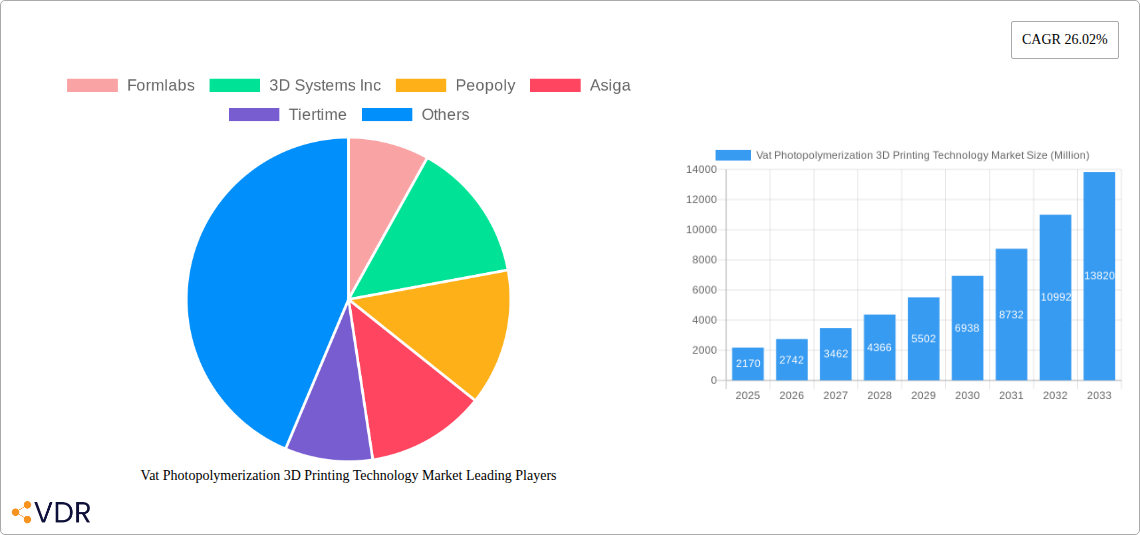
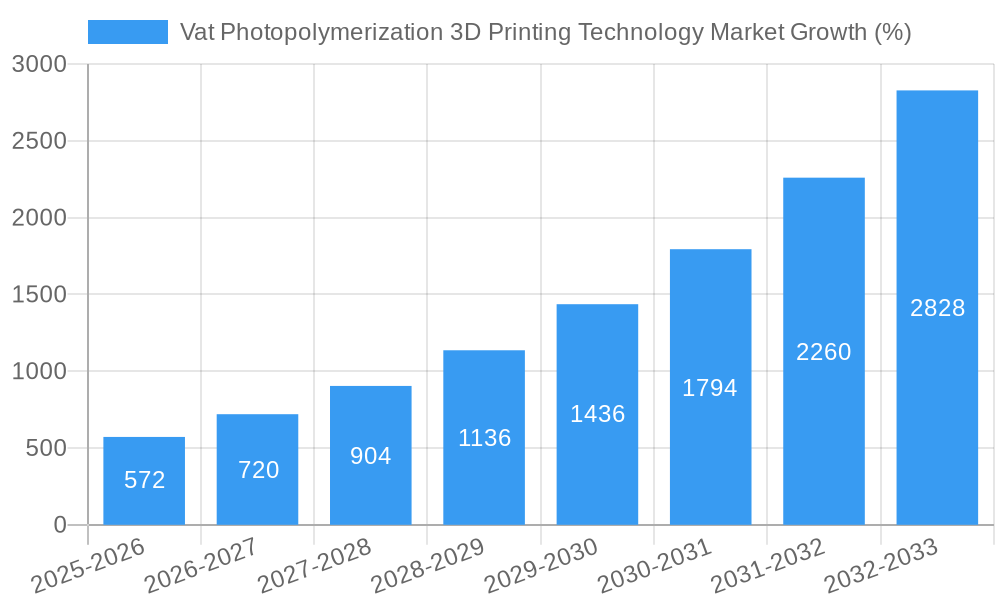
The Vat Photopolymerization 3D printing technology market is experiencing robust growth, projected to reach \$2.17 billion in 2025 and exhibiting a Compound Annual Growth Rate (CAGR) of 26.02%. This significant expansion is driven by several key factors. The increasing demand for high-precision, detail-rich parts across diverse industries like healthcare (dental models, surgical guides), jewelry, and prototyping fuels market expansion. Advancements in resin formulations, leading to improved material properties and functionalities like biocompatibility and increased durability, further stimulate growth. Furthermore, the decreasing cost of equipment and resins makes this technology more accessible to a broader range of users, from small businesses to large corporations, driving market penetration. The growing adoption of digital dentistry and the increasing need for personalized medical devices are particularly significant growth catalysts. Competition among leading players like Formlabs, 3D Systems, and Asiga, along with the emergence of innovative startups, fosters market dynamism and technological advancements.
However, despite the positive outlook, certain restraints exist. The relatively high initial investment for some high-end systems may limit entry for smaller players. The need for specialized expertise to operate and maintain the equipment could also pose a barrier. Furthermore, potential health and safety concerns related to resin handling and curing require attention, impacting wider adoption. Nevertheless, ongoing innovation in resin safety protocols and user-friendly software solutions are mitigating these challenges. The market's future trajectory appears promising, driven by the continuous evolution of the technology and its increasing integration across diverse applications. The projected growth underscores a strong investment opportunity within this rapidly evolving segment of the additive manufacturing industry.
Vat Photopolymerization 3D Printing Technology Market: A Comprehensive Report (2019-2033)
This in-depth report provides a comprehensive analysis of the Vat Photopolymerization 3D Printing Technology market, encompassing market dynamics, growth trends, regional analysis, product landscape, key players, and future outlook. The study period covers 2019-2033, with 2025 as the base year and forecast period extending to 2033. The report utilizes data from the historical period (2019-2024) to project future market trends. This report is invaluable for industry professionals, investors, and anyone seeking a deep understanding of this rapidly evolving sector. The parent market is 3D Printing and the child market is Vat Photopolymerization 3D Printing.
Vat Photopolymerization 3D Printing Technology Market Market Dynamics & Structure
The Vat Photopolymerization 3D printing market is characterized by moderate concentration, with several key players holding significant market share. However, the market is also witnessing increased competition from new entrants and technological advancements driving innovation. Regulatory frameworks, particularly those concerning material safety and environmental impact, are increasingly influential. The market experiences competition from other additive manufacturing technologies like Fused Deposition Modeling (FDM) and Selective Laser Melting (SLM), though Vat Photopolymerization's precision and material versatility offer significant advantages.
- Market Concentration: xx% market share held by top 5 players in 2024. (Estimate).
- Technological Innovation Drivers: Advancements in resin formulations, light sources, and build platforms are pushing the boundaries of resolution, speed, and material properties.
- Regulatory Frameworks: Growing emphasis on material safety standards and environmental regulations is shaping industry practices.
- Competitive Product Substitutes: FDM and SLM technologies present alternatives, but Vat Photopolymerization maintains an edge in certain applications due to higher resolution and detail.
- End-User Demographics: Key end-users span diverse industries, including healthcare, manufacturing, jewelry, and aerospace.
- M&A Trends: xx M&A deals recorded in the past 5 years, indicating consolidation and strategic growth within the sector (Estimate). Smaller players are increasingly acquired by larger firms.
Vat Photopolymerization 3D Printing Technology Market Growth Trends & Insights
The Vat Photopolymerization 3D printing market exhibits a robust growth trajectory, driven by increasing demand across various sectors. Market size experienced significant expansion during the historical period (2019-2024), with a compound annual growth rate (CAGR) of xx%. This growth is fueled by the technology's precision, scalability, and versatility, particularly in applications demanding high detail and complex geometries. Adoption rates are increasing steadily across various industries, particularly healthcare and manufacturing, where the benefits of rapid prototyping and customized production are highly valued. Technological disruptions, such as the development of higher-resolution printers and novel resin materials, are further accelerating market growth. Shifts in consumer behavior, including growing awareness of personalized products and on-demand manufacturing, contribute significantly to market expansion. Market penetration in key sectors is projected to increase from xx% in 2024 to xx% by 2033.
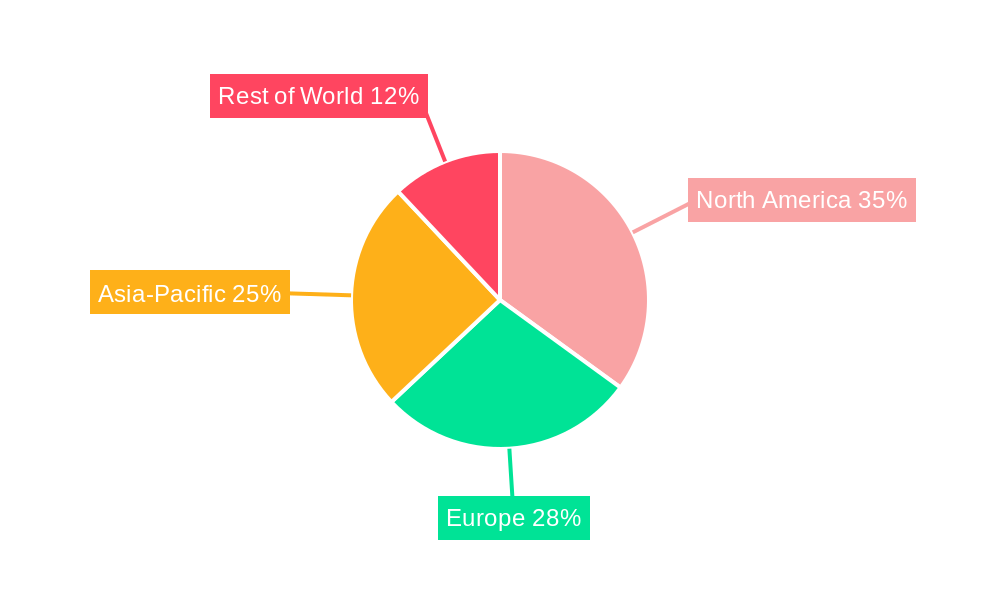
Dominant Regions, Countries, or Segments in Vat Photopolymerization 3D Printing Technology Market
North America currently holds the largest market share, driven by strong technological advancements, high adoption rates in key industries, and robust investment in research and development. However, the Asia-Pacific region is experiencing rapid growth, fueled by expanding manufacturing sectors and increasing government support for technological innovation. Europe is also a significant market with strong presence in specialized applications such as medical devices and jewelry.
- Key Drivers in North America: Strong R&D investment, early adoption by various industries.
- Key Drivers in Asia-Pacific: Growing manufacturing base, increasing government support for technological advancement.
- Key Drivers in Europe: High demand in specialized sectors, robust regulatory frameworks.
- Market Share: North America (xx%), Asia-Pacific (xx%), Europe (xx%) (Estimate).
- Growth Potential: Asia-Pacific region shows the highest growth potential due to its expanding manufacturing and technology sectors.
Vat Photopolymerization 3D Printing Technology Market Product Landscape
Vat Photopolymerization 3D printers offer a range of capabilities, including high-resolution printing, precise detail reproduction, and compatibility with a diverse array of photopolymer resins. Product innovations are focused on improving print speed, build volume, and material properties. Applications span prototyping, manufacturing, healthcare (dental models, hearing aids), jewelry, and more. Key performance metrics include build speed, resolution, accuracy, and material versatility. Unique selling propositions often focus on ease of use, speed, and cost-effectiveness for specific applications.
Key Drivers, Barriers & Challenges in Vat Photopolymerization 3D Printing Technology Market
Key Drivers:
- Technological advancements in resin materials and light sources.
- Increasing demand for customized products across various industries.
- Government initiatives promoting additive manufacturing adoption.
Key Challenges:
- High initial investment costs for advanced equipment can be a barrier to entry for smaller companies.
- Potential material toxicity and environmental concerns require careful management and compliance.
- Intense competition from other 3D printing technologies requires continuous innovation to maintain a competitive edge.
Emerging Opportunities in Vat Photopolymerization 3D Printing Technology Market
- Expansion into new applications, such as personalized medicine and bioprinting.
- Development of biocompatible resins for medical applications.
- Increased focus on sustainable and environmentally friendly resin materials.
Growth Accelerators in the Vat Photopolymerization 3D Printing Technology Market Industry
Strategic partnerships between resin manufacturers and printer manufacturers are accelerating growth by optimizing material compatibility and performance. Technological breakthroughs in light sources and build platforms are enhancing print speed and resolution. Market expansion into new sectors, such as mass customization and personalized product manufacturing, further contributes to rapid growth.
Key Players Shaping the Vat Photopolymerization 3D Printing Technology Market Market
- Formlabs
- 3D Systems Inc
- Peopoly
- Asiga
- Tiertime
- Tasly Holding Group
- UnionTech
- Zortrax
- Rayshape
Notable Milestones in Vat Photopolymerization 3D Printing Technology Market Sector
- March 2024: Sprybuild launches an SLA 3D printer with a patented continuous build process, expanding applications in healthcare and beyond.
- February 2024: SHINING 3D launches AccuFab-CEL, a dental 3D printer, highlighting the increasing adoption of Vat Photopolymerization in dental labs.
In-Depth Vat Photopolymerization 3D Printing Technology Market Market Outlook
The Vat Photopolymerization 3D printing market is poised for sustained growth driven by ongoing technological advancements, expanding applications, and increasing industry adoption. Strategic investments in R&D, focused on improving speed, resolution, and material versatility, are key to unlocking future market potential. The expanding healthcare and manufacturing sectors offer significant opportunities for growth. Companies focusing on innovative applications and sustainable practices will be well-positioned to capture market share.
Vat Photopolymerization 3D Printing Technology Market Segmentation
-
1. Component
- 1.1. Hardware
- 1.2. Software
- 1.3. Services
- 1.4. Materials
-
2. Technology
- 2.1. Stereolithography (SLA)
- 2.2. Digital Light Processing (DLP)
- 2.3. Continuous Digital Light Processing (CDLP)
-
3. Application
- 3.1. Dentistry
- 3.2. Orthopedics
- 3.3. Tissue Engineering
- 3.4. Other Ap
Vat Photopolymerization 3D Printing Technology Market Segmentation By Geography
-
1. North America
- 1.1. United States
- 1.2. Canada
- 1.3. Mexico
-
2. Europe
- 2.1. Germany
- 2.2. United Kingdom
- 2.3. France
- 2.4. Italy
- 2.5. Spain
- 2.6. Rest of Europe
-
3. Asia Pacific
- 3.1. China
- 3.2. Japan
- 3.3. India
- 3.4. Australia
- 3.5. South Korea
- 3.6. Rest of Asia Pacific
-
4. Middle East and Africa
- 4.1. GCC
- 4.2. South Africa
- 4.3. Rest of Middle East and Africa
-
5. South America
- 5.1. Brazil
- 5.2. Argentina
- 5.3. Rest of South America
Vat Photopolymerization 3D Printing Technology Market REPORT HIGHLIGHTS
| Aspects | Details |
|---|---|
| Study Period | 2019-2033 |
| Base Year | 2024 |
| Estimated Year | 2025 |
| Forecast Period | 2025-2033 |
| Historical Period | 2019-2024 |
| Growth Rate | CAGR of 26.02% from 2019-2033 |
| Segmentation |
|
Table of Contents
- 1. Introduction
- 1.1. Research Scope
- 1.2. Market Segmentation
- 1.3. Research Methodology
- 1.4. Definitions and Assumptions
- 2. Executive Summary
- 2.1. Introduction
- 3. Market Dynamics
- 3.1. Introduction
- 3.2. Market Drivers
- 3.2.1. Rising Demand for Minimally Invasive Procedures; Growing Technological Advancements
- 3.3. Market Restrains
- 3.3.1. Rising Demand for Minimally Invasive Procedures; Growing Technological Advancements
- 3.4. Market Trends
- 3.4.1. Orthopedics Segment Expected to Hold a Significant Market Share Over the Forecast Period
- 4. Market Factor Analysis
- 4.1. Porters Five Forces
- 4.2. Supply/Value Chain
- 4.3. PESTEL analysis
- 4.4. Market Entropy
- 4.5. Patent/Trademark Analysis
- 5. Global Vat Photopolymerization 3D Printing Technology Market Analysis, Insights and Forecast, 2019-2031
- 5.1. Market Analysis, Insights and Forecast - by Component
- 5.1.1. Hardware
- 5.1.2. Software
- 5.1.3. Services
- 5.1.4. Materials
- 5.2. Market Analysis, Insights and Forecast - by Technology
- 5.2.1. Stereolithography (SLA)
- 5.2.2. Digital Light Processing (DLP)
- 5.2.3. Continuous Digital Light Processing (CDLP)
- 5.3. Market Analysis, Insights and Forecast - by Application
- 5.3.1. Dentistry
- 5.3.2. Orthopedics
- 5.3.3. Tissue Engineering
- 5.3.4. Other Ap
- 5.4. Market Analysis, Insights and Forecast - by Region
- 5.4.1. North America
- 5.4.2. Europe
- 5.4.3. Asia Pacific
- 5.4.4. Middle East and Africa
- 5.4.5. South America
- 5.1. Market Analysis, Insights and Forecast - by Component
- 6. North America Vat Photopolymerization 3D Printing Technology Market Analysis, Insights and Forecast, 2019-2031
- 6.1. Market Analysis, Insights and Forecast - by Component
- 6.1.1. Hardware
- 6.1.2. Software
- 6.1.3. Services
- 6.1.4. Materials
- 6.2. Market Analysis, Insights and Forecast - by Technology
- 6.2.1. Stereolithography (SLA)
- 6.2.2. Digital Light Processing (DLP)
- 6.2.3. Continuous Digital Light Processing (CDLP)
- 6.3. Market Analysis, Insights and Forecast - by Application
- 6.3.1. Dentistry
- 6.3.2. Orthopedics
- 6.3.3. Tissue Engineering
- 6.3.4. Other Ap
- 6.1. Market Analysis, Insights and Forecast - by Component
- 7. Europe Vat Photopolymerization 3D Printing Technology Market Analysis, Insights and Forecast, 2019-2031
- 7.1. Market Analysis, Insights and Forecast - by Component
- 7.1.1. Hardware
- 7.1.2. Software
- 7.1.3. Services
- 7.1.4. Materials
- 7.2. Market Analysis, Insights and Forecast - by Technology
- 7.2.1. Stereolithography (SLA)
- 7.2.2. Digital Light Processing (DLP)
- 7.2.3. Continuous Digital Light Processing (CDLP)
- 7.3. Market Analysis, Insights and Forecast - by Application
- 7.3.1. Dentistry
- 7.3.2. Orthopedics
- 7.3.3. Tissue Engineering
- 7.3.4. Other Ap
- 7.1. Market Analysis, Insights and Forecast - by Component
- 8. Asia Pacific Vat Photopolymerization 3D Printing Technology Market Analysis, Insights and Forecast, 2019-2031
- 8.1. Market Analysis, Insights and Forecast - by Component
- 8.1.1. Hardware
- 8.1.2. Software
- 8.1.3. Services
- 8.1.4. Materials
- 8.2. Market Analysis, Insights and Forecast - by Technology
- 8.2.1. Stereolithography (SLA)
- 8.2.2. Digital Light Processing (DLP)
- 8.2.3. Continuous Digital Light Processing (CDLP)
- 8.3. Market Analysis, Insights and Forecast - by Application
- 8.3.1. Dentistry
- 8.3.2. Orthopedics
- 8.3.3. Tissue Engineering
- 8.3.4. Other Ap
- 8.1. Market Analysis, Insights and Forecast - by Component
- 9. Middle East and Africa Vat Photopolymerization 3D Printing Technology Market Analysis, Insights and Forecast, 2019-2031
- 9.1. Market Analysis, Insights and Forecast - by Component
- 9.1.1. Hardware
- 9.1.2. Software
- 9.1.3. Services
- 9.1.4. Materials
- 9.2. Market Analysis, Insights and Forecast - by Technology
- 9.2.1. Stereolithography (SLA)
- 9.2.2. Digital Light Processing (DLP)
- 9.2.3. Continuous Digital Light Processing (CDLP)
- 9.3. Market Analysis, Insights and Forecast - by Application
- 9.3.1. Dentistry
- 9.3.2. Orthopedics
- 9.3.3. Tissue Engineering
- 9.3.4. Other Ap
- 9.1. Market Analysis, Insights and Forecast - by Component
- 10. South America Vat Photopolymerization 3D Printing Technology Market Analysis, Insights and Forecast, 2019-2031
- 10.1. Market Analysis, Insights and Forecast - by Component
- 10.1.1. Hardware
- 10.1.2. Software
- 10.1.3. Services
- 10.1.4. Materials
- 10.2. Market Analysis, Insights and Forecast - by Technology
- 10.2.1. Stereolithography (SLA)
- 10.2.2. Digital Light Processing (DLP)
- 10.2.3. Continuous Digital Light Processing (CDLP)
- 10.3. Market Analysis, Insights and Forecast - by Application
- 10.3.1. Dentistry
- 10.3.2. Orthopedics
- 10.3.3. Tissue Engineering
- 10.3.4. Other Ap
- 10.1. Market Analysis, Insights and Forecast - by Component
- 11. Competitive Analysis
- 11.1. Global Market Share Analysis 2024
- 11.2. Company Profiles
- 11.2.1 Formlabs
- 11.2.1.1. Overview
- 11.2.1.2. Products
- 11.2.1.3. SWOT Analysis
- 11.2.1.4. Recent Developments
- 11.2.1.5. Financials (Based on Availability)
- 11.2.2 3D Systems Inc
- 11.2.2.1. Overview
- 11.2.2.2. Products
- 11.2.2.3. SWOT Analysis
- 11.2.2.4. Recent Developments
- 11.2.2.5. Financials (Based on Availability)
- 11.2.3 Peopoly
- 11.2.3.1. Overview
- 11.2.3.2. Products
- 11.2.3.3. SWOT Analysis
- 11.2.3.4. Recent Developments
- 11.2.3.5. Financials (Based on Availability)
- 11.2.4 Asiga
- 11.2.4.1. Overview
- 11.2.4.2. Products
- 11.2.4.3. SWOT Analysis
- 11.2.4.4. Recent Developments
- 11.2.4.5. Financials (Based on Availability)
- 11.2.5 Tiertime
- 11.2.5.1. Overview
- 11.2.5.2. Products
- 11.2.5.3. SWOT Analysis
- 11.2.5.4. Recent Developments
- 11.2.5.5. Financials (Based on Availability)
- 11.2.6 Tasly Holding Group
- 11.2.6.1. Overview
- 11.2.6.2. Products
- 11.2.6.3. SWOT Analysis
- 11.2.6.4. Recent Developments
- 11.2.6.5. Financials (Based on Availability)
- 11.2.7 UnionTech
- 11.2.7.1. Overview
- 11.2.7.2. Products
- 11.2.7.3. SWOT Analysis
- 11.2.7.4. Recent Developments
- 11.2.7.5. Financials (Based on Availability)
- 11.2.8 Zortrax
- 11.2.8.1. Overview
- 11.2.8.2. Products
- 11.2.8.3. SWOT Analysis
- 11.2.8.4. Recent Developments
- 11.2.8.5. Financials (Based on Availability)
- 11.2.9 Rayshape*List Not Exhaustive
- 11.2.9.1. Overview
- 11.2.9.2. Products
- 11.2.9.3. SWOT Analysis
- 11.2.9.4. Recent Developments
- 11.2.9.5. Financials (Based on Availability)
- 11.2.1 Formlabs
List of Figures
- Figure 1: Global Vat Photopolymerization 3D Printing Technology Market Revenue Breakdown (Million, %) by Region 2024 & 2032
- Figure 2: Global Vat Photopolymerization 3D Printing Technology Market Volume Breakdown (Billion, %) by Region 2024 & 2032
- Figure 3: North America Vat Photopolymerization 3D Printing Technology Market Revenue (Million), by Component 2024 & 2032
- Figure 4: North America Vat Photopolymerization 3D Printing Technology Market Volume (Billion), by Component 2024 & 2032
- Figure 5: North America Vat Photopolymerization 3D Printing Technology Market Revenue Share (%), by Component 2024 & 2032
- Figure 6: North America Vat Photopolymerization 3D Printing Technology Market Volume Share (%), by Component 2024 & 2032
- Figure 7: North America Vat Photopolymerization 3D Printing Technology Market Revenue (Million), by Technology 2024 & 2032
- Figure 8: North America Vat Photopolymerization 3D Printing Technology Market Volume (Billion), by Technology 2024 & 2032
- Figure 9: North America Vat Photopolymerization 3D Printing Technology Market Revenue Share (%), by Technology 2024 & 2032
- Figure 10: North America Vat Photopolymerization 3D Printing Technology Market Volume Share (%), by Technology 2024 & 2032
- Figure 11: North America Vat Photopolymerization 3D Printing Technology Market Revenue (Million), by Application 2024 & 2032
- Figure 12: North America Vat Photopolymerization 3D Printing Technology Market Volume (Billion), by Application 2024 & 2032
- Figure 13: North America Vat Photopolymerization 3D Printing Technology Market Revenue Share (%), by Application 2024 & 2032
- Figure 14: North America Vat Photopolymerization 3D Printing Technology Market Volume Share (%), by Application 2024 & 2032
- Figure 15: North America Vat Photopolymerization 3D Printing Technology Market Revenue (Million), by Country 2024 & 2032
- Figure 16: North America Vat Photopolymerization 3D Printing Technology Market Volume (Billion), by Country 2024 & 2032
- Figure 17: North America Vat Photopolymerization 3D Printing Technology Market Revenue Share (%), by Country 2024 & 2032
- Figure 18: North America Vat Photopolymerization 3D Printing Technology Market Volume Share (%), by Country 2024 & 2032
- Figure 19: Europe Vat Photopolymerization 3D Printing Technology Market Revenue (Million), by Component 2024 & 2032
- Figure 20: Europe Vat Photopolymerization 3D Printing Technology Market Volume (Billion), by Component 2024 & 2032
- Figure 21: Europe Vat Photopolymerization 3D Printing Technology Market Revenue Share (%), by Component 2024 & 2032
- Figure 22: Europe Vat Photopolymerization 3D Printing Technology Market Volume Share (%), by Component 2024 & 2032
- Figure 23: Europe Vat Photopolymerization 3D Printing Technology Market Revenue (Million), by Technology 2024 & 2032
- Figure 24: Europe Vat Photopolymerization 3D Printing Technology Market Volume (Billion), by Technology 2024 & 2032
- Figure 25: Europe Vat Photopolymerization 3D Printing Technology Market Revenue Share (%), by Technology 2024 & 2032
- Figure 26: Europe Vat Photopolymerization 3D Printing Technology Market Volume Share (%), by Technology 2024 & 2032
- Figure 27: Europe Vat Photopolymerization 3D Printing Technology Market Revenue (Million), by Application 2024 & 2032
- Figure 28: Europe Vat Photopolymerization 3D Printing Technology Market Volume (Billion), by Application 2024 & 2032
- Figure 29: Europe Vat Photopolymerization 3D Printing Technology Market Revenue Share (%), by Application 2024 & 2032
- Figure 30: Europe Vat Photopolymerization 3D Printing Technology Market Volume Share (%), by Application 2024 & 2032
- Figure 31: Europe Vat Photopolymerization 3D Printing Technology Market Revenue (Million), by Country 2024 & 2032
- Figure 32: Europe Vat Photopolymerization 3D Printing Technology Market Volume (Billion), by Country 2024 & 2032
- Figure 33: Europe Vat Photopolymerization 3D Printing Technology Market Revenue Share (%), by Country 2024 & 2032
- Figure 34: Europe Vat Photopolymerization 3D Printing Technology Market Volume Share (%), by Country 2024 & 2032
- Figure 35: Asia Pacific Vat Photopolymerization 3D Printing Technology Market Revenue (Million), by Component 2024 & 2032
- Figure 36: Asia Pacific Vat Photopolymerization 3D Printing Technology Market Volume (Billion), by Component 2024 & 2032
- Figure 37: Asia Pacific Vat Photopolymerization 3D Printing Technology Market Revenue Share (%), by Component 2024 & 2032
- Figure 38: Asia Pacific Vat Photopolymerization 3D Printing Technology Market Volume Share (%), by Component 2024 & 2032
- Figure 39: Asia Pacific Vat Photopolymerization 3D Printing Technology Market Revenue (Million), by Technology 2024 & 2032
- Figure 40: Asia Pacific Vat Photopolymerization 3D Printing Technology Market Volume (Billion), by Technology 2024 & 2032
- Figure 41: Asia Pacific Vat Photopolymerization 3D Printing Technology Market Revenue Share (%), by Technology 2024 & 2032
- Figure 42: Asia Pacific Vat Photopolymerization 3D Printing Technology Market Volume Share (%), by Technology 2024 & 2032
- Figure 43: Asia Pacific Vat Photopolymerization 3D Printing Technology Market Revenue (Million), by Application 2024 & 2032
- Figure 44: Asia Pacific Vat Photopolymerization 3D Printing Technology Market Volume (Billion), by Application 2024 & 2032
- Figure 45: Asia Pacific Vat Photopolymerization 3D Printing Technology Market Revenue Share (%), by Application 2024 & 2032
- Figure 46: Asia Pacific Vat Photopolymerization 3D Printing Technology Market Volume Share (%), by Application 2024 & 2032
- Figure 47: Asia Pacific Vat Photopolymerization 3D Printing Technology Market Revenue (Million), by Country 2024 & 2032
- Figure 48: Asia Pacific Vat Photopolymerization 3D Printing Technology Market Volume (Billion), by Country 2024 & 2032
- Figure 49: Asia Pacific Vat Photopolymerization 3D Printing Technology Market Revenue Share (%), by Country 2024 & 2032
- Figure 50: Asia Pacific Vat Photopolymerization 3D Printing Technology Market Volume Share (%), by Country 2024 & 2032
- Figure 51: Middle East and Africa Vat Photopolymerization 3D Printing Technology Market Revenue (Million), by Component 2024 & 2032
- Figure 52: Middle East and Africa Vat Photopolymerization 3D Printing Technology Market Volume (Billion), by Component 2024 & 2032
- Figure 53: Middle East and Africa Vat Photopolymerization 3D Printing Technology Market Revenue Share (%), by Component 2024 & 2032
- Figure 54: Middle East and Africa Vat Photopolymerization 3D Printing Technology Market Volume Share (%), by Component 2024 & 2032
- Figure 55: Middle East and Africa Vat Photopolymerization 3D Printing Technology Market Revenue (Million), by Technology 2024 & 2032
- Figure 56: Middle East and Africa Vat Photopolymerization 3D Printing Technology Market Volume (Billion), by Technology 2024 & 2032
- Figure 57: Middle East and Africa Vat Photopolymerization 3D Printing Technology Market Revenue Share (%), by Technology 2024 & 2032
- Figure 58: Middle East and Africa Vat Photopolymerization 3D Printing Technology Market Volume Share (%), by Technology 2024 & 2032
- Figure 59: Middle East and Africa Vat Photopolymerization 3D Printing Technology Market Revenue (Million), by Application 2024 & 2032
- Figure 60: Middle East and Africa Vat Photopolymerization 3D Printing Technology Market Volume (Billion), by Application 2024 & 2032
- Figure 61: Middle East and Africa Vat Photopolymerization 3D Printing Technology Market Revenue Share (%), by Application 2024 & 2032
- Figure 62: Middle East and Africa Vat Photopolymerization 3D Printing Technology Market Volume Share (%), by Application 2024 & 2032
- Figure 63: Middle East and Africa Vat Photopolymerization 3D Printing Technology Market Revenue (Million), by Country 2024 & 2032
- Figure 64: Middle East and Africa Vat Photopolymerization 3D Printing Technology Market Volume (Billion), by Country 2024 & 2032
- Figure 65: Middle East and Africa Vat Photopolymerization 3D Printing Technology Market Revenue Share (%), by Country 2024 & 2032
- Figure 66: Middle East and Africa Vat Photopolymerization 3D Printing Technology Market Volume Share (%), by Country 2024 & 2032
- Figure 67: South America Vat Photopolymerization 3D Printing Technology Market Revenue (Million), by Component 2024 & 2032
- Figure 68: South America Vat Photopolymerization 3D Printing Technology Market Volume (Billion), by Component 2024 & 2032
- Figure 69: South America Vat Photopolymerization 3D Printing Technology Market Revenue Share (%), by Component 2024 & 2032
- Figure 70: South America Vat Photopolymerization 3D Printing Technology Market Volume Share (%), by Component 2024 & 2032
- Figure 71: South America Vat Photopolymerization 3D Printing Technology Market Revenue (Million), by Technology 2024 & 2032
- Figure 72: South America Vat Photopolymerization 3D Printing Technology Market Volume (Billion), by Technology 2024 & 2032
- Figure 73: South America Vat Photopolymerization 3D Printing Technology Market Revenue Share (%), by Technology 2024 & 2032
- Figure 74: South America Vat Photopolymerization 3D Printing Technology Market Volume Share (%), by Technology 2024 & 2032
- Figure 75: South America Vat Photopolymerization 3D Printing Technology Market Revenue (Million), by Application 2024 & 2032
- Figure 76: South America Vat Photopolymerization 3D Printing Technology Market Volume (Billion), by Application 2024 & 2032
- Figure 77: South America Vat Photopolymerization 3D Printing Technology Market Revenue Share (%), by Application 2024 & 2032
- Figure 78: South America Vat Photopolymerization 3D Printing Technology Market Volume Share (%), by Application 2024 & 2032
- Figure 79: South America Vat Photopolymerization 3D Printing Technology Market Revenue (Million), by Country 2024 & 2032
- Figure 80: South America Vat Photopolymerization 3D Printing Technology Market Volume (Billion), by Country 2024 & 2032
- Figure 81: South America Vat Photopolymerization 3D Printing Technology Market Revenue Share (%), by Country 2024 & 2032
- Figure 82: South America Vat Photopolymerization 3D Printing Technology Market Volume Share (%), by Country 2024 & 2032
List of Tables
- Table 1: Global Vat Photopolymerization 3D Printing Technology Market Revenue Million Forecast, by Region 2019 & 2032
- Table 2: Global Vat Photopolymerization 3D Printing Technology Market Volume Billion Forecast, by Region 2019 & 2032
- Table 3: Global Vat Photopolymerization 3D Printing Technology Market Revenue Million Forecast, by Component 2019 & 2032
- Table 4: Global Vat Photopolymerization 3D Printing Technology Market Volume Billion Forecast, by Component 2019 & 2032
- Table 5: Global Vat Photopolymerization 3D Printing Technology Market Revenue Million Forecast, by Technology 2019 & 2032
- Table 6: Global Vat Photopolymerization 3D Printing Technology Market Volume Billion Forecast, by Technology 2019 & 2032
- Table 7: Global Vat Photopolymerization 3D Printing Technology Market Revenue Million Forecast, by Application 2019 & 2032
- Table 8: Global Vat Photopolymerization 3D Printing Technology Market Volume Billion Forecast, by Application 2019 & 2032
- Table 9: Global Vat Photopolymerization 3D Printing Technology Market Revenue Million Forecast, by Region 2019 & 2032
- Table 10: Global Vat Photopolymerization 3D Printing Technology Market Volume Billion Forecast, by Region 2019 & 2032
- Table 11: Global Vat Photopolymerization 3D Printing Technology Market Revenue Million Forecast, by Component 2019 & 2032
- Table 12: Global Vat Photopolymerization 3D Printing Technology Market Volume Billion Forecast, by Component 2019 & 2032
- Table 13: Global Vat Photopolymerization 3D Printing Technology Market Revenue Million Forecast, by Technology 2019 & 2032
- Table 14: Global Vat Photopolymerization 3D Printing Technology Market Volume Billion Forecast, by Technology 2019 & 2032
- Table 15: Global Vat Photopolymerization 3D Printing Technology Market Revenue Million Forecast, by Application 2019 & 2032
- Table 16: Global Vat Photopolymerization 3D Printing Technology Market Volume Billion Forecast, by Application 2019 & 2032
- Table 17: Global Vat Photopolymerization 3D Printing Technology Market Revenue Million Forecast, by Country 2019 & 2032
- Table 18: Global Vat Photopolymerization 3D Printing Technology Market Volume Billion Forecast, by Country 2019 & 2032
- Table 19: United States Vat Photopolymerization 3D Printing Technology Market Revenue (Million) Forecast, by Application 2019 & 2032
- Table 20: United States Vat Photopolymerization 3D Printing Technology Market Volume (Billion) Forecast, by Application 2019 & 2032
- Table 21: Canada Vat Photopolymerization 3D Printing Technology Market Revenue (Million) Forecast, by Application 2019 & 2032
- Table 22: Canada Vat Photopolymerization 3D Printing Technology Market Volume (Billion) Forecast, by Application 2019 & 2032
- Table 23: Mexico Vat Photopolymerization 3D Printing Technology Market Revenue (Million) Forecast, by Application 2019 & 2032
- Table 24: Mexico Vat Photopolymerization 3D Printing Technology Market Volume (Billion) Forecast, by Application 2019 & 2032
- Table 25: Global Vat Photopolymerization 3D Printing Technology Market Revenue Million Forecast, by Component 2019 & 2032
- Table 26: Global Vat Photopolymerization 3D Printing Technology Market Volume Billion Forecast, by Component 2019 & 2032
- Table 27: Global Vat Photopolymerization 3D Printing Technology Market Revenue Million Forecast, by Technology 2019 & 2032
- Table 28: Global Vat Photopolymerization 3D Printing Technology Market Volume Billion Forecast, by Technology 2019 & 2032
- Table 29: Global Vat Photopolymerization 3D Printing Technology Market Revenue Million Forecast, by Application 2019 & 2032
- Table 30: Global Vat Photopolymerization 3D Printing Technology Market Volume Billion Forecast, by Application 2019 & 2032
- Table 31: Global Vat Photopolymerization 3D Printing Technology Market Revenue Million Forecast, by Country 2019 & 2032
- Table 32: Global Vat Photopolymerization 3D Printing Technology Market Volume Billion Forecast, by Country 2019 & 2032
- Table 33: Germany Vat Photopolymerization 3D Printing Technology Market Revenue (Million) Forecast, by Application 2019 & 2032
- Table 34: Germany Vat Photopolymerization 3D Printing Technology Market Volume (Billion) Forecast, by Application 2019 & 2032
- Table 35: United Kingdom Vat Photopolymerization 3D Printing Technology Market Revenue (Million) Forecast, by Application 2019 & 2032
- Table 36: United Kingdom Vat Photopolymerization 3D Printing Technology Market Volume (Billion) Forecast, by Application 2019 & 2032
- Table 37: France Vat Photopolymerization 3D Printing Technology Market Revenue (Million) Forecast, by Application 2019 & 2032
- Table 38: France Vat Photopolymerization 3D Printing Technology Market Volume (Billion) Forecast, by Application 2019 & 2032
- Table 39: Italy Vat Photopolymerization 3D Printing Technology Market Revenue (Million) Forecast, by Application 2019 & 2032
- Table 40: Italy Vat Photopolymerization 3D Printing Technology Market Volume (Billion) Forecast, by Application 2019 & 2032
- Table 41: Spain Vat Photopolymerization 3D Printing Technology Market Revenue (Million) Forecast, by Application 2019 & 2032
- Table 42: Spain Vat Photopolymerization 3D Printing Technology Market Volume (Billion) Forecast, by Application 2019 & 2032
- Table 43: Rest of Europe Vat Photopolymerization 3D Printing Technology Market Revenue (Million) Forecast, by Application 2019 & 2032
- Table 44: Rest of Europe Vat Photopolymerization 3D Printing Technology Market Volume (Billion) Forecast, by Application 2019 & 2032
- Table 45: Global Vat Photopolymerization 3D Printing Technology Market Revenue Million Forecast, by Component 2019 & 2032
- Table 46: Global Vat Photopolymerization 3D Printing Technology Market Volume Billion Forecast, by Component 2019 & 2032
- Table 47: Global Vat Photopolymerization 3D Printing Technology Market Revenue Million Forecast, by Technology 2019 & 2032
- Table 48: Global Vat Photopolymerization 3D Printing Technology Market Volume Billion Forecast, by Technology 2019 & 2032
- Table 49: Global Vat Photopolymerization 3D Printing Technology Market Revenue Million Forecast, by Application 2019 & 2032
- Table 50: Global Vat Photopolymerization 3D Printing Technology Market Volume Billion Forecast, by Application 2019 & 2032
- Table 51: Global Vat Photopolymerization 3D Printing Technology Market Revenue Million Forecast, by Country 2019 & 2032
- Table 52: Global Vat Photopolymerization 3D Printing Technology Market Volume Billion Forecast, by Country 2019 & 2032
- Table 53: China Vat Photopolymerization 3D Printing Technology Market Revenue (Million) Forecast, by Application 2019 & 2032
- Table 54: China Vat Photopolymerization 3D Printing Technology Market Volume (Billion) Forecast, by Application 2019 & 2032
- Table 55: Japan Vat Photopolymerization 3D Printing Technology Market Revenue (Million) Forecast, by Application 2019 & 2032
- Table 56: Japan Vat Photopolymerization 3D Printing Technology Market Volume (Billion) Forecast, by Application 2019 & 2032
- Table 57: India Vat Photopolymerization 3D Printing Technology Market Revenue (Million) Forecast, by Application 2019 & 2032
- Table 58: India Vat Photopolymerization 3D Printing Technology Market Volume (Billion) Forecast, by Application 2019 & 2032
- Table 59: Australia Vat Photopolymerization 3D Printing Technology Market Revenue (Million) Forecast, by Application 2019 & 2032
- Table 60: Australia Vat Photopolymerization 3D Printing Technology Market Volume (Billion) Forecast, by Application 2019 & 2032
- Table 61: South Korea Vat Photopolymerization 3D Printing Technology Market Revenue (Million) Forecast, by Application 2019 & 2032
- Table 62: South Korea Vat Photopolymerization 3D Printing Technology Market Volume (Billion) Forecast, by Application 2019 & 2032
- Table 63: Rest of Asia Pacific Vat Photopolymerization 3D Printing Technology Market Revenue (Million) Forecast, by Application 2019 & 2032
- Table 64: Rest of Asia Pacific Vat Photopolymerization 3D Printing Technology Market Volume (Billion) Forecast, by Application 2019 & 2032
- Table 65: Global Vat Photopolymerization 3D Printing Technology Market Revenue Million Forecast, by Component 2019 & 2032
- Table 66: Global Vat Photopolymerization 3D Printing Technology Market Volume Billion Forecast, by Component 2019 & 2032
- Table 67: Global Vat Photopolymerization 3D Printing Technology Market Revenue Million Forecast, by Technology 2019 & 2032
- Table 68: Global Vat Photopolymerization 3D Printing Technology Market Volume Billion Forecast, by Technology 2019 & 2032
- Table 69: Global Vat Photopolymerization 3D Printing Technology Market Revenue Million Forecast, by Application 2019 & 2032
- Table 70: Global Vat Photopolymerization 3D Printing Technology Market Volume Billion Forecast, by Application 2019 & 2032
- Table 71: Global Vat Photopolymerization 3D Printing Technology Market Revenue Million Forecast, by Country 2019 & 2032
- Table 72: Global Vat Photopolymerization 3D Printing Technology Market Volume Billion Forecast, by Country 2019 & 2032
- Table 73: GCC Vat Photopolymerization 3D Printing Technology Market Revenue (Million) Forecast, by Application 2019 & 2032
- Table 74: GCC Vat Photopolymerization 3D Printing Technology Market Volume (Billion) Forecast, by Application 2019 & 2032
- Table 75: South Africa Vat Photopolymerization 3D Printing Technology Market Revenue (Million) Forecast, by Application 2019 & 2032
- Table 76: South Africa Vat Photopolymerization 3D Printing Technology Market Volume (Billion) Forecast, by Application 2019 & 2032
- Table 77: Rest of Middle East and Africa Vat Photopolymerization 3D Printing Technology Market Revenue (Million) Forecast, by Application 2019 & 2032
- Table 78: Rest of Middle East and Africa Vat Photopolymerization 3D Printing Technology Market Volume (Billion) Forecast, by Application 2019 & 2032
- Table 79: Global Vat Photopolymerization 3D Printing Technology Market Revenue Million Forecast, by Component 2019 & 2032
- Table 80: Global Vat Photopolymerization 3D Printing Technology Market Volume Billion Forecast, by Component 2019 & 2032
- Table 81: Global Vat Photopolymerization 3D Printing Technology Market Revenue Million Forecast, by Technology 2019 & 2032
- Table 82: Global Vat Photopolymerization 3D Printing Technology Market Volume Billion Forecast, by Technology 2019 & 2032
- Table 83: Global Vat Photopolymerization 3D Printing Technology Market Revenue Million Forecast, by Application 2019 & 2032
- Table 84: Global Vat Photopolymerization 3D Printing Technology Market Volume Billion Forecast, by Application 2019 & 2032
- Table 85: Global Vat Photopolymerization 3D Printing Technology Market Revenue Million Forecast, by Country 2019 & 2032
- Table 86: Global Vat Photopolymerization 3D Printing Technology Market Volume Billion Forecast, by Country 2019 & 2032
- Table 87: Brazil Vat Photopolymerization 3D Printing Technology Market Revenue (Million) Forecast, by Application 2019 & 2032
- Table 88: Brazil Vat Photopolymerization 3D Printing Technology Market Volume (Billion) Forecast, by Application 2019 & 2032
- Table 89: Argentina Vat Photopolymerization 3D Printing Technology Market Revenue (Million) Forecast, by Application 2019 & 2032
- Table 90: Argentina Vat Photopolymerization 3D Printing Technology Market Volume (Billion) Forecast, by Application 2019 & 2032
- Table 91: Rest of South America Vat Photopolymerization 3D Printing Technology Market Revenue (Million) Forecast, by Application 2019 & 2032
- Table 92: Rest of South America Vat Photopolymerization 3D Printing Technology Market Volume (Billion) Forecast, by Application 2019 & 2032
Frequently Asked Questions
1. What is the projected Compound Annual Growth Rate (CAGR) of the Vat Photopolymerization 3D Printing Technology Market?
The projected CAGR is approximately 26.02%.
2. Which companies are prominent players in the Vat Photopolymerization 3D Printing Technology Market?
Key companies in the market include Formlabs, 3D Systems Inc, Peopoly, Asiga, Tiertime, Tasly Holding Group, UnionTech, Zortrax, Rayshape*List Not Exhaustive.
3. What are the main segments of the Vat Photopolymerization 3D Printing Technology Market?
The market segments include Component, Technology, Application.
4. Can you provide details about the market size?
The market size is estimated to be USD 2.17 Million as of 2022.
5. What are some drivers contributing to market growth?
Rising Demand for Minimally Invasive Procedures; Growing Technological Advancements.
6. What are the notable trends driving market growth?
Orthopedics Segment Expected to Hold a Significant Market Share Over the Forecast Period.
7. Are there any restraints impacting market growth?
Rising Demand for Minimally Invasive Procedures; Growing Technological Advancements.
8. Can you provide examples of recent developments in the market?
March 2024: Sprybuild, an Israeli start-up, reported the launch of its SLA 3D printer featuring a patented continuous build process on a conveyor belt and rigid optical interface. This 3D printer can be used in the production of dental models, orthopedic insoles, eyeglass frames, hearing aids, and prosthetic components.February 2024: SHINING 3D, a 3D digitization and printing solutions provider, reported the launch of AccuFab-CEL, a dental 3D printer, at the largest dental laboratory event in the United States, LabDay 2024.
9. What pricing options are available for accessing the report?
Pricing options include single-user, multi-user, and enterprise licenses priced at USD 4750, USD 5250, and USD 8750 respectively.
10. Is the market size provided in terms of value or volume?
The market size is provided in terms of value, measured in Million and volume, measured in Billion.
11. Are there any specific market keywords associated with the report?
Yes, the market keyword associated with the report is "Vat Photopolymerization 3D Printing Technology Market," which aids in identifying and referencing the specific market segment covered.
12. How do I determine which pricing option suits my needs best?
The pricing options vary based on user requirements and access needs. Individual users may opt for single-user licenses, while businesses requiring broader access may choose multi-user or enterprise licenses for cost-effective access to the report.
13. Are there any additional resources or data provided in the Vat Photopolymerization 3D Printing Technology Market report?
While the report offers comprehensive insights, it's advisable to review the specific contents or supplementary materials provided to ascertain if additional resources or data are available.
14. How can I stay updated on further developments or reports in the Vat Photopolymerization 3D Printing Technology Market?
To stay informed about further developments, trends, and reports in the Vat Photopolymerization 3D Printing Technology Market, consider subscribing to industry newsletters, following relevant companies and organizations, or regularly checking reputable industry news sources and publications.
Methodology
Step 1 - Identification of Relevant Samples Size from Population Database


Step 2 - Approaches for Defining Global Market Size (Value, Volume* & Price*)

Note*: In applicable scenarios
Step 3 - Data Sources
Primary Research
- Web Analytics
- Survey Reports
- Research Institute
- Latest Research Reports
- Opinion Leaders
Secondary Research
- Annual Reports
- White Paper
- Latest Press Release
- Industry Association
- Paid Database
- Investor Presentations

Step 4 - Data Triangulation
Involves using different sources of information in order to increase the validity of a study
These sources are likely to be stakeholders in a program - participants, other researchers, program staff, other community members, and so on.
Then we put all data in single framework & apply various statistical tools to find out the dynamic on the market.
During the analysis stage, feedback from the stakeholder groups would be compared to determine areas of agreement as well as areas of divergence


