
Key Insights
The ENT (Ear, Nose, and Throat) devices market is experiencing robust growth, driven by a rising prevalence of ear, nose, and throat disorders globally, an aging population increasingly susceptible to hearing loss, and technological advancements leading to minimally invasive and more effective treatment options. The market's compound annual growth rate (CAGR) of 6.40% from 2019-2024 indicates a significant expansion, projected to continue in the coming years. This growth is fueled by factors such as increased healthcare spending, particularly in developed nations, and rising awareness about ENT health. The segment encompassing diagnostic devices is witnessing substantial growth due to the increasing adoption of advanced imaging techniques like endoscopy and improved diagnostic tools for early disease detection. Surgical devices are also a significant contributor, driven by the development of less invasive procedures and robotic-assisted surgery, which improve patient outcomes and recovery times. The hearing aids segment, while mature, remains a significant revenue contributor due to the large and growing population of individuals experiencing hearing impairment. Geographically, North America and Europe currently dominate the market, owing to high healthcare expenditure and advanced medical infrastructure. However, the Asia-Pacific region is expected to witness the fastest growth rate during the forecast period (2025-2033) due to rising disposable incomes, improved healthcare access, and a burgeoning middle class. Competitive pressures are high, with several established players and emerging companies vying for market share. The market is characterized by innovation, with companies continuously striving to develop advanced devices and technologies to improve patient care. This includes the integration of AI and machine learning to enhance diagnosis and treatment.
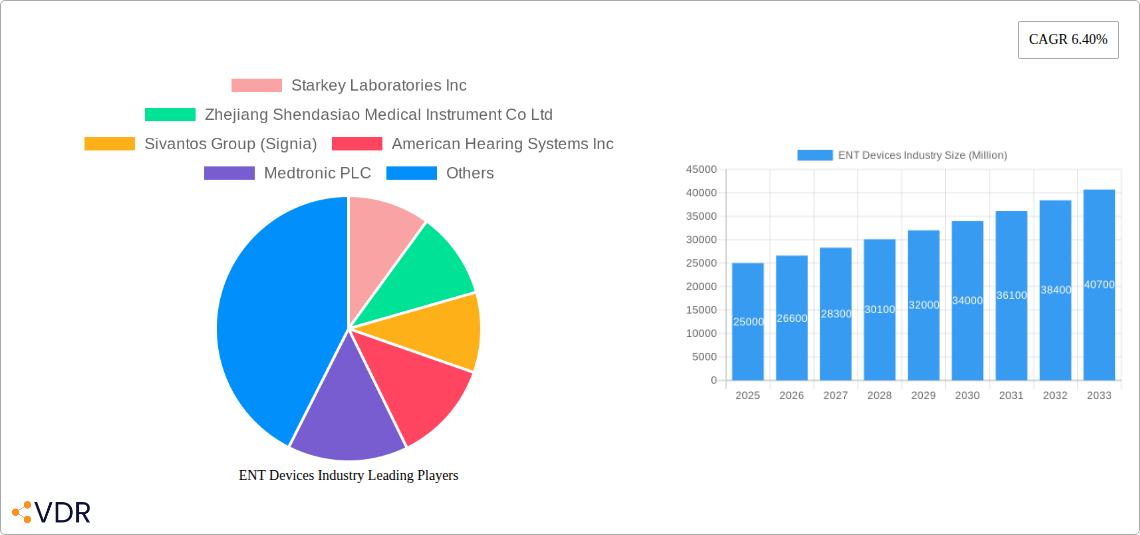
Market restraints include high costs associated with advanced ENT devices, particularly in developing countries, which can limit accessibility. Regulatory hurdles and stringent approval processes in various regions can also delay product launches and market penetration. Furthermore, the market is subject to fluctuations influenced by economic conditions and government healthcare policies. Despite these challenges, the long-term outlook for the ENT devices market remains positive, driven by increasing prevalence of ENT disorders, technological advancements, and a rising demand for improved healthcare outcomes. The diverse range of products, including diagnostic devices, surgical devices, hearing aids, image-guided surgery systems, and others, contributes to the market's overall dynamism and growth potential. The presence of major players such as Starkey Laboratories, Medtronic, and Cochlear underscores the market's maturity and competitiveness.
ENT Devices Industry: A Comprehensive Market Report (2019-2033)
This in-depth report provides a comprehensive analysis of the ENT Devices market, encompassing market dynamics, growth trends, regional performance, product landscape, key players, and future outlook. The study period covers 2019-2033, with 2025 as the base and estimated year. The report segments the market by end-user (Hospitals, ENT Clinics, Other End Users) and product type (Diagnostic Devices, Surgical Devices, Hearing Aids, Image-guided Surgery Systems, Other Products), offering granular insights into this dynamic sector valued at xx Million units in 2025.
ENT Devices Industry Market Dynamics & Structure
The ENT Devices market is characterized by a moderately concentrated landscape, with key players like Medtronic PLC, Cochlear Ltd, and Stryker Corporation holding significant market share. Technological innovation, particularly in areas like AI-powered surgery and minimally invasive procedures, is a major growth driver. Stringent regulatory frameworks, particularly concerning safety and efficacy, influence market access and product development. The market also faces competition from substitute therapies and treatments. M&A activity has been moderate, with a focus on expanding product portfolios and geographical reach. The aging global population is a key demographic factor boosting demand for hearing aids and other ENT devices.
- Market Concentration: Moderately concentrated, with top 5 players holding approximately xx% market share in 2025.
- Technological Innovation: AI-powered surgery, minimally invasive techniques, and improved diagnostic tools are key innovation drivers.
- Regulatory Landscape: Stringent regulatory approvals (e.g., FDA, CE Mark) create barriers to entry but ensure product safety and quality.
- Competitive Substitutes: Pharmaceutical interventions and alternative treatment methods pose competitive pressure.
- End-User Demographics: Aging population fuels demand for hearing aids and other age-related ENT devices.
- M&A Activity: xx major M&A deals observed between 2019-2024, primarily focused on strategic acquisitions.
ENT Devices Industry Growth Trends & Insights
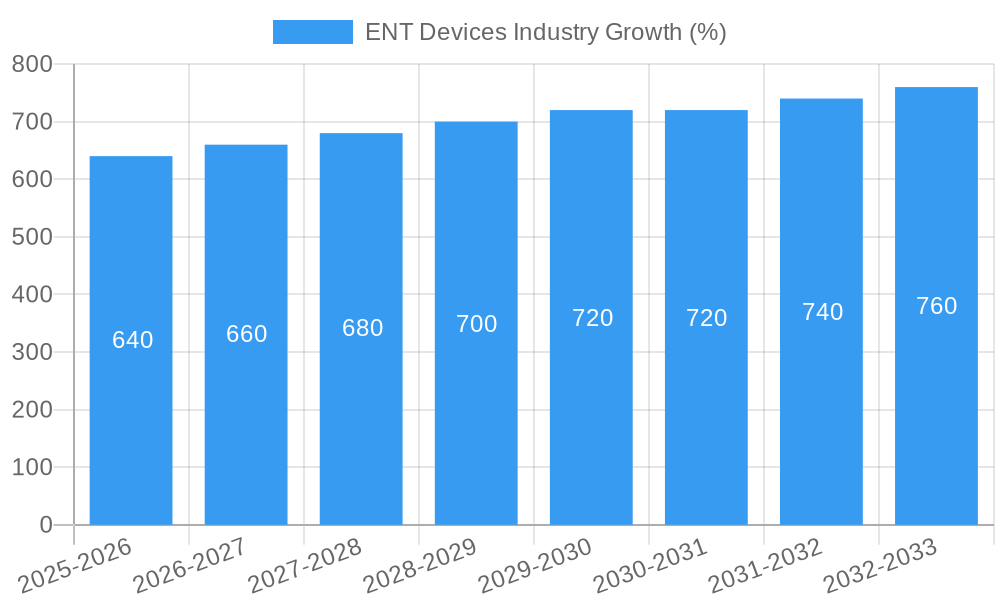
The ENT Devices market experienced significant growth during the historical period (2019-2024), driven by factors such as increasing prevalence of ENT disorders, technological advancements, and rising healthcare expenditure. The market is projected to continue its growth trajectory during the forecast period (2025-2033), with a CAGR of xx%. Increased adoption of minimally invasive surgical procedures and the growing demand for advanced diagnostic tools are major contributors to this growth. Technological disruptions, such as the integration of AI and robotics in surgery, are reshaping the market landscape. Shifting consumer preferences toward minimally invasive and less-invasive procedures also contribute to the growth.
- Market Size Evolution: Market size increased from xx Million units in 2019 to xx Million units in 2024, projecting to reach xx Million units by 2033.
- Adoption Rates: Adoption of advanced diagnostic and surgical devices is steadily increasing, driven by improved outcomes and efficiency.
- Technological Disruptions: AI-powered systems and robotic-assisted surgery are revolutionizing ENT procedures.
- Consumer Behavior Shifts: Preference for outpatient procedures and minimally invasive options is growing.
Dominant Regions, Countries, or Segments in ENT Devices Industry
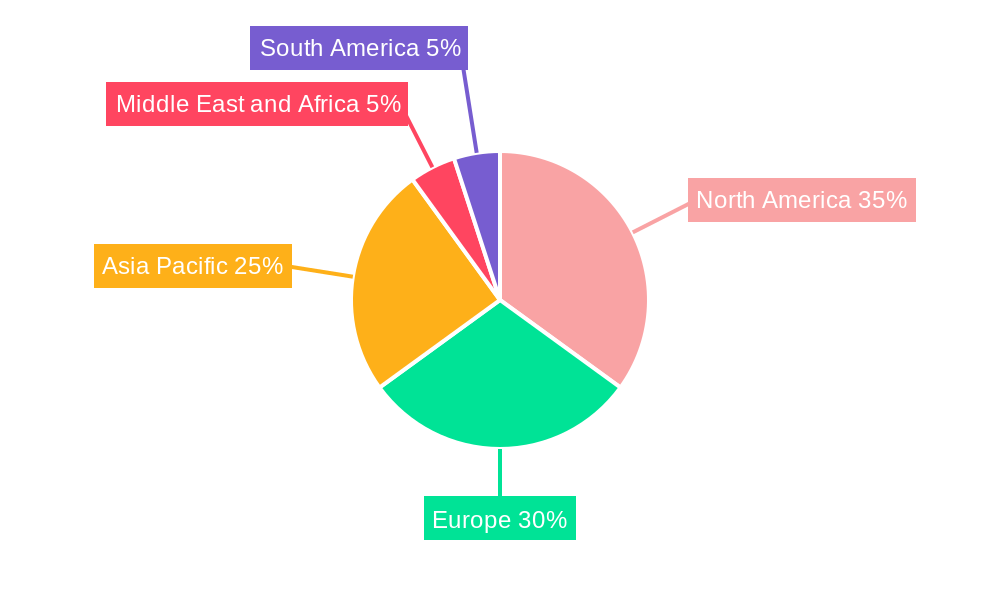
North America currently dominates the ENT Devices market, followed by Europe. This dominance is attributed to high healthcare expenditure, advanced healthcare infrastructure, and a high prevalence of ENT disorders. Within product segments, Hearing Aids represent the largest market share, driven by the aging population. Hospitals are the leading end-users due to their comprehensive infrastructure and specialist teams. However, the growth of ENT clinics is increasing, driven by the expansion of private healthcare and the demand for specialized care.
- Leading Regions: North America and Europe hold the largest market shares due to high healthcare spending and advanced medical infrastructure.
- Key Drivers (North America): High healthcare expenditure, advanced medical technology, and high prevalence of ENT disorders.
- Key Drivers (Europe): Growing aging population, increasing healthcare awareness, and government initiatives supporting healthcare infrastructure.
- Leading Product Segment: Hearing Aids command the largest market share due to an aging population and increased awareness.
- Leading End-User Segment: Hospitals dominate due to comprehensive facilities and specialist staff.
ENT Devices Industry Product Landscape
The ENT Devices market offers a wide range of products, including diagnostic devices (endoscopy systems, imaging equipment), surgical devices (laparoscopes, microscopes), hearing aids (conventional, implantable), image-guided surgery systems, and other specialized instruments. Recent innovations focus on miniaturization, improved imaging capabilities, and enhanced precision. Unique selling propositions include improved ergonomics, enhanced visualization, and minimally invasive capabilities. Technological advancements like AI integration for surgical planning and intraoperative guidance are transforming the field.
Key Drivers, Barriers & Challenges in ENT Devices Industry
Key Drivers:
- Technological advancements: Miniaturization, improved imaging, AI integration.
- Rising prevalence of ENT disorders: Aging population, increased pollution.
- Growing healthcare expenditure: Increased investment in healthcare infrastructure.
Key Challenges:
- High regulatory hurdles: Stringent approval processes and compliance requirements increase development costs and time-to-market.
- Intense competition: Established players and new entrants create price pressure.
- Supply chain disruptions: Global events can impact access to components and materials, leading to delays and increased costs. The impact of these disruptions is estimated to be xx% in 2024.
Emerging Opportunities in ENT Devices Industry
- Expansion into emerging markets: Untapped potential in developing economies with growing healthcare infrastructure.
- Development of innovative products: Focus on minimally invasive procedures, AI-powered systems, and personalized medicine.
- Telemedicine integration: Remote diagnosis and monitoring of ENT conditions offer improved access to care.
Growth Accelerators in the ENT Devices Industry
Technological advancements, strategic partnerships for distribution and R&D, and the expansion into high-growth emerging markets are key growth accelerators. The increasing demand for advanced diagnostic and minimally invasive surgical tools further contributes to market expansion.
Key Players Shaping the ENT Devices Industry Market
- Starkey Laboratories Inc
- Zhejiang Shendasiao Medical Instrument Co Ltd
- Sivantos Group (Signia)
- American Hearing Systems Inc
- Medtronic PLC
- Fujifilm Corporation
- InHealth Technologies
- Welch Allyn
- Atos Medical
- Richard Wolf GmbH
- Cochlear Ltd
- Stryker Corporation
- Olympus Corporation
- Nurotron Biotechnology Co Ltd
Notable Milestones in ENT Devices Industry Sector
- February 2022: Medtronic launched its NuVent Eustachian tube dilation balloon, expanding outpatient options for ENT procedures.
- January 2022: Acclarent Inc. (Johnson & Johnson) launched AI-powered ENT technology for simplified surgical planning and real-time feedback.
In-Depth ENT Devices Industry Market Outlook
The ENT Devices market is poised for sustained growth, driven by technological innovations, an aging population, and increasing healthcare expenditure. Strategic partnerships, market expansion into emerging economies, and the development of novel minimally invasive techniques present significant opportunities for market players. The focus on improved patient outcomes and enhanced cost-effectiveness will shape future market dynamics.
ENT Devices Industry Segmentation
-
1. Product
- 1.1. Diagnostic Devices
- 1.2. Surgical Devices
- 1.3. Hearing Aids
- 1.4. Image-guided Surgery Systems
- 1.5. Other Products
-
2. End User
- 2.1. Hospitals
- 2.2. ENT Clinics
- 2.3. Other End Users
ENT Devices Industry Segmentation By Geography
-
1. North America
- 1.1. United States
- 1.2. Canada
- 1.3. Mexico
-
2. Europe
- 2.1. Germany
- 2.2. United Kingdom
- 2.3. France
- 2.4. Italy
- 2.5. Spain
- 2.6. Rest of Europe
-
3. Asia Pacific
- 3.1. China
- 3.2. Japan
- 3.3. India
- 3.4. Australia
- 3.5. South Korea
- 3.6. Rest of Asia Pacific
-
4. Middle East and Africa
- 4.1. GCC
- 4.2. South Africa
- 4.3. Rest of Middle East and Africa
-
5. South America
- 5.1. Brazil
- 5.2. Argentina
- 5.3. Rest of South America
ENT Devices Industry REPORT HIGHLIGHTS
| Aspects | Details |
|---|---|
| Study Period | 2019-2033 |
| Base Year | 2024 |
| Estimated Year | 2025 |
| Forecast Period | 2025-2033 |
| Historical Period | 2019-2024 |
| Growth Rate | CAGR of 6.40% from 2019-2033 |
| Segmentation |
|
Table of Contents
- 1. Introduction
- 1.1. Research Scope
- 1.2. Market Segmentation
- 1.3. Research Methodology
- 1.4. Definitions and Assumptions
- 2. Executive Summary
- 2.1. Introduction
- 3. Market Dynamics
- 3.1. Introduction
- 3.2. Market Drivers
- 3.2.1 Increasing Prevalence of Ear
- 3.2.2 Nose
- 3.2.3 and Throat Related Disorders; Rising Adoption of Minimally Invasive ENT Procedures; Technological Advancements
- 3.3. Market Restrains
- 3.3.1. High Procedure and Instruments Cost; Social Stigma
- 3.4. Market Trends
- 3.4.1. Hearing Aids Segment is Expected to Account for Fastest Growth Rate during the Forecast Period
- 4. Market Factor Analysis
- 4.1. Porters Five Forces
- 4.2. Supply/Value Chain
- 4.3. PESTEL analysis
- 4.4. Market Entropy
- 4.5. Patent/Trademark Analysis
- 5. Global ENT Devices Industry Analysis, Insights and Forecast, 2019-2031
- 5.1. Market Analysis, Insights and Forecast - by Product
- 5.1.1. Diagnostic Devices
- 5.1.2. Surgical Devices
- 5.1.3. Hearing Aids
- 5.1.4. Image-guided Surgery Systems
- 5.1.5. Other Products
- 5.2. Market Analysis, Insights and Forecast - by End User
- 5.2.1. Hospitals
- 5.2.2. ENT Clinics
- 5.2.3. Other End Users
- 5.3. Market Analysis, Insights and Forecast - by Region
- 5.3.1. North America
- 5.3.2. Europe
- 5.3.3. Asia Pacific
- 5.3.4. Middle East and Africa
- 5.3.5. South America
- 5.1. Market Analysis, Insights and Forecast - by Product
- 6. North America ENT Devices Industry Analysis, Insights and Forecast, 2019-2031
- 6.1. Market Analysis, Insights and Forecast - by Product
- 6.1.1. Diagnostic Devices
- 6.1.2. Surgical Devices
- 6.1.3. Hearing Aids
- 6.1.4. Image-guided Surgery Systems
- 6.1.5. Other Products
- 6.2. Market Analysis, Insights and Forecast - by End User
- 6.2.1. Hospitals
- 6.2.2. ENT Clinics
- 6.2.3. Other End Users
- 6.1. Market Analysis, Insights and Forecast - by Product
- 7. Europe ENT Devices Industry Analysis, Insights and Forecast, 2019-2031
- 7.1. Market Analysis, Insights and Forecast - by Product
- 7.1.1. Diagnostic Devices
- 7.1.2. Surgical Devices
- 7.1.3. Hearing Aids
- 7.1.4. Image-guided Surgery Systems
- 7.1.5. Other Products
- 7.2. Market Analysis, Insights and Forecast - by End User
- 7.2.1. Hospitals
- 7.2.2. ENT Clinics
- 7.2.3. Other End Users
- 7.1. Market Analysis, Insights and Forecast - by Product
- 8. Asia Pacific ENT Devices Industry Analysis, Insights and Forecast, 2019-2031
- 8.1. Market Analysis, Insights and Forecast - by Product
- 8.1.1. Diagnostic Devices
- 8.1.2. Surgical Devices
- 8.1.3. Hearing Aids
- 8.1.4. Image-guided Surgery Systems
- 8.1.5. Other Products
- 8.2. Market Analysis, Insights and Forecast - by End User
- 8.2.1. Hospitals
- 8.2.2. ENT Clinics
- 8.2.3. Other End Users
- 8.1. Market Analysis, Insights and Forecast - by Product
- 9. Middle East and Africa ENT Devices Industry Analysis, Insights and Forecast, 2019-2031
- 9.1. Market Analysis, Insights and Forecast - by Product
- 9.1.1. Diagnostic Devices
- 9.1.2. Surgical Devices
- 9.1.3. Hearing Aids
- 9.1.4. Image-guided Surgery Systems
- 9.1.5. Other Products
- 9.2. Market Analysis, Insights and Forecast - by End User
- 9.2.1. Hospitals
- 9.2.2. ENT Clinics
- 9.2.3. Other End Users
- 9.1. Market Analysis, Insights and Forecast - by Product
- 10. South America ENT Devices Industry Analysis, Insights and Forecast, 2019-2031
- 10.1. Market Analysis, Insights and Forecast - by Product
- 10.1.1. Diagnostic Devices
- 10.1.2. Surgical Devices
- 10.1.3. Hearing Aids
- 10.1.4. Image-guided Surgery Systems
- 10.1.5. Other Products
- 10.2. Market Analysis, Insights and Forecast - by End User
- 10.2.1. Hospitals
- 10.2.2. ENT Clinics
- 10.2.3. Other End Users
- 10.1. Market Analysis, Insights and Forecast - by Product
- 11. North America ENT Devices Industry Analysis, Insights and Forecast, 2019-2031
- 11.1. Market Analysis, Insights and Forecast - By Country/Sub-region
- 11.1.1 United States
- 11.1.2 Canada
- 11.1.3 Mexico
- 12. Europe ENT Devices Industry Analysis, Insights and Forecast, 2019-2031
- 12.1. Market Analysis, Insights and Forecast - By Country/Sub-region
- 12.1.1 Germany
- 12.1.2 United Kingdom
- 12.1.3 France
- 12.1.4 Italy
- 12.1.5 Spain
- 12.1.6 Rest of Europe
- 13. Asia Pacific ENT Devices Industry Analysis, Insights and Forecast, 2019-2031
- 13.1. Market Analysis, Insights and Forecast - By Country/Sub-region
- 13.1.1 China
- 13.1.2 Japan
- 13.1.3 India
- 13.1.4 Australia
- 13.1.5 South Korea
- 13.1.6 Rest of Asia Pacific
- 14. Middle East and Africa ENT Devices Industry Analysis, Insights and Forecast, 2019-2031
- 14.1. Market Analysis, Insights and Forecast - By Country/Sub-region
- 14.1.1 GCC
- 14.1.2 South Africa
- 14.1.3 Rest of Middle East and Africa
- 15. South America ENT Devices Industry Analysis, Insights and Forecast, 2019-2031
- 15.1. Market Analysis, Insights and Forecast - By Country/Sub-region
- 15.1.1 Brazil
- 15.1.2 Argentina
- 15.1.3 Rest of South America
- 16. Competitive Analysis
- 16.1. Global Market Share Analysis 2024
- 16.2. Company Profiles
- 16.2.1 Starkey Laboratories Inc
- 16.2.1.1. Overview
- 16.2.1.2. Products
- 16.2.1.3. SWOT Analysis
- 16.2.1.4. Recent Developments
- 16.2.1.5. Financials (Based on Availability)
- 16.2.2 Zhejiang Shendasiao Medical Instrument Co Ltd
- 16.2.2.1. Overview
- 16.2.2.2. Products
- 16.2.2.3. SWOT Analysis
- 16.2.2.4. Recent Developments
- 16.2.2.5. Financials (Based on Availability)
- 16.2.3 Sivantos Group (Signia)
- 16.2.3.1. Overview
- 16.2.3.2. Products
- 16.2.3.3. SWOT Analysis
- 16.2.3.4. Recent Developments
- 16.2.3.5. Financials (Based on Availability)
- 16.2.4 American Hearing Systems Inc
- 16.2.4.1. Overview
- 16.2.4.2. Products
- 16.2.4.3. SWOT Analysis
- 16.2.4.4. Recent Developments
- 16.2.4.5. Financials (Based on Availability)
- 16.2.5 Medtronic PLC
- 16.2.5.1. Overview
- 16.2.5.2. Products
- 16.2.5.3. SWOT Analysis
- 16.2.5.4. Recent Developments
- 16.2.5.5. Financials (Based on Availability)
- 16.2.6 Fujifilm Corporation
- 16.2.6.1. Overview
- 16.2.6.2. Products
- 16.2.6.3. SWOT Analysis
- 16.2.6.4. Recent Developments
- 16.2.6.5. Financials (Based on Availability)
- 16.2.7 InHealth Technologies
- 16.2.7.1. Overview
- 16.2.7.2. Products
- 16.2.7.3. SWOT Analysis
- 16.2.7.4. Recent Developments
- 16.2.7.5. Financials (Based on Availability)
- 16.2.8 Welch Allyn
- 16.2.8.1. Overview
- 16.2.8.2. Products
- 16.2.8.3. SWOT Analysis
- 16.2.8.4. Recent Developments
- 16.2.8.5. Financials (Based on Availability)
- 16.2.9 Atos Medical
- 16.2.9.1. Overview
- 16.2.9.2. Products
- 16.2.9.3. SWOT Analysis
- 16.2.9.4. Recent Developments
- 16.2.9.5. Financials (Based on Availability)
- 16.2.10 Richard Wolf GmbH
- 16.2.10.1. Overview
- 16.2.10.2. Products
- 16.2.10.3. SWOT Analysis
- 16.2.10.4. Recent Developments
- 16.2.10.5. Financials (Based on Availability)
- 16.2.11 Cochlear Ltd
- 16.2.11.1. Overview
- 16.2.11.2. Products
- 16.2.11.3. SWOT Analysis
- 16.2.11.4. Recent Developments
- 16.2.11.5. Financials (Based on Availability)
- 16.2.12 Stryker Corporation
- 16.2.12.1. Overview
- 16.2.12.2. Products
- 16.2.12.3. SWOT Analysis
- 16.2.12.4. Recent Developments
- 16.2.12.5. Financials (Based on Availability)
- 16.2.13 Olympus Corporation
- 16.2.13.1. Overview
- 16.2.13.2. Products
- 16.2.13.3. SWOT Analysis
- 16.2.13.4. Recent Developments
- 16.2.13.5. Financials (Based on Availability)
- 16.2.14 Nurotron Biotechnology Co Ltd
- 16.2.14.1. Overview
- 16.2.14.2. Products
- 16.2.14.3. SWOT Analysis
- 16.2.14.4. Recent Developments
- 16.2.14.5. Financials (Based on Availability)
- 16.2.1 Starkey Laboratories Inc
List of Figures
- Figure 1: Global ENT Devices Industry Revenue Breakdown (Million, %) by Region 2024 & 2032
- Figure 2: Global ENT Devices Industry Volume Breakdown (K Unit, %) by Region 2024 & 2032
- Figure 3: North America ENT Devices Industry Revenue (Million), by Country 2024 & 2032
- Figure 4: North America ENT Devices Industry Volume (K Unit), by Country 2024 & 2032
- Figure 5: North America ENT Devices Industry Revenue Share (%), by Country 2024 & 2032
- Figure 6: North America ENT Devices Industry Volume Share (%), by Country 2024 & 2032
- Figure 7: Europe ENT Devices Industry Revenue (Million), by Country 2024 & 2032
- Figure 8: Europe ENT Devices Industry Volume (K Unit), by Country 2024 & 2032
- Figure 9: Europe ENT Devices Industry Revenue Share (%), by Country 2024 & 2032
- Figure 10: Europe ENT Devices Industry Volume Share (%), by Country 2024 & 2032
- Figure 11: Asia Pacific ENT Devices Industry Revenue (Million), by Country 2024 & 2032
- Figure 12: Asia Pacific ENT Devices Industry Volume (K Unit), by Country 2024 & 2032
- Figure 13: Asia Pacific ENT Devices Industry Revenue Share (%), by Country 2024 & 2032
- Figure 14: Asia Pacific ENT Devices Industry Volume Share (%), by Country 2024 & 2032
- Figure 15: Middle East and Africa ENT Devices Industry Revenue (Million), by Country 2024 & 2032
- Figure 16: Middle East and Africa ENT Devices Industry Volume (K Unit), by Country 2024 & 2032
- Figure 17: Middle East and Africa ENT Devices Industry Revenue Share (%), by Country 2024 & 2032
- Figure 18: Middle East and Africa ENT Devices Industry Volume Share (%), by Country 2024 & 2032
- Figure 19: South America ENT Devices Industry Revenue (Million), by Country 2024 & 2032
- Figure 20: South America ENT Devices Industry Volume (K Unit), by Country 2024 & 2032
- Figure 21: South America ENT Devices Industry Revenue Share (%), by Country 2024 & 2032
- Figure 22: South America ENT Devices Industry Volume Share (%), by Country 2024 & 2032
- Figure 23: North America ENT Devices Industry Revenue (Million), by Product 2024 & 2032
- Figure 24: North America ENT Devices Industry Volume (K Unit), by Product 2024 & 2032
- Figure 25: North America ENT Devices Industry Revenue Share (%), by Product 2024 & 2032
- Figure 26: North America ENT Devices Industry Volume Share (%), by Product 2024 & 2032
- Figure 27: North America ENT Devices Industry Revenue (Million), by End User 2024 & 2032
- Figure 28: North America ENT Devices Industry Volume (K Unit), by End User 2024 & 2032
- Figure 29: North America ENT Devices Industry Revenue Share (%), by End User 2024 & 2032
- Figure 30: North America ENT Devices Industry Volume Share (%), by End User 2024 & 2032
- Figure 31: North America ENT Devices Industry Revenue (Million), by Country 2024 & 2032
- Figure 32: North America ENT Devices Industry Volume (K Unit), by Country 2024 & 2032
- Figure 33: North America ENT Devices Industry Revenue Share (%), by Country 2024 & 2032
- Figure 34: North America ENT Devices Industry Volume Share (%), by Country 2024 & 2032
- Figure 35: Europe ENT Devices Industry Revenue (Million), by Product 2024 & 2032
- Figure 36: Europe ENT Devices Industry Volume (K Unit), by Product 2024 & 2032
- Figure 37: Europe ENT Devices Industry Revenue Share (%), by Product 2024 & 2032
- Figure 38: Europe ENT Devices Industry Volume Share (%), by Product 2024 & 2032
- Figure 39: Europe ENT Devices Industry Revenue (Million), by End User 2024 & 2032
- Figure 40: Europe ENT Devices Industry Volume (K Unit), by End User 2024 & 2032
- Figure 41: Europe ENT Devices Industry Revenue Share (%), by End User 2024 & 2032
- Figure 42: Europe ENT Devices Industry Volume Share (%), by End User 2024 & 2032
- Figure 43: Europe ENT Devices Industry Revenue (Million), by Country 2024 & 2032
- Figure 44: Europe ENT Devices Industry Volume (K Unit), by Country 2024 & 2032
- Figure 45: Europe ENT Devices Industry Revenue Share (%), by Country 2024 & 2032
- Figure 46: Europe ENT Devices Industry Volume Share (%), by Country 2024 & 2032
- Figure 47: Asia Pacific ENT Devices Industry Revenue (Million), by Product 2024 & 2032
- Figure 48: Asia Pacific ENT Devices Industry Volume (K Unit), by Product 2024 & 2032
- Figure 49: Asia Pacific ENT Devices Industry Revenue Share (%), by Product 2024 & 2032
- Figure 50: Asia Pacific ENT Devices Industry Volume Share (%), by Product 2024 & 2032
- Figure 51: Asia Pacific ENT Devices Industry Revenue (Million), by End User 2024 & 2032
- Figure 52: Asia Pacific ENT Devices Industry Volume (K Unit), by End User 2024 & 2032
- Figure 53: Asia Pacific ENT Devices Industry Revenue Share (%), by End User 2024 & 2032
- Figure 54: Asia Pacific ENT Devices Industry Volume Share (%), by End User 2024 & 2032
- Figure 55: Asia Pacific ENT Devices Industry Revenue (Million), by Country 2024 & 2032
- Figure 56: Asia Pacific ENT Devices Industry Volume (K Unit), by Country 2024 & 2032
- Figure 57: Asia Pacific ENT Devices Industry Revenue Share (%), by Country 2024 & 2032
- Figure 58: Asia Pacific ENT Devices Industry Volume Share (%), by Country 2024 & 2032
- Figure 59: Middle East and Africa ENT Devices Industry Revenue (Million), by Product 2024 & 2032
- Figure 60: Middle East and Africa ENT Devices Industry Volume (K Unit), by Product 2024 & 2032
- Figure 61: Middle East and Africa ENT Devices Industry Revenue Share (%), by Product 2024 & 2032
- Figure 62: Middle East and Africa ENT Devices Industry Volume Share (%), by Product 2024 & 2032
- Figure 63: Middle East and Africa ENT Devices Industry Revenue (Million), by End User 2024 & 2032
- Figure 64: Middle East and Africa ENT Devices Industry Volume (K Unit), by End User 2024 & 2032
- Figure 65: Middle East and Africa ENT Devices Industry Revenue Share (%), by End User 2024 & 2032
- Figure 66: Middle East and Africa ENT Devices Industry Volume Share (%), by End User 2024 & 2032
- Figure 67: Middle East and Africa ENT Devices Industry Revenue (Million), by Country 2024 & 2032
- Figure 68: Middle East and Africa ENT Devices Industry Volume (K Unit), by Country 2024 & 2032
- Figure 69: Middle East and Africa ENT Devices Industry Revenue Share (%), by Country 2024 & 2032
- Figure 70: Middle East and Africa ENT Devices Industry Volume Share (%), by Country 2024 & 2032
- Figure 71: South America ENT Devices Industry Revenue (Million), by Product 2024 & 2032
- Figure 72: South America ENT Devices Industry Volume (K Unit), by Product 2024 & 2032
- Figure 73: South America ENT Devices Industry Revenue Share (%), by Product 2024 & 2032
- Figure 74: South America ENT Devices Industry Volume Share (%), by Product 2024 & 2032
- Figure 75: South America ENT Devices Industry Revenue (Million), by End User 2024 & 2032
- Figure 76: South America ENT Devices Industry Volume (K Unit), by End User 2024 & 2032
- Figure 77: South America ENT Devices Industry Revenue Share (%), by End User 2024 & 2032
- Figure 78: South America ENT Devices Industry Volume Share (%), by End User 2024 & 2032
- Figure 79: South America ENT Devices Industry Revenue (Million), by Country 2024 & 2032
- Figure 80: South America ENT Devices Industry Volume (K Unit), by Country 2024 & 2032
- Figure 81: South America ENT Devices Industry Revenue Share (%), by Country 2024 & 2032
- Figure 82: South America ENT Devices Industry Volume Share (%), by Country 2024 & 2032
List of Tables
- Table 1: Global ENT Devices Industry Revenue Million Forecast, by Region 2019 & 2032
- Table 2: Global ENT Devices Industry Volume K Unit Forecast, by Region 2019 & 2032
- Table 3: Global ENT Devices Industry Revenue Million Forecast, by Product 2019 & 2032
- Table 4: Global ENT Devices Industry Volume K Unit Forecast, by Product 2019 & 2032
- Table 5: Global ENT Devices Industry Revenue Million Forecast, by End User 2019 & 2032
- Table 6: Global ENT Devices Industry Volume K Unit Forecast, by End User 2019 & 2032
- Table 7: Global ENT Devices Industry Revenue Million Forecast, by Region 2019 & 2032
- Table 8: Global ENT Devices Industry Volume K Unit Forecast, by Region 2019 & 2032
- Table 9: Global ENT Devices Industry Revenue Million Forecast, by Country 2019 & 2032
- Table 10: Global ENT Devices Industry Volume K Unit Forecast, by Country 2019 & 2032
- Table 11: United States ENT Devices Industry Revenue (Million) Forecast, by Application 2019 & 2032
- Table 12: United States ENT Devices Industry Volume (K Unit) Forecast, by Application 2019 & 2032
- Table 13: Canada ENT Devices Industry Revenue (Million) Forecast, by Application 2019 & 2032
- Table 14: Canada ENT Devices Industry Volume (K Unit) Forecast, by Application 2019 & 2032
- Table 15: Mexico ENT Devices Industry Revenue (Million) Forecast, by Application 2019 & 2032
- Table 16: Mexico ENT Devices Industry Volume (K Unit) Forecast, by Application 2019 & 2032
- Table 17: Global ENT Devices Industry Revenue Million Forecast, by Country 2019 & 2032
- Table 18: Global ENT Devices Industry Volume K Unit Forecast, by Country 2019 & 2032
- Table 19: Germany ENT Devices Industry Revenue (Million) Forecast, by Application 2019 & 2032
- Table 20: Germany ENT Devices Industry Volume (K Unit) Forecast, by Application 2019 & 2032
- Table 21: United Kingdom ENT Devices Industry Revenue (Million) Forecast, by Application 2019 & 2032
- Table 22: United Kingdom ENT Devices Industry Volume (K Unit) Forecast, by Application 2019 & 2032
- Table 23: France ENT Devices Industry Revenue (Million) Forecast, by Application 2019 & 2032
- Table 24: France ENT Devices Industry Volume (K Unit) Forecast, by Application 2019 & 2032
- Table 25: Italy ENT Devices Industry Revenue (Million) Forecast, by Application 2019 & 2032
- Table 26: Italy ENT Devices Industry Volume (K Unit) Forecast, by Application 2019 & 2032
- Table 27: Spain ENT Devices Industry Revenue (Million) Forecast, by Application 2019 & 2032
- Table 28: Spain ENT Devices Industry Volume (K Unit) Forecast, by Application 2019 & 2032
- Table 29: Rest of Europe ENT Devices Industry Revenue (Million) Forecast, by Application 2019 & 2032
- Table 30: Rest of Europe ENT Devices Industry Volume (K Unit) Forecast, by Application 2019 & 2032
- Table 31: Global ENT Devices Industry Revenue Million Forecast, by Country 2019 & 2032
- Table 32: Global ENT Devices Industry Volume K Unit Forecast, by Country 2019 & 2032
- Table 33: China ENT Devices Industry Revenue (Million) Forecast, by Application 2019 & 2032
- Table 34: China ENT Devices Industry Volume (K Unit) Forecast, by Application 2019 & 2032
- Table 35: Japan ENT Devices Industry Revenue (Million) Forecast, by Application 2019 & 2032
- Table 36: Japan ENT Devices Industry Volume (K Unit) Forecast, by Application 2019 & 2032
- Table 37: India ENT Devices Industry Revenue (Million) Forecast, by Application 2019 & 2032
- Table 38: India ENT Devices Industry Volume (K Unit) Forecast, by Application 2019 & 2032
- Table 39: Australia ENT Devices Industry Revenue (Million) Forecast, by Application 2019 & 2032
- Table 40: Australia ENT Devices Industry Volume (K Unit) Forecast, by Application 2019 & 2032
- Table 41: South Korea ENT Devices Industry Revenue (Million) Forecast, by Application 2019 & 2032
- Table 42: South Korea ENT Devices Industry Volume (K Unit) Forecast, by Application 2019 & 2032
- Table 43: Rest of Asia Pacific ENT Devices Industry Revenue (Million) Forecast, by Application 2019 & 2032
- Table 44: Rest of Asia Pacific ENT Devices Industry Volume (K Unit) Forecast, by Application 2019 & 2032
- Table 45: Global ENT Devices Industry Revenue Million Forecast, by Country 2019 & 2032
- Table 46: Global ENT Devices Industry Volume K Unit Forecast, by Country 2019 & 2032
- Table 47: GCC ENT Devices Industry Revenue (Million) Forecast, by Application 2019 & 2032
- Table 48: GCC ENT Devices Industry Volume (K Unit) Forecast, by Application 2019 & 2032
- Table 49: South Africa ENT Devices Industry Revenue (Million) Forecast, by Application 2019 & 2032
- Table 50: South Africa ENT Devices Industry Volume (K Unit) Forecast, by Application 2019 & 2032
- Table 51: Rest of Middle East and Africa ENT Devices Industry Revenue (Million) Forecast, by Application 2019 & 2032
- Table 52: Rest of Middle East and Africa ENT Devices Industry Volume (K Unit) Forecast, by Application 2019 & 2032
- Table 53: Global ENT Devices Industry Revenue Million Forecast, by Country 2019 & 2032
- Table 54: Global ENT Devices Industry Volume K Unit Forecast, by Country 2019 & 2032
- Table 55: Brazil ENT Devices Industry Revenue (Million) Forecast, by Application 2019 & 2032
- Table 56: Brazil ENT Devices Industry Volume (K Unit) Forecast, by Application 2019 & 2032
- Table 57: Argentina ENT Devices Industry Revenue (Million) Forecast, by Application 2019 & 2032
- Table 58: Argentina ENT Devices Industry Volume (K Unit) Forecast, by Application 2019 & 2032
- Table 59: Rest of South America ENT Devices Industry Revenue (Million) Forecast, by Application 2019 & 2032
- Table 60: Rest of South America ENT Devices Industry Volume (K Unit) Forecast, by Application 2019 & 2032
- Table 61: Global ENT Devices Industry Revenue Million Forecast, by Product 2019 & 2032
- Table 62: Global ENT Devices Industry Volume K Unit Forecast, by Product 2019 & 2032
- Table 63: Global ENT Devices Industry Revenue Million Forecast, by End User 2019 & 2032
- Table 64: Global ENT Devices Industry Volume K Unit Forecast, by End User 2019 & 2032
- Table 65: Global ENT Devices Industry Revenue Million Forecast, by Country 2019 & 2032
- Table 66: Global ENT Devices Industry Volume K Unit Forecast, by Country 2019 & 2032
- Table 67: United States ENT Devices Industry Revenue (Million) Forecast, by Application 2019 & 2032
- Table 68: United States ENT Devices Industry Volume (K Unit) Forecast, by Application 2019 & 2032
- Table 69: Canada ENT Devices Industry Revenue (Million) Forecast, by Application 2019 & 2032
- Table 70: Canada ENT Devices Industry Volume (K Unit) Forecast, by Application 2019 & 2032
- Table 71: Mexico ENT Devices Industry Revenue (Million) Forecast, by Application 2019 & 2032
- Table 72: Mexico ENT Devices Industry Volume (K Unit) Forecast, by Application 2019 & 2032
- Table 73: Global ENT Devices Industry Revenue Million Forecast, by Product 2019 & 2032
- Table 74: Global ENT Devices Industry Volume K Unit Forecast, by Product 2019 & 2032
- Table 75: Global ENT Devices Industry Revenue Million Forecast, by End User 2019 & 2032
- Table 76: Global ENT Devices Industry Volume K Unit Forecast, by End User 2019 & 2032
- Table 77: Global ENT Devices Industry Revenue Million Forecast, by Country 2019 & 2032
- Table 78: Global ENT Devices Industry Volume K Unit Forecast, by Country 2019 & 2032
- Table 79: Germany ENT Devices Industry Revenue (Million) Forecast, by Application 2019 & 2032
- Table 80: Germany ENT Devices Industry Volume (K Unit) Forecast, by Application 2019 & 2032
- Table 81: United Kingdom ENT Devices Industry Revenue (Million) Forecast, by Application 2019 & 2032
- Table 82: United Kingdom ENT Devices Industry Volume (K Unit) Forecast, by Application 2019 & 2032
- Table 83: France ENT Devices Industry Revenue (Million) Forecast, by Application 2019 & 2032
- Table 84: France ENT Devices Industry Volume (K Unit) Forecast, by Application 2019 & 2032
- Table 85: Italy ENT Devices Industry Revenue (Million) Forecast, by Application 2019 & 2032
- Table 86: Italy ENT Devices Industry Volume (K Unit) Forecast, by Application 2019 & 2032
- Table 87: Spain ENT Devices Industry Revenue (Million) Forecast, by Application 2019 & 2032
- Table 88: Spain ENT Devices Industry Volume (K Unit) Forecast, by Application 2019 & 2032
- Table 89: Rest of Europe ENT Devices Industry Revenue (Million) Forecast, by Application 2019 & 2032
- Table 90: Rest of Europe ENT Devices Industry Volume (K Unit) Forecast, by Application 2019 & 2032
- Table 91: Global ENT Devices Industry Revenue Million Forecast, by Product 2019 & 2032
- Table 92: Global ENT Devices Industry Volume K Unit Forecast, by Product 2019 & 2032
- Table 93: Global ENT Devices Industry Revenue Million Forecast, by End User 2019 & 2032
- Table 94: Global ENT Devices Industry Volume K Unit Forecast, by End User 2019 & 2032
- Table 95: Global ENT Devices Industry Revenue Million Forecast, by Country 2019 & 2032
- Table 96: Global ENT Devices Industry Volume K Unit Forecast, by Country 2019 & 2032
- Table 97: China ENT Devices Industry Revenue (Million) Forecast, by Application 2019 & 2032
- Table 98: China ENT Devices Industry Volume (K Unit) Forecast, by Application 2019 & 2032
- Table 99: Japan ENT Devices Industry Revenue (Million) Forecast, by Application 2019 & 2032
- Table 100: Japan ENT Devices Industry Volume (K Unit) Forecast, by Application 2019 & 2032
- Table 101: India ENT Devices Industry Revenue (Million) Forecast, by Application 2019 & 2032
- Table 102: India ENT Devices Industry Volume (K Unit) Forecast, by Application 2019 & 2032
- Table 103: Australia ENT Devices Industry Revenue (Million) Forecast, by Application 2019 & 2032
- Table 104: Australia ENT Devices Industry Volume (K Unit) Forecast, by Application 2019 & 2032
- Table 105: South Korea ENT Devices Industry Revenue (Million) Forecast, by Application 2019 & 2032
- Table 106: South Korea ENT Devices Industry Volume (K Unit) Forecast, by Application 2019 & 2032
- Table 107: Rest of Asia Pacific ENT Devices Industry Revenue (Million) Forecast, by Application 2019 & 2032
- Table 108: Rest of Asia Pacific ENT Devices Industry Volume (K Unit) Forecast, by Application 2019 & 2032
- Table 109: Global ENT Devices Industry Revenue Million Forecast, by Product 2019 & 2032
- Table 110: Global ENT Devices Industry Volume K Unit Forecast, by Product 2019 & 2032
- Table 111: Global ENT Devices Industry Revenue Million Forecast, by End User 2019 & 2032
- Table 112: Global ENT Devices Industry Volume K Unit Forecast, by End User 2019 & 2032
- Table 113: Global ENT Devices Industry Revenue Million Forecast, by Country 2019 & 2032
- Table 114: Global ENT Devices Industry Volume K Unit Forecast, by Country 2019 & 2032
- Table 115: GCC ENT Devices Industry Revenue (Million) Forecast, by Application 2019 & 2032
- Table 116: GCC ENT Devices Industry Volume (K Unit) Forecast, by Application 2019 & 2032
- Table 117: South Africa ENT Devices Industry Revenue (Million) Forecast, by Application 2019 & 2032
- Table 118: South Africa ENT Devices Industry Volume (K Unit) Forecast, by Application 2019 & 2032
- Table 119: Rest of Middle East and Africa ENT Devices Industry Revenue (Million) Forecast, by Application 2019 & 2032
- Table 120: Rest of Middle East and Africa ENT Devices Industry Volume (K Unit) Forecast, by Application 2019 & 2032
- Table 121: Global ENT Devices Industry Revenue Million Forecast, by Product 2019 & 2032
- Table 122: Global ENT Devices Industry Volume K Unit Forecast, by Product 2019 & 2032
- Table 123: Global ENT Devices Industry Revenue Million Forecast, by End User 2019 & 2032
- Table 124: Global ENT Devices Industry Volume K Unit Forecast, by End User 2019 & 2032
- Table 125: Global ENT Devices Industry Revenue Million Forecast, by Country 2019 & 2032
- Table 126: Global ENT Devices Industry Volume K Unit Forecast, by Country 2019 & 2032
- Table 127: Brazil ENT Devices Industry Revenue (Million) Forecast, by Application 2019 & 2032
- Table 128: Brazil ENT Devices Industry Volume (K Unit) Forecast, by Application 2019 & 2032
- Table 129: Argentina ENT Devices Industry Revenue (Million) Forecast, by Application 2019 & 2032
- Table 130: Argentina ENT Devices Industry Volume (K Unit) Forecast, by Application 2019 & 2032
- Table 131: Rest of South America ENT Devices Industry Revenue (Million) Forecast, by Application 2019 & 2032
- Table 132: Rest of South America ENT Devices Industry Volume (K Unit) Forecast, by Application 2019 & 2032
Frequently Asked Questions
1. What is the projected Compound Annual Growth Rate (CAGR) of the ENT Devices Industry?
The projected CAGR is approximately 6.40%.
2. Which companies are prominent players in the ENT Devices Industry?
Key companies in the market include Starkey Laboratories Inc, Zhejiang Shendasiao Medical Instrument Co Ltd, Sivantos Group (Signia), American Hearing Systems Inc, Medtronic PLC, Fujifilm Corporation, InHealth Technologies, Welch Allyn, Atos Medical, Richard Wolf GmbH, Cochlear Ltd, Stryker Corporation, Olympus Corporation, Nurotron Biotechnology Co Ltd.
3. What are the main segments of the ENT Devices Industry?
The market segments include Product, End User.
4. Can you provide details about the market size?
The market size is estimated to be USD XX Million as of 2022.
5. What are some drivers contributing to market growth?
Increasing Prevalence of Ear. Nose. and Throat Related Disorders; Rising Adoption of Minimally Invasive ENT Procedures; Technological Advancements.
6. What are the notable trends driving market growth?
Hearing Aids Segment is Expected to Account for Fastest Growth Rate during the Forecast Period.
7. Are there any restraints impacting market growth?
High Procedure and Instruments Cost; Social Stigma.
8. Can you provide examples of recent developments in the market?
In February 2022, Medtronic launched its NuVent Eustachian tube dilation balloon, which gives surgeons an outpatient option for some ear, nose, and throat conditions.
9. What pricing options are available for accessing the report?
Pricing options include single-user, multi-user, and enterprise licenses priced at USD 4750, USD 5250, and USD 8750 respectively.
10. Is the market size provided in terms of value or volume?
The market size is provided in terms of value, measured in Million and volume, measured in K Unit.
11. Are there any specific market keywords associated with the report?
Yes, the market keyword associated with the report is "ENT Devices Industry," which aids in identifying and referencing the specific market segment covered.
12. How do I determine which pricing option suits my needs best?
The pricing options vary based on user requirements and access needs. Individual users may opt for single-user licenses, while businesses requiring broader access may choose multi-user or enterprise licenses for cost-effective access to the report.
13. Are there any additional resources or data provided in the ENT Devices Industry report?
While the report offers comprehensive insights, it's advisable to review the specific contents or supplementary materials provided to ascertain if additional resources or data are available.
14. How can I stay updated on further developments or reports in the ENT Devices Industry?
To stay informed about further developments, trends, and reports in the ENT Devices Industry, consider subscribing to industry newsletters, following relevant companies and organizations, or regularly checking reputable industry news sources and publications.
Methodology
Step 1 - Identification of Relevant Samples Size from Population Database


Step 2 - Approaches for Defining Global Market Size (Value, Volume* & Price*)

Note*: In applicable scenarios
Step 3 - Data Sources
Primary Research
- Web Analytics
- Survey Reports
- Research Institute
- Latest Research Reports
- Opinion Leaders
Secondary Research
- Annual Reports
- White Paper
- Latest Press Release
- Industry Association
- Paid Database
- Investor Presentations

Step 4 - Data Triangulation
Involves using different sources of information in order to increase the validity of a study
These sources are likely to be stakeholders in a program - participants, other researchers, program staff, other community members, and so on.
Then we put all data in single framework & apply various statistical tools to find out the dynamic on the market.
During the analysis stage, feedback from the stakeholder groups would be compared to determine areas of agreement as well as areas of divergence


