
Key Insights
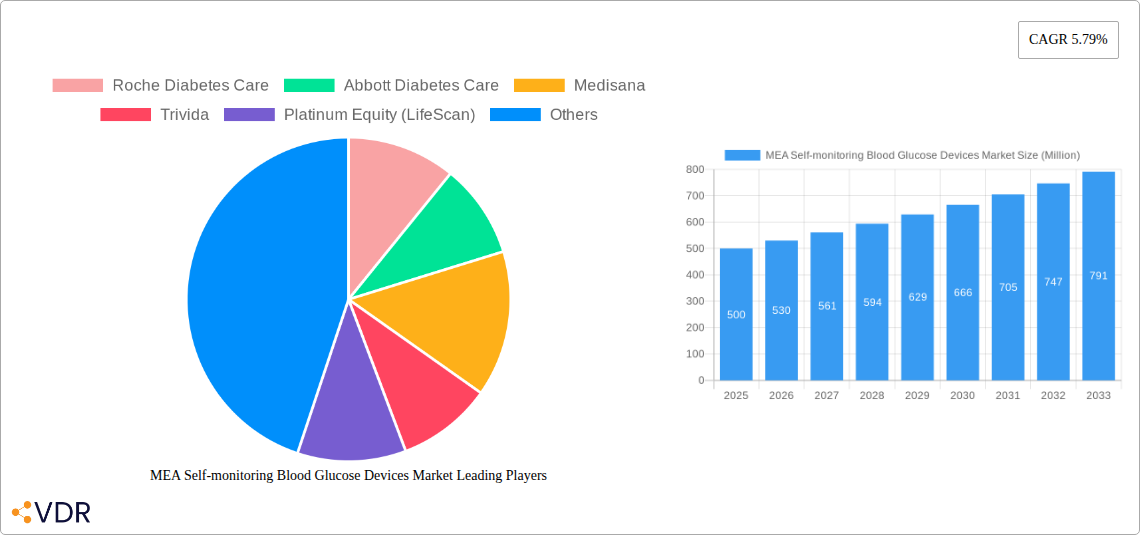
The MEA (Middle East and Africa) self-monitoring blood glucose (SMBG) devices market, valued at approximately $500 million in 2025, is projected to experience robust growth, driven by rising prevalence of diabetes, increasing awareness about the importance of blood glucose monitoring, and expanding healthcare infrastructure across the region. The market's compound annual growth rate (CAGR) is estimated to be around 6%, slightly higher than the global average, reflecting a greater need for improved diabetes management in the MEA region, where access to healthcare remains a challenge in some areas. Key growth drivers include government initiatives promoting diabetes awareness and prevention programs, increased affordability of SMBG devices due to growing competition and technological advancements, and a surge in the adoption of advanced glucometers with features like data connectivity and cloud integration. However, factors like limited healthcare access in certain regions and high cost of advanced devices in others could slightly restrain market expansion.
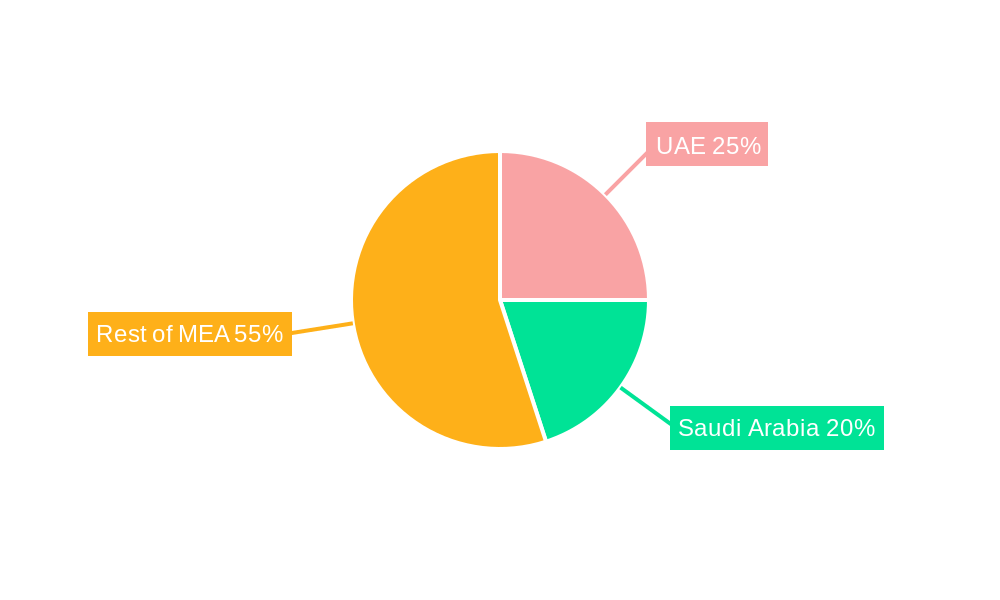
The market is segmented into glucometer devices, test strips, and lancets. Glucometer devices, representing a significant portion of the market share, are witnessing a shift toward advanced technologies such as continuous glucose monitoring (CGM) systems, particularly in urban centers with higher disposable incomes. Test strips and lancets, being consumables, are essential components and represent a substantial portion of the overall revenue. Major players like Roche Diabetes Care, Abbott Diabetes Care, and Ascensia Diabetes Care are aggressively expanding their market reach through strategic partnerships, product innovation, and targeted marketing campaigns to capture a larger share of this burgeoning market. Regional variations in market growth are expected, with countries like the UAE and Saudi Arabia leading due to higher prevalence rates and advanced healthcare infrastructure, while other nations will show slower, but still positive, growth due to improvements in healthcare access and economic development.
MEA Self-Monitoring Blood Glucose Devices Market Report: 2019-2033
This comprehensive report provides a detailed analysis of the Middle East and Africa (MEA) self-monitoring blood glucose devices market, encompassing historical data (2019-2024), the base year (2025), and a forecast period (2025-2033). The report segments the market into key components: Glucometer Devices, Test Strips, and Lancets, providing in-depth insights for industry professionals, investors, and stakeholders. It analyzes market dynamics, growth trends, regional performance, and the competitive landscape, highlighting key players like Roche Diabetes Care, Abbott Diabetes Care, and others. The report also explores emerging opportunities and growth accelerators, making it an indispensable resource for navigating this dynamic market.
Key Market Segments: The MEA self-monitoring blood glucose devices market, a child market within the broader diabetes care industry (parent market), is segmented into three key components: Glucometer Devices, Test Strips, and Lancets. Each segment's performance is thoroughly analyzed within the report.
MEA Self-monitoring Blood Glucose Devices Market Dynamics & Structure
The MEA self-monitoring blood glucose devices market is characterized by moderate concentration, with several key players holding significant market share. Technological innovation, particularly in areas like connectivity and data management, is a key driver, while regulatory frameworks and reimbursement policies significantly influence market access and growth. The increasing prevalence of diabetes across the region is a primary driver, fueling demand for self-monitoring devices. Competitive pressures arise from both established players and emerging companies introducing innovative products. M&A activity within the sector remains moderate, with xx deals recorded during the historical period (2019-2024), representing a xx% market share change.
- Market Concentration: Moderately concentrated, with top 5 players holding approximately xx% market share in 2024.
- Technological Innovation: Continuous advancements in accuracy, connectivity (e.g., Bluetooth integration), and data analysis capabilities drive market growth.
- Regulatory Landscape: Varying regulatory requirements across MEA countries impact market entry and product approvals.
- Competitive Landscape: Intense competition among established players and emerging companies based on pricing, innovation, and distribution strategies.
- M&A Activity: Moderate level of mergers and acquisitions, primarily focused on expanding market reach and technological capabilities. xx deals recorded between 2019 and 2024.
- Innovation Barriers: High R&D costs and regulatory hurdles pose challenges for new entrants.
MEA Self-monitoring Blood Glucose Devices Market Growth Trends & Insights
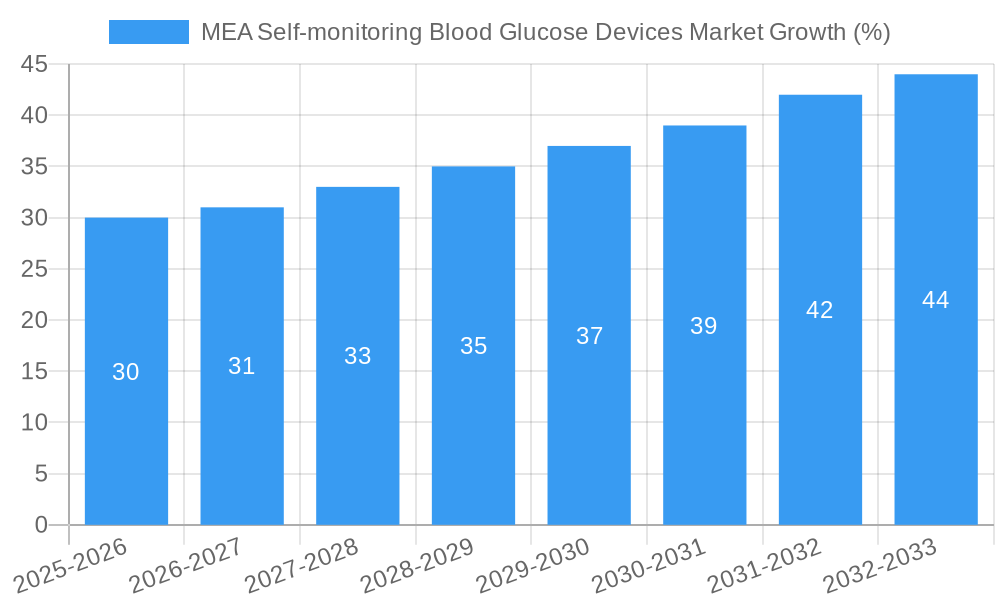
The MEA self-monitoring blood glucose devices market experienced a CAGR of xx% during the historical period (2019-2024), reaching a market size of xx million units in 2024. This growth is attributed to several factors, including the rising prevalence of diabetes, increased awareness of self-management, and growing affordability of devices. Technological advancements, such as the integration of mobile applications for data tracking and remote monitoring, are further driving adoption rates. Consumer behavior is shifting towards more convenient and user-friendly devices with improved accuracy. The forecast period (2025-2033) projects a CAGR of xx%, with the market expected to reach xx million units by 2033. Market penetration is expected to increase from xx% in 2024 to xx% by 2033.
Dominant Regions, Countries, or Segments in MEA Self-monitoring Blood Glucose Devices Market
The [Specific Country/Region - e.g., Egypt or the Gulf Cooperation Council (GCC)] region is currently the leading segment within the MEA self-monitoring blood glucose devices market, holding a significant market share of approximately xx% in 2024. This dominance can be attributed to several factors:
High Prevalence of Diabetes: A higher prevalence of diabetes compared to other MEA regions.
Improved Healthcare Infrastructure: Relatively better healthcare infrastructure and accessibility to diagnostic tools.
Government Initiatives: Supportive government policies and initiatives aimed at diabetes prevention and management.
Increased Awareness: Rising awareness among the population regarding the importance of diabetes self-management.
Within the component segments, Test Strips currently hold the largest market share, driven by the continuous need for regular glucose monitoring. The Glucometer Devices segment is also experiencing strong growth, fueled by technological advancements. The Lancets segment, while smaller, is expected to witness consistent growth, aligned with the expansion of the overall market.
MEA Self-monitoring Blood Glucose Devices Market Product Landscape
The MEA market offers a range of self-monitoring blood glucose devices, from basic glucometers to advanced systems with integrated mobile apps and data connectivity. These devices vary in features, accuracy, and pricing, catering to a diverse range of consumer needs and preferences. Key product innovations include improved accuracy, smaller device size, wireless connectivity, and integrated data management systems. The incorporation of AI and machine learning algorithms for personalized insights is gaining traction. Many devices emphasize ease of use and painless lancing technology, enhancing user experience and compliance.
Key Drivers, Barriers & Challenges in MEA Self-monitoring Blood Glucose Devices Market
Key Drivers:
- Rising Prevalence of Diabetes: The increasing incidence of diabetes in the MEA region is a major driver of market growth.
- Growing Awareness of Self-Management: Increasing public awareness of the importance of self-monitoring for diabetes management.
- Technological Advancements: Continuous innovation in device features and connectivity are enhancing user experience and improving accuracy.
Key Challenges:
- High Cost of Devices and Supplies: The cost of blood glucose monitoring devices and consumables remains a barrier for many individuals, particularly in lower-income populations.
- Limited Healthcare Access: Unequal access to healthcare and diagnostic facilities in certain regions hinders widespread adoption.
- Regulatory Hurdles: Varied and sometimes complex regulatory processes for product registration and approval. Supply chain disruptions, exacerbated by geopolitical factors, have also impacted market availability. This resulted in a xx% price increase in 2023 for some devices.
Emerging Opportunities in MEA Self-monitoring Blood Glucose Devices Market
- Untapped Markets: Significant potential exists in expanding market reach to rural and underserved populations.
- Innovative Applications: Integration with telehealth platforms and mobile health solutions offers new opportunities for remote monitoring and diabetes management.
- Evolving Consumer Preferences: Demand for user-friendly devices with advanced features, such as Bluetooth connectivity and data analytics, is growing.
Growth Accelerators in the MEA Self-monitoring Blood Glucose Devices Market Industry
Several factors are poised to accelerate long-term market growth. Strategic partnerships between device manufacturers and healthcare providers are expanding market access and facilitating better integration into diabetes care pathways. The development of innovative technologies, such as continuous glucose monitoring (CGM) systems, is also expected to significantly increase market potential. Further, government initiatives promoting diabetes awareness and encouraging self-management practices will play a vital role in driving future growth.
Key Players Shaping the MEA Self-monitoring Blood Glucose Devices Market Market
- Roche Diabetes Care
- Abbott Diabetes Care
- Medisana
- Trivida
- Platinum Equity (LifeScan)
- Agamatrix Inc
- I-Sens
- Arkray
- Ascensia Diabetes Care
Notable Milestones in MEA Self-monitoring Blood Glucose Devices Market Sector
- October 2023: The World Health Organization (WHO) updated its list of essential diagnostics, including new guidelines for personal-use glucose meters, endorsing their integration into diabetes care recommendations. This is expected to positively impact market growth by increasing device adoption.
- June 2022: LifeScan's publication of real-world evidence demonstrating improved glycemic control using its Bluetooth-connected OneTouch Verio Reflect meter and OneTouch Reveal mobile app highlighted the benefits of connected devices and spurred further market interest in digital health solutions for diabetes management.
In-Depth MEA Self-monitoring Blood Glucose Devices Market Market Outlook
The MEA self-monitoring blood glucose devices market is poised for significant growth over the forecast period, driven by increasing diabetes prevalence, technological advancements, and supportive government initiatives. Strategic opportunities lie in expanding market reach to underserved populations, developing innovative products that cater to specific regional needs, and strengthening partnerships within the healthcare ecosystem. The market's long-term potential is substantial, presenting promising avenues for both established players and new entrants.
MEA Self-monitoring Blood Glucose Devices Market Segmentation
-
1. Component
- 1.1. Glucometer Devices
- 1.2. Test Strips
- 1.3. Lancets
-
2. Geography
- 2.1. Egypt
- 2.2. Iran
- 2.3. Saudi Arabia
- 2.4. Oman
- 2.5. South Africa
- 2.6. Rest of Middle East and Africa
MEA Self-monitoring Blood Glucose Devices Market Segmentation By Geography
- 1. Egypt
- 2. Iran
- 3. Saudi Arabia
- 4. Oman
- 5. South Africa
- 6. Rest of Middle East and Africa
MEA Self-monitoring Blood Glucose Devices Market REPORT HIGHLIGHTS
| Aspects | Details |
|---|---|
| Study Period | 2019-2033 |
| Base Year | 2024 |
| Estimated Year | 2025 |
| Forecast Period | 2025-2033 |
| Historical Period | 2019-2024 |
| Growth Rate | CAGR of 5.79% from 2019-2033 |
| Segmentation |
|
Table of Contents
- 1. Introduction
- 1.1. Research Scope
- 1.2. Market Segmentation
- 1.3. Research Methodology
- 1.4. Definitions and Assumptions
- 2. Executive Summary
- 2.1. Introduction
- 3. Market Dynamics
- 3.1. Introduction
- 3.2. Market Drivers
- 3.2.1. Rising Prevalence of Cancer Worldwide; Technological Advancements in Diagnostic Testing; Increasing Demand for Point-of-care Treatment
- 3.3. Market Restrains
- 3.3.1. High Cost of Molecular Diagnostic Tests; Lack of Skilled Workforce and Stringent Regulatory Framework
- 3.4. Market Trends
- 3.4.1. Test strips Segment holds Highest Market Share in the current year
- 4. Market Factor Analysis
- 4.1. Porters Five Forces
- 4.2. Supply/Value Chain
- 4.3. PESTEL analysis
- 4.4. Market Entropy
- 4.5. Patent/Trademark Analysis
- 5. Global MEA Self-monitoring Blood Glucose Devices Market Analysis, Insights and Forecast, 2019-2031
- 5.1. Market Analysis, Insights and Forecast - by Component
- 5.1.1. Glucometer Devices
- 5.1.2. Test Strips
- 5.1.3. Lancets
- 5.2. Market Analysis, Insights and Forecast - by Geography
- 5.2.1. Egypt
- 5.2.2. Iran
- 5.2.3. Saudi Arabia
- 5.2.4. Oman
- 5.2.5. South Africa
- 5.2.6. Rest of Middle East and Africa
- 5.3. Market Analysis, Insights and Forecast - by Region
- 5.3.1. Egypt
- 5.3.2. Iran
- 5.3.3. Saudi Arabia
- 5.3.4. Oman
- 5.3.5. South Africa
- 5.3.6. Rest of Middle East and Africa
- 5.1. Market Analysis, Insights and Forecast - by Component
- 6. Egypt MEA Self-monitoring Blood Glucose Devices Market Analysis, Insights and Forecast, 2019-2031
- 6.1. Market Analysis, Insights and Forecast - by Component
- 6.1.1. Glucometer Devices
- 6.1.2. Test Strips
- 6.1.3. Lancets
- 6.2. Market Analysis, Insights and Forecast - by Geography
- 6.2.1. Egypt
- 6.2.2. Iran
- 6.2.3. Saudi Arabia
- 6.2.4. Oman
- 6.2.5. South Africa
- 6.2.6. Rest of Middle East and Africa
- 6.1. Market Analysis, Insights and Forecast - by Component
- 7. Iran MEA Self-monitoring Blood Glucose Devices Market Analysis, Insights and Forecast, 2019-2031
- 7.1. Market Analysis, Insights and Forecast - by Component
- 7.1.1. Glucometer Devices
- 7.1.2. Test Strips
- 7.1.3. Lancets
- 7.2. Market Analysis, Insights and Forecast - by Geography
- 7.2.1. Egypt
- 7.2.2. Iran
- 7.2.3. Saudi Arabia
- 7.2.4. Oman
- 7.2.5. South Africa
- 7.2.6. Rest of Middle East and Africa
- 7.1. Market Analysis, Insights and Forecast - by Component
- 8. Saudi Arabia MEA Self-monitoring Blood Glucose Devices Market Analysis, Insights and Forecast, 2019-2031
- 8.1. Market Analysis, Insights and Forecast - by Component
- 8.1.1. Glucometer Devices
- 8.1.2. Test Strips
- 8.1.3. Lancets
- 8.2. Market Analysis, Insights and Forecast - by Geography
- 8.2.1. Egypt
- 8.2.2. Iran
- 8.2.3. Saudi Arabia
- 8.2.4. Oman
- 8.2.5. South Africa
- 8.2.6. Rest of Middle East and Africa
- 8.1. Market Analysis, Insights and Forecast - by Component
- 9. Oman MEA Self-monitoring Blood Glucose Devices Market Analysis, Insights and Forecast, 2019-2031
- 9.1. Market Analysis, Insights and Forecast - by Component
- 9.1.1. Glucometer Devices
- 9.1.2. Test Strips
- 9.1.3. Lancets
- 9.2. Market Analysis, Insights and Forecast - by Geography
- 9.2.1. Egypt
- 9.2.2. Iran
- 9.2.3. Saudi Arabia
- 9.2.4. Oman
- 9.2.5. South Africa
- 9.2.6. Rest of Middle East and Africa
- 9.1. Market Analysis, Insights and Forecast - by Component
- 10. South Africa MEA Self-monitoring Blood Glucose Devices Market Analysis, Insights and Forecast, 2019-2031
- 10.1. Market Analysis, Insights and Forecast - by Component
- 10.1.1. Glucometer Devices
- 10.1.2. Test Strips
- 10.1.3. Lancets
- 10.2. Market Analysis, Insights and Forecast - by Geography
- 10.2.1. Egypt
- 10.2.2. Iran
- 10.2.3. Saudi Arabia
- 10.2.4. Oman
- 10.2.5. South Africa
- 10.2.6. Rest of Middle East and Africa
- 10.1. Market Analysis, Insights and Forecast - by Component
- 11. Rest of Middle East and Africa MEA Self-monitoring Blood Glucose Devices Market Analysis, Insights and Forecast, 2019-2031
- 11.1. Market Analysis, Insights and Forecast - by Component
- 11.1.1. Glucometer Devices
- 11.1.2. Test Strips
- 11.1.3. Lancets
- 11.2. Market Analysis, Insights and Forecast - by Geography
- 11.2.1. Egypt
- 11.2.2. Iran
- 11.2.3. Saudi Arabia
- 11.2.4. Oman
- 11.2.5. South Africa
- 11.2.6. Rest of Middle East and Africa
- 11.1. Market Analysis, Insights and Forecast - by Component
- 12. North America MEA Self-monitoring Blood Glucose Devices Market Analysis, Insights and Forecast, 2019-2031
- 12.1. Market Analysis, Insights and Forecast - By Country/Sub-region
- 12.1.1 United States
- 12.1.2 Canada
- 12.1.3 Mexico
- 13. Europe MEA Self-monitoring Blood Glucose Devices Market Analysis, Insights and Forecast, 2019-2031
- 13.1. Market Analysis, Insights and Forecast - By Country/Sub-region
- 13.1.1 Germany
- 13.1.2 United Kingdom
- 13.1.3 France
- 13.1.4 Spain
- 13.1.5 Italy
- 13.1.6 Spain
- 13.1.7 Belgium
- 13.1.8 Netherland
- 13.1.9 Nordics
- 13.1.10 Rest of Europe
- 14. Asia Pacific MEA Self-monitoring Blood Glucose Devices Market Analysis, Insights and Forecast, 2019-2031
- 14.1. Market Analysis, Insights and Forecast - By Country/Sub-region
- 14.1.1 China
- 14.1.2 Japan
- 14.1.3 India
- 14.1.4 South Korea
- 14.1.5 Southeast Asia
- 14.1.6 Australia
- 14.1.7 Indonesia
- 14.1.8 Phillipes
- 14.1.9 Singapore
- 14.1.10 Thailandc
- 14.1.11 Rest of Asia Pacific
- 15. South America MEA Self-monitoring Blood Glucose Devices Market Analysis, Insights and Forecast, 2019-2031
- 15.1. Market Analysis, Insights and Forecast - By Country/Sub-region
- 15.1.1 Brazil
- 15.1.2 Argentina
- 15.1.3 Peru
- 15.1.4 Chile
- 15.1.5 Colombia
- 15.1.6 Ecuador
- 15.1.7 Venezuela
- 15.1.8 Rest of South America
- 16. North America MEA Self-monitoring Blood Glucose Devices Market Analysis, Insights and Forecast, 2019-2031
- 16.1. Market Analysis, Insights and Forecast - By Country/Sub-region
- 16.1.1 United States
- 16.1.2 Canada
- 16.1.3 Mexico
- 17. MEA MEA Self-monitoring Blood Glucose Devices Market Analysis, Insights and Forecast, 2019-2031
- 17.1. Market Analysis, Insights and Forecast - By Country/Sub-region
- 17.1.1 United Arab Emirates
- 17.1.2 Saudi Arabia
- 17.1.3 South Africa
- 17.1.4 Rest of Middle East and Africa
- 18. Competitive Analysis
- 18.1. Global Market Share Analysis 2024
- 18.2. Company Profiles
- 18.2.1 Roche Diabetes Care
- 18.2.1.1. Overview
- 18.2.1.2. Products
- 18.2.1.3. SWOT Analysis
- 18.2.1.4. Recent Developments
- 18.2.1.5. Financials (Based on Availability)
- 18.2.2 Abbott Diabetes Care
- 18.2.2.1. Overview
- 18.2.2.2. Products
- 18.2.2.3. SWOT Analysis
- 18.2.2.4. Recent Developments
- 18.2.2.5. Financials (Based on Availability)
- 18.2.3 Medisana
- 18.2.3.1. Overview
- 18.2.3.2. Products
- 18.2.3.3. SWOT Analysis
- 18.2.3.4. Recent Developments
- 18.2.3.5. Financials (Based on Availability)
- 18.2.4 Trivida
- 18.2.4.1. Overview
- 18.2.4.2. Products
- 18.2.4.3. SWOT Analysis
- 18.2.4.4. Recent Developments
- 18.2.4.5. Financials (Based on Availability)
- 18.2.5 Platinum Equity (LifeScan)
- 18.2.5.1. Overview
- 18.2.5.2. Products
- 18.2.5.3. SWOT Analysis
- 18.2.5.4. Recent Developments
- 18.2.5.5. Financials (Based on Availability)
- 18.2.6 Agamatrix Inc
- 18.2.6.1. Overview
- 18.2.6.2. Products
- 18.2.6.3. SWOT Analysis
- 18.2.6.4. Recent Developments
- 18.2.6.5. Financials (Based on Availability)
- 18.2.7 I-Sens
- 18.2.7.1. Overview
- 18.2.7.2. Products
- 18.2.7.3. SWOT Analysis
- 18.2.7.4. Recent Developments
- 18.2.7.5. Financials (Based on Availability)
- 18.2.8 Arkray
- 18.2.8.1. Overview
- 18.2.8.2. Products
- 18.2.8.3. SWOT Analysis
- 18.2.8.4. Recent Developments
- 18.2.8.5. Financials (Based on Availability)
- 18.2.9 Ascensia Diabetes Care
- 18.2.9.1. Overview
- 18.2.9.2. Products
- 18.2.9.3. SWOT Analysis
- 18.2.9.4. Recent Developments
- 18.2.9.5. Financials (Based on Availability)
- 18.2.1 Roche Diabetes Care
List of Figures
- Figure 1: Global MEA Self-monitoring Blood Glucose Devices Market Revenue Breakdown (Million, %) by Region 2024 & 2032
- Figure 2: Global MEA Self-monitoring Blood Glucose Devices Market Volume Breakdown (K Unit, %) by Region 2024 & 2032
- Figure 3: North America MEA Self-monitoring Blood Glucose Devices Market Revenue (Million), by Country 2024 & 2032
- Figure 4: North America MEA Self-monitoring Blood Glucose Devices Market Volume (K Unit), by Country 2024 & 2032
- Figure 5: North America MEA Self-monitoring Blood Glucose Devices Market Revenue Share (%), by Country 2024 & 2032
- Figure 6: North America MEA Self-monitoring Blood Glucose Devices Market Volume Share (%), by Country 2024 & 2032
- Figure 7: Europe MEA Self-monitoring Blood Glucose Devices Market Revenue (Million), by Country 2024 & 2032
- Figure 8: Europe MEA Self-monitoring Blood Glucose Devices Market Volume (K Unit), by Country 2024 & 2032
- Figure 9: Europe MEA Self-monitoring Blood Glucose Devices Market Revenue Share (%), by Country 2024 & 2032
- Figure 10: Europe MEA Self-monitoring Blood Glucose Devices Market Volume Share (%), by Country 2024 & 2032
- Figure 11: Asia Pacific MEA Self-monitoring Blood Glucose Devices Market Revenue (Million), by Country 2024 & 2032
- Figure 12: Asia Pacific MEA Self-monitoring Blood Glucose Devices Market Volume (K Unit), by Country 2024 & 2032
- Figure 13: Asia Pacific MEA Self-monitoring Blood Glucose Devices Market Revenue Share (%), by Country 2024 & 2032
- Figure 14: Asia Pacific MEA Self-monitoring Blood Glucose Devices Market Volume Share (%), by Country 2024 & 2032
- Figure 15: South America MEA Self-monitoring Blood Glucose Devices Market Revenue (Million), by Country 2024 & 2032
- Figure 16: South America MEA Self-monitoring Blood Glucose Devices Market Volume (K Unit), by Country 2024 & 2032
- Figure 17: South America MEA Self-monitoring Blood Glucose Devices Market Revenue Share (%), by Country 2024 & 2032
- Figure 18: South America MEA Self-monitoring Blood Glucose Devices Market Volume Share (%), by Country 2024 & 2032
- Figure 19: North America MEA Self-monitoring Blood Glucose Devices Market Revenue (Million), by Country 2024 & 2032
- Figure 20: North America MEA Self-monitoring Blood Glucose Devices Market Volume (K Unit), by Country 2024 & 2032
- Figure 21: North America MEA Self-monitoring Blood Glucose Devices Market Revenue Share (%), by Country 2024 & 2032
- Figure 22: North America MEA Self-monitoring Blood Glucose Devices Market Volume Share (%), by Country 2024 & 2032
- Figure 23: MEA MEA Self-monitoring Blood Glucose Devices Market Revenue (Million), by Country 2024 & 2032
- Figure 24: MEA MEA Self-monitoring Blood Glucose Devices Market Volume (K Unit), by Country 2024 & 2032
- Figure 25: MEA MEA Self-monitoring Blood Glucose Devices Market Revenue Share (%), by Country 2024 & 2032
- Figure 26: MEA MEA Self-monitoring Blood Glucose Devices Market Volume Share (%), by Country 2024 & 2032
- Figure 27: Egypt MEA Self-monitoring Blood Glucose Devices Market Revenue (Million), by Component 2024 & 2032
- Figure 28: Egypt MEA Self-monitoring Blood Glucose Devices Market Volume (K Unit), by Component 2024 & 2032
- Figure 29: Egypt MEA Self-monitoring Blood Glucose Devices Market Revenue Share (%), by Component 2024 & 2032
- Figure 30: Egypt MEA Self-monitoring Blood Glucose Devices Market Volume Share (%), by Component 2024 & 2032
- Figure 31: Egypt MEA Self-monitoring Blood Glucose Devices Market Revenue (Million), by Geography 2024 & 2032
- Figure 32: Egypt MEA Self-monitoring Blood Glucose Devices Market Volume (K Unit), by Geography 2024 & 2032
- Figure 33: Egypt MEA Self-monitoring Blood Glucose Devices Market Revenue Share (%), by Geography 2024 & 2032
- Figure 34: Egypt MEA Self-monitoring Blood Glucose Devices Market Volume Share (%), by Geography 2024 & 2032
- Figure 35: Egypt MEA Self-monitoring Blood Glucose Devices Market Revenue (Million), by Country 2024 & 2032
- Figure 36: Egypt MEA Self-monitoring Blood Glucose Devices Market Volume (K Unit), by Country 2024 & 2032
- Figure 37: Egypt MEA Self-monitoring Blood Glucose Devices Market Revenue Share (%), by Country 2024 & 2032
- Figure 38: Egypt MEA Self-monitoring Blood Glucose Devices Market Volume Share (%), by Country 2024 & 2032
- Figure 39: Iran MEA Self-monitoring Blood Glucose Devices Market Revenue (Million), by Component 2024 & 2032
- Figure 40: Iran MEA Self-monitoring Blood Glucose Devices Market Volume (K Unit), by Component 2024 & 2032
- Figure 41: Iran MEA Self-monitoring Blood Glucose Devices Market Revenue Share (%), by Component 2024 & 2032
- Figure 42: Iran MEA Self-monitoring Blood Glucose Devices Market Volume Share (%), by Component 2024 & 2032
- Figure 43: Iran MEA Self-monitoring Blood Glucose Devices Market Revenue (Million), by Geography 2024 & 2032
- Figure 44: Iran MEA Self-monitoring Blood Glucose Devices Market Volume (K Unit), by Geography 2024 & 2032
- Figure 45: Iran MEA Self-monitoring Blood Glucose Devices Market Revenue Share (%), by Geography 2024 & 2032
- Figure 46: Iran MEA Self-monitoring Blood Glucose Devices Market Volume Share (%), by Geography 2024 & 2032
- Figure 47: Iran MEA Self-monitoring Blood Glucose Devices Market Revenue (Million), by Country 2024 & 2032
- Figure 48: Iran MEA Self-monitoring Blood Glucose Devices Market Volume (K Unit), by Country 2024 & 2032
- Figure 49: Iran MEA Self-monitoring Blood Glucose Devices Market Revenue Share (%), by Country 2024 & 2032
- Figure 50: Iran MEA Self-monitoring Blood Glucose Devices Market Volume Share (%), by Country 2024 & 2032
- Figure 51: Saudi Arabia MEA Self-monitoring Blood Glucose Devices Market Revenue (Million), by Component 2024 & 2032
- Figure 52: Saudi Arabia MEA Self-monitoring Blood Glucose Devices Market Volume (K Unit), by Component 2024 & 2032
- Figure 53: Saudi Arabia MEA Self-monitoring Blood Glucose Devices Market Revenue Share (%), by Component 2024 & 2032
- Figure 54: Saudi Arabia MEA Self-monitoring Blood Glucose Devices Market Volume Share (%), by Component 2024 & 2032
- Figure 55: Saudi Arabia MEA Self-monitoring Blood Glucose Devices Market Revenue (Million), by Geography 2024 & 2032
- Figure 56: Saudi Arabia MEA Self-monitoring Blood Glucose Devices Market Volume (K Unit), by Geography 2024 & 2032
- Figure 57: Saudi Arabia MEA Self-monitoring Blood Glucose Devices Market Revenue Share (%), by Geography 2024 & 2032
- Figure 58: Saudi Arabia MEA Self-monitoring Blood Glucose Devices Market Volume Share (%), by Geography 2024 & 2032
- Figure 59: Saudi Arabia MEA Self-monitoring Blood Glucose Devices Market Revenue (Million), by Country 2024 & 2032
- Figure 60: Saudi Arabia MEA Self-monitoring Blood Glucose Devices Market Volume (K Unit), by Country 2024 & 2032
- Figure 61: Saudi Arabia MEA Self-monitoring Blood Glucose Devices Market Revenue Share (%), by Country 2024 & 2032
- Figure 62: Saudi Arabia MEA Self-monitoring Blood Glucose Devices Market Volume Share (%), by Country 2024 & 2032
- Figure 63: Oman MEA Self-monitoring Blood Glucose Devices Market Revenue (Million), by Component 2024 & 2032
- Figure 64: Oman MEA Self-monitoring Blood Glucose Devices Market Volume (K Unit), by Component 2024 & 2032
- Figure 65: Oman MEA Self-monitoring Blood Glucose Devices Market Revenue Share (%), by Component 2024 & 2032
- Figure 66: Oman MEA Self-monitoring Blood Glucose Devices Market Volume Share (%), by Component 2024 & 2032
- Figure 67: Oman MEA Self-monitoring Blood Glucose Devices Market Revenue (Million), by Geography 2024 & 2032
- Figure 68: Oman MEA Self-monitoring Blood Glucose Devices Market Volume (K Unit), by Geography 2024 & 2032
- Figure 69: Oman MEA Self-monitoring Blood Glucose Devices Market Revenue Share (%), by Geography 2024 & 2032
- Figure 70: Oman MEA Self-monitoring Blood Glucose Devices Market Volume Share (%), by Geography 2024 & 2032
- Figure 71: Oman MEA Self-monitoring Blood Glucose Devices Market Revenue (Million), by Country 2024 & 2032
- Figure 72: Oman MEA Self-monitoring Blood Glucose Devices Market Volume (K Unit), by Country 2024 & 2032
- Figure 73: Oman MEA Self-monitoring Blood Glucose Devices Market Revenue Share (%), by Country 2024 & 2032
- Figure 74: Oman MEA Self-monitoring Blood Glucose Devices Market Volume Share (%), by Country 2024 & 2032
- Figure 75: South Africa MEA Self-monitoring Blood Glucose Devices Market Revenue (Million), by Component 2024 & 2032
- Figure 76: South Africa MEA Self-monitoring Blood Glucose Devices Market Volume (K Unit), by Component 2024 & 2032
- Figure 77: South Africa MEA Self-monitoring Blood Glucose Devices Market Revenue Share (%), by Component 2024 & 2032
- Figure 78: South Africa MEA Self-monitoring Blood Glucose Devices Market Volume Share (%), by Component 2024 & 2032
- Figure 79: South Africa MEA Self-monitoring Blood Glucose Devices Market Revenue (Million), by Geography 2024 & 2032
- Figure 80: South Africa MEA Self-monitoring Blood Glucose Devices Market Volume (K Unit), by Geography 2024 & 2032
- Figure 81: South Africa MEA Self-monitoring Blood Glucose Devices Market Revenue Share (%), by Geography 2024 & 2032
- Figure 82: South Africa MEA Self-monitoring Blood Glucose Devices Market Volume Share (%), by Geography 2024 & 2032
- Figure 83: South Africa MEA Self-monitoring Blood Glucose Devices Market Revenue (Million), by Country 2024 & 2032
- Figure 84: South Africa MEA Self-monitoring Blood Glucose Devices Market Volume (K Unit), by Country 2024 & 2032
- Figure 85: South Africa MEA Self-monitoring Blood Glucose Devices Market Revenue Share (%), by Country 2024 & 2032
- Figure 86: South Africa MEA Self-monitoring Blood Glucose Devices Market Volume Share (%), by Country 2024 & 2032
- Figure 87: Rest of Middle East and Africa MEA Self-monitoring Blood Glucose Devices Market Revenue (Million), by Component 2024 & 2032
- Figure 88: Rest of Middle East and Africa MEA Self-monitoring Blood Glucose Devices Market Volume (K Unit), by Component 2024 & 2032
- Figure 89: Rest of Middle East and Africa MEA Self-monitoring Blood Glucose Devices Market Revenue Share (%), by Component 2024 & 2032
- Figure 90: Rest of Middle East and Africa MEA Self-monitoring Blood Glucose Devices Market Volume Share (%), by Component 2024 & 2032
- Figure 91: Rest of Middle East and Africa MEA Self-monitoring Blood Glucose Devices Market Revenue (Million), by Geography 2024 & 2032
- Figure 92: Rest of Middle East and Africa MEA Self-monitoring Blood Glucose Devices Market Volume (K Unit), by Geography 2024 & 2032
- Figure 93: Rest of Middle East and Africa MEA Self-monitoring Blood Glucose Devices Market Revenue Share (%), by Geography 2024 & 2032
- Figure 94: Rest of Middle East and Africa MEA Self-monitoring Blood Glucose Devices Market Volume Share (%), by Geography 2024 & 2032
- Figure 95: Rest of Middle East and Africa MEA Self-monitoring Blood Glucose Devices Market Revenue (Million), by Country 2024 & 2032
- Figure 96: Rest of Middle East and Africa MEA Self-monitoring Blood Glucose Devices Market Volume (K Unit), by Country 2024 & 2032
- Figure 97: Rest of Middle East and Africa MEA Self-monitoring Blood Glucose Devices Market Revenue Share (%), by Country 2024 & 2032
- Figure 98: Rest of Middle East and Africa MEA Self-monitoring Blood Glucose Devices Market Volume Share (%), by Country 2024 & 2032
List of Tables
- Table 1: Global MEA Self-monitoring Blood Glucose Devices Market Revenue Million Forecast, by Region 2019 & 2032
- Table 2: Global MEA Self-monitoring Blood Glucose Devices Market Volume K Unit Forecast, by Region 2019 & 2032
- Table 3: Global MEA Self-monitoring Blood Glucose Devices Market Revenue Million Forecast, by Component 2019 & 2032
- Table 4: Global MEA Self-monitoring Blood Glucose Devices Market Volume K Unit Forecast, by Component 2019 & 2032
- Table 5: Global MEA Self-monitoring Blood Glucose Devices Market Revenue Million Forecast, by Geography 2019 & 2032
- Table 6: Global MEA Self-monitoring Blood Glucose Devices Market Volume K Unit Forecast, by Geography 2019 & 2032
- Table 7: Global MEA Self-monitoring Blood Glucose Devices Market Revenue Million Forecast, by Region 2019 & 2032
- Table 8: Global MEA Self-monitoring Blood Glucose Devices Market Volume K Unit Forecast, by Region 2019 & 2032
- Table 9: Global MEA Self-monitoring Blood Glucose Devices Market Revenue Million Forecast, by Country 2019 & 2032
- Table 10: Global MEA Self-monitoring Blood Glucose Devices Market Volume K Unit Forecast, by Country 2019 & 2032
- Table 11: United States MEA Self-monitoring Blood Glucose Devices Market Revenue (Million) Forecast, by Application 2019 & 2032
- Table 12: United States MEA Self-monitoring Blood Glucose Devices Market Volume (K Unit) Forecast, by Application 2019 & 2032
- Table 13: Canada MEA Self-monitoring Blood Glucose Devices Market Revenue (Million) Forecast, by Application 2019 & 2032
- Table 14: Canada MEA Self-monitoring Blood Glucose Devices Market Volume (K Unit) Forecast, by Application 2019 & 2032
- Table 15: Mexico MEA Self-monitoring Blood Glucose Devices Market Revenue (Million) Forecast, by Application 2019 & 2032
- Table 16: Mexico MEA Self-monitoring Blood Glucose Devices Market Volume (K Unit) Forecast, by Application 2019 & 2032
- Table 17: Global MEA Self-monitoring Blood Glucose Devices Market Revenue Million Forecast, by Country 2019 & 2032
- Table 18: Global MEA Self-monitoring Blood Glucose Devices Market Volume K Unit Forecast, by Country 2019 & 2032
- Table 19: Germany MEA Self-monitoring Blood Glucose Devices Market Revenue (Million) Forecast, by Application 2019 & 2032
- Table 20: Germany MEA Self-monitoring Blood Glucose Devices Market Volume (K Unit) Forecast, by Application 2019 & 2032
- Table 21: United Kingdom MEA Self-monitoring Blood Glucose Devices Market Revenue (Million) Forecast, by Application 2019 & 2032
- Table 22: United Kingdom MEA Self-monitoring Blood Glucose Devices Market Volume (K Unit) Forecast, by Application 2019 & 2032
- Table 23: France MEA Self-monitoring Blood Glucose Devices Market Revenue (Million) Forecast, by Application 2019 & 2032
- Table 24: France MEA Self-monitoring Blood Glucose Devices Market Volume (K Unit) Forecast, by Application 2019 & 2032
- Table 25: Spain MEA Self-monitoring Blood Glucose Devices Market Revenue (Million) Forecast, by Application 2019 & 2032
- Table 26: Spain MEA Self-monitoring Blood Glucose Devices Market Volume (K Unit) Forecast, by Application 2019 & 2032
- Table 27: Italy MEA Self-monitoring Blood Glucose Devices Market Revenue (Million) Forecast, by Application 2019 & 2032
- Table 28: Italy MEA Self-monitoring Blood Glucose Devices Market Volume (K Unit) Forecast, by Application 2019 & 2032
- Table 29: Spain MEA Self-monitoring Blood Glucose Devices Market Revenue (Million) Forecast, by Application 2019 & 2032
- Table 30: Spain MEA Self-monitoring Blood Glucose Devices Market Volume (K Unit) Forecast, by Application 2019 & 2032
- Table 31: Belgium MEA Self-monitoring Blood Glucose Devices Market Revenue (Million) Forecast, by Application 2019 & 2032
- Table 32: Belgium MEA Self-monitoring Blood Glucose Devices Market Volume (K Unit) Forecast, by Application 2019 & 2032
- Table 33: Netherland MEA Self-monitoring Blood Glucose Devices Market Revenue (Million) Forecast, by Application 2019 & 2032
- Table 34: Netherland MEA Self-monitoring Blood Glucose Devices Market Volume (K Unit) Forecast, by Application 2019 & 2032
- Table 35: Nordics MEA Self-monitoring Blood Glucose Devices Market Revenue (Million) Forecast, by Application 2019 & 2032
- Table 36: Nordics MEA Self-monitoring Blood Glucose Devices Market Volume (K Unit) Forecast, by Application 2019 & 2032
- Table 37: Rest of Europe MEA Self-monitoring Blood Glucose Devices Market Revenue (Million) Forecast, by Application 2019 & 2032
- Table 38: Rest of Europe MEA Self-monitoring Blood Glucose Devices Market Volume (K Unit) Forecast, by Application 2019 & 2032
- Table 39: Global MEA Self-monitoring Blood Glucose Devices Market Revenue Million Forecast, by Country 2019 & 2032
- Table 40: Global MEA Self-monitoring Blood Glucose Devices Market Volume K Unit Forecast, by Country 2019 & 2032
- Table 41: China MEA Self-monitoring Blood Glucose Devices Market Revenue (Million) Forecast, by Application 2019 & 2032
- Table 42: China MEA Self-monitoring Blood Glucose Devices Market Volume (K Unit) Forecast, by Application 2019 & 2032
- Table 43: Japan MEA Self-monitoring Blood Glucose Devices Market Revenue (Million) Forecast, by Application 2019 & 2032
- Table 44: Japan MEA Self-monitoring Blood Glucose Devices Market Volume (K Unit) Forecast, by Application 2019 & 2032
- Table 45: India MEA Self-monitoring Blood Glucose Devices Market Revenue (Million) Forecast, by Application 2019 & 2032
- Table 46: India MEA Self-monitoring Blood Glucose Devices Market Volume (K Unit) Forecast, by Application 2019 & 2032
- Table 47: South Korea MEA Self-monitoring Blood Glucose Devices Market Revenue (Million) Forecast, by Application 2019 & 2032
- Table 48: South Korea MEA Self-monitoring Blood Glucose Devices Market Volume (K Unit) Forecast, by Application 2019 & 2032
- Table 49: Southeast Asia MEA Self-monitoring Blood Glucose Devices Market Revenue (Million) Forecast, by Application 2019 & 2032
- Table 50: Southeast Asia MEA Self-monitoring Blood Glucose Devices Market Volume (K Unit) Forecast, by Application 2019 & 2032
- Table 51: Australia MEA Self-monitoring Blood Glucose Devices Market Revenue (Million) Forecast, by Application 2019 & 2032
- Table 52: Australia MEA Self-monitoring Blood Glucose Devices Market Volume (K Unit) Forecast, by Application 2019 & 2032
- Table 53: Indonesia MEA Self-monitoring Blood Glucose Devices Market Revenue (Million) Forecast, by Application 2019 & 2032
- Table 54: Indonesia MEA Self-monitoring Blood Glucose Devices Market Volume (K Unit) Forecast, by Application 2019 & 2032
- Table 55: Phillipes MEA Self-monitoring Blood Glucose Devices Market Revenue (Million) Forecast, by Application 2019 & 2032
- Table 56: Phillipes MEA Self-monitoring Blood Glucose Devices Market Volume (K Unit) Forecast, by Application 2019 & 2032
- Table 57: Singapore MEA Self-monitoring Blood Glucose Devices Market Revenue (Million) Forecast, by Application 2019 & 2032
- Table 58: Singapore MEA Self-monitoring Blood Glucose Devices Market Volume (K Unit) Forecast, by Application 2019 & 2032
- Table 59: Thailandc MEA Self-monitoring Blood Glucose Devices Market Revenue (Million) Forecast, by Application 2019 & 2032
- Table 60: Thailandc MEA Self-monitoring Blood Glucose Devices Market Volume (K Unit) Forecast, by Application 2019 & 2032
- Table 61: Rest of Asia Pacific MEA Self-monitoring Blood Glucose Devices Market Revenue (Million) Forecast, by Application 2019 & 2032
- Table 62: Rest of Asia Pacific MEA Self-monitoring Blood Glucose Devices Market Volume (K Unit) Forecast, by Application 2019 & 2032
- Table 63: Global MEA Self-monitoring Blood Glucose Devices Market Revenue Million Forecast, by Country 2019 & 2032
- Table 64: Global MEA Self-monitoring Blood Glucose Devices Market Volume K Unit Forecast, by Country 2019 & 2032
- Table 65: Brazil MEA Self-monitoring Blood Glucose Devices Market Revenue (Million) Forecast, by Application 2019 & 2032
- Table 66: Brazil MEA Self-monitoring Blood Glucose Devices Market Volume (K Unit) Forecast, by Application 2019 & 2032
- Table 67: Argentina MEA Self-monitoring Blood Glucose Devices Market Revenue (Million) Forecast, by Application 2019 & 2032
- Table 68: Argentina MEA Self-monitoring Blood Glucose Devices Market Volume (K Unit) Forecast, by Application 2019 & 2032
- Table 69: Peru MEA Self-monitoring Blood Glucose Devices Market Revenue (Million) Forecast, by Application 2019 & 2032
- Table 70: Peru MEA Self-monitoring Blood Glucose Devices Market Volume (K Unit) Forecast, by Application 2019 & 2032
- Table 71: Chile MEA Self-monitoring Blood Glucose Devices Market Revenue (Million) Forecast, by Application 2019 & 2032
- Table 72: Chile MEA Self-monitoring Blood Glucose Devices Market Volume (K Unit) Forecast, by Application 2019 & 2032
- Table 73: Colombia MEA Self-monitoring Blood Glucose Devices Market Revenue (Million) Forecast, by Application 2019 & 2032
- Table 74: Colombia MEA Self-monitoring Blood Glucose Devices Market Volume (K Unit) Forecast, by Application 2019 & 2032
- Table 75: Ecuador MEA Self-monitoring Blood Glucose Devices Market Revenue (Million) Forecast, by Application 2019 & 2032
- Table 76: Ecuador MEA Self-monitoring Blood Glucose Devices Market Volume (K Unit) Forecast, by Application 2019 & 2032
- Table 77: Venezuela MEA Self-monitoring Blood Glucose Devices Market Revenue (Million) Forecast, by Application 2019 & 2032
- Table 78: Venezuela MEA Self-monitoring Blood Glucose Devices Market Volume (K Unit) Forecast, by Application 2019 & 2032
- Table 79: Rest of South America MEA Self-monitoring Blood Glucose Devices Market Revenue (Million) Forecast, by Application 2019 & 2032
- Table 80: Rest of South America MEA Self-monitoring Blood Glucose Devices Market Volume (K Unit) Forecast, by Application 2019 & 2032
- Table 81: Global MEA Self-monitoring Blood Glucose Devices Market Revenue Million Forecast, by Country 2019 & 2032
- Table 82: Global MEA Self-monitoring Blood Glucose Devices Market Volume K Unit Forecast, by Country 2019 & 2032
- Table 83: United States MEA Self-monitoring Blood Glucose Devices Market Revenue (Million) Forecast, by Application 2019 & 2032
- Table 84: United States MEA Self-monitoring Blood Glucose Devices Market Volume (K Unit) Forecast, by Application 2019 & 2032
- Table 85: Canada MEA Self-monitoring Blood Glucose Devices Market Revenue (Million) Forecast, by Application 2019 & 2032
- Table 86: Canada MEA Self-monitoring Blood Glucose Devices Market Volume (K Unit) Forecast, by Application 2019 & 2032
- Table 87: Mexico MEA Self-monitoring Blood Glucose Devices Market Revenue (Million) Forecast, by Application 2019 & 2032
- Table 88: Mexico MEA Self-monitoring Blood Glucose Devices Market Volume (K Unit) Forecast, by Application 2019 & 2032
- Table 89: Global MEA Self-monitoring Blood Glucose Devices Market Revenue Million Forecast, by Country 2019 & 2032
- Table 90: Global MEA Self-monitoring Blood Glucose Devices Market Volume K Unit Forecast, by Country 2019 & 2032
- Table 91: United Arab Emirates MEA Self-monitoring Blood Glucose Devices Market Revenue (Million) Forecast, by Application 2019 & 2032
- Table 92: United Arab Emirates MEA Self-monitoring Blood Glucose Devices Market Volume (K Unit) Forecast, by Application 2019 & 2032
- Table 93: Saudi Arabia MEA Self-monitoring Blood Glucose Devices Market Revenue (Million) Forecast, by Application 2019 & 2032
- Table 94: Saudi Arabia MEA Self-monitoring Blood Glucose Devices Market Volume (K Unit) Forecast, by Application 2019 & 2032
- Table 95: South Africa MEA Self-monitoring Blood Glucose Devices Market Revenue (Million) Forecast, by Application 2019 & 2032
- Table 96: South Africa MEA Self-monitoring Blood Glucose Devices Market Volume (K Unit) Forecast, by Application 2019 & 2032
- Table 97: Rest of Middle East and Africa MEA Self-monitoring Blood Glucose Devices Market Revenue (Million) Forecast, by Application 2019 & 2032
- Table 98: Rest of Middle East and Africa MEA Self-monitoring Blood Glucose Devices Market Volume (K Unit) Forecast, by Application 2019 & 2032
- Table 99: Global MEA Self-monitoring Blood Glucose Devices Market Revenue Million Forecast, by Component 2019 & 2032
- Table 100: Global MEA Self-monitoring Blood Glucose Devices Market Volume K Unit Forecast, by Component 2019 & 2032
- Table 101: Global MEA Self-monitoring Blood Glucose Devices Market Revenue Million Forecast, by Geography 2019 & 2032
- Table 102: Global MEA Self-monitoring Blood Glucose Devices Market Volume K Unit Forecast, by Geography 2019 & 2032
- Table 103: Global MEA Self-monitoring Blood Glucose Devices Market Revenue Million Forecast, by Country 2019 & 2032
- Table 104: Global MEA Self-monitoring Blood Glucose Devices Market Volume K Unit Forecast, by Country 2019 & 2032
- Table 105: Global MEA Self-monitoring Blood Glucose Devices Market Revenue Million Forecast, by Component 2019 & 2032
- Table 106: Global MEA Self-monitoring Blood Glucose Devices Market Volume K Unit Forecast, by Component 2019 & 2032
- Table 107: Global MEA Self-monitoring Blood Glucose Devices Market Revenue Million Forecast, by Geography 2019 & 2032
- Table 108: Global MEA Self-monitoring Blood Glucose Devices Market Volume K Unit Forecast, by Geography 2019 & 2032
- Table 109: Global MEA Self-monitoring Blood Glucose Devices Market Revenue Million Forecast, by Country 2019 & 2032
- Table 110: Global MEA Self-monitoring Blood Glucose Devices Market Volume K Unit Forecast, by Country 2019 & 2032
- Table 111: Global MEA Self-monitoring Blood Glucose Devices Market Revenue Million Forecast, by Component 2019 & 2032
- Table 112: Global MEA Self-monitoring Blood Glucose Devices Market Volume K Unit Forecast, by Component 2019 & 2032
- Table 113: Global MEA Self-monitoring Blood Glucose Devices Market Revenue Million Forecast, by Geography 2019 & 2032
- Table 114: Global MEA Self-monitoring Blood Glucose Devices Market Volume K Unit Forecast, by Geography 2019 & 2032
- Table 115: Global MEA Self-monitoring Blood Glucose Devices Market Revenue Million Forecast, by Country 2019 & 2032
- Table 116: Global MEA Self-monitoring Blood Glucose Devices Market Volume K Unit Forecast, by Country 2019 & 2032
- Table 117: Global MEA Self-monitoring Blood Glucose Devices Market Revenue Million Forecast, by Component 2019 & 2032
- Table 118: Global MEA Self-monitoring Blood Glucose Devices Market Volume K Unit Forecast, by Component 2019 & 2032
- Table 119: Global MEA Self-monitoring Blood Glucose Devices Market Revenue Million Forecast, by Geography 2019 & 2032
- Table 120: Global MEA Self-monitoring Blood Glucose Devices Market Volume K Unit Forecast, by Geography 2019 & 2032
- Table 121: Global MEA Self-monitoring Blood Glucose Devices Market Revenue Million Forecast, by Country 2019 & 2032
- Table 122: Global MEA Self-monitoring Blood Glucose Devices Market Volume K Unit Forecast, by Country 2019 & 2032
- Table 123: Global MEA Self-monitoring Blood Glucose Devices Market Revenue Million Forecast, by Component 2019 & 2032
- Table 124: Global MEA Self-monitoring Blood Glucose Devices Market Volume K Unit Forecast, by Component 2019 & 2032
- Table 125: Global MEA Self-monitoring Blood Glucose Devices Market Revenue Million Forecast, by Geography 2019 & 2032
- Table 126: Global MEA Self-monitoring Blood Glucose Devices Market Volume K Unit Forecast, by Geography 2019 & 2032
- Table 127: Global MEA Self-monitoring Blood Glucose Devices Market Revenue Million Forecast, by Country 2019 & 2032
- Table 128: Global MEA Self-monitoring Blood Glucose Devices Market Volume K Unit Forecast, by Country 2019 & 2032
- Table 129: Global MEA Self-monitoring Blood Glucose Devices Market Revenue Million Forecast, by Component 2019 & 2032
- Table 130: Global MEA Self-monitoring Blood Glucose Devices Market Volume K Unit Forecast, by Component 2019 & 2032
- Table 131: Global MEA Self-monitoring Blood Glucose Devices Market Revenue Million Forecast, by Geography 2019 & 2032
- Table 132: Global MEA Self-monitoring Blood Glucose Devices Market Volume K Unit Forecast, by Geography 2019 & 2032
- Table 133: Global MEA Self-monitoring Blood Glucose Devices Market Revenue Million Forecast, by Country 2019 & 2032
- Table 134: Global MEA Self-monitoring Blood Glucose Devices Market Volume K Unit Forecast, by Country 2019 & 2032
Frequently Asked Questions
1. What is the projected Compound Annual Growth Rate (CAGR) of the MEA Self-monitoring Blood Glucose Devices Market?
The projected CAGR is approximately 5.79%.
2. Which companies are prominent players in the MEA Self-monitoring Blood Glucose Devices Market?
Key companies in the market include Roche Diabetes Care, Abbott Diabetes Care, Medisana, Trivida, Platinum Equity (LifeScan), Agamatrix Inc, I-Sens, Arkray, Ascensia Diabetes Care.
3. What are the main segments of the MEA Self-monitoring Blood Glucose Devices Market?
The market segments include Component, Geography.
4. Can you provide details about the market size?
The market size is estimated to be USD 253.12 Million as of 2022.
5. What are some drivers contributing to market growth?
Rising Prevalence of Cancer Worldwide; Technological Advancements in Diagnostic Testing; Increasing Demand for Point-of-care Treatment.
6. What are the notable trends driving market growth?
Test strips Segment holds Highest Market Share in the current year.
7. Are there any restraints impacting market growth?
High Cost of Molecular Diagnostic Tests; Lack of Skilled Workforce and Stringent Regulatory Framework.
8. Can you provide examples of recent developments in the market?
October 2023: the World Health Organization (WHO) unveiled an updated list of essential diagnostics, which included new guidelines for personal use glucose meters. The WHO advised incorporating personal use glucose monitoring devices into the existing medical recommendations for diabetes.
9. What pricing options are available for accessing the report?
Pricing options include single-user, multi-user, and enterprise licenses priced at USD 4750, USD 5250, and USD 8750 respectively.
10. Is the market size provided in terms of value or volume?
The market size is provided in terms of value, measured in Million and volume, measured in K Unit.
11. Are there any specific market keywords associated with the report?
Yes, the market keyword associated with the report is "MEA Self-monitoring Blood Glucose Devices Market," which aids in identifying and referencing the specific market segment covered.
12. How do I determine which pricing option suits my needs best?
The pricing options vary based on user requirements and access needs. Individual users may opt for single-user licenses, while businesses requiring broader access may choose multi-user or enterprise licenses for cost-effective access to the report.
13. Are there any additional resources or data provided in the MEA Self-monitoring Blood Glucose Devices Market report?
While the report offers comprehensive insights, it's advisable to review the specific contents or supplementary materials provided to ascertain if additional resources or data are available.
14. How can I stay updated on further developments or reports in the MEA Self-monitoring Blood Glucose Devices Market?
To stay informed about further developments, trends, and reports in the MEA Self-monitoring Blood Glucose Devices Market, consider subscribing to industry newsletters, following relevant companies and organizations, or regularly checking reputable industry news sources and publications.
Methodology
Step 1 - Identification of Relevant Samples Size from Population Database


Step 2 - Approaches for Defining Global Market Size (Value, Volume* & Price*)

Note*: In applicable scenarios
Step 3 - Data Sources
Primary Research
- Web Analytics
- Survey Reports
- Research Institute
- Latest Research Reports
- Opinion Leaders
Secondary Research
- Annual Reports
- White Paper
- Latest Press Release
- Industry Association
- Paid Database
- Investor Presentations

Step 4 - Data Triangulation
Involves using different sources of information in order to increase the validity of a study
These sources are likely to be stakeholders in a program - participants, other researchers, program staff, other community members, and so on.
Then we put all data in single framework & apply various statistical tools to find out the dynamic on the market.
During the analysis stage, feedback from the stakeholder groups would be compared to determine areas of agreement as well as areas of divergence


