

Key Insights
The global hypoxia treatment market is poised for robust expansion, driven by increasing respiratory disease prevalence and technological innovation. Forecasted to reach $15.27 billion by 2025, the market is expected to grow at a Compound Annual Growth Rate (CAGR) of 7.06%. Key growth drivers include the rising incidence of chronic respiratory conditions like COPD, pneumonia, and asthma, necessitating effective treatment interventions. Advances in oxygen therapy, including portable concentrators and home ventilation, are enhancing patient care and market penetration. The aging global population, more vulnerable to respiratory ailments, further bolsters demand. The market is segmented by hypoxia type (hypoxic, anemic, stagnant, histotoxic), disease indication (COPD, pneumonia, asthma, others), and end-user (hospitals/clinics, others). While high treatment costs and regional access limitations present challenges, market expansion is anticipated.
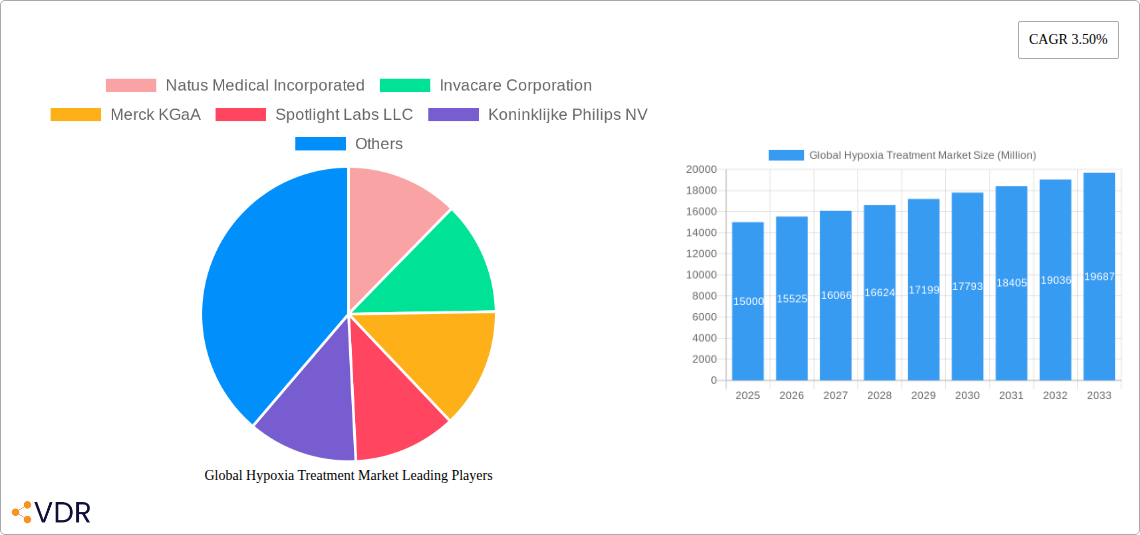
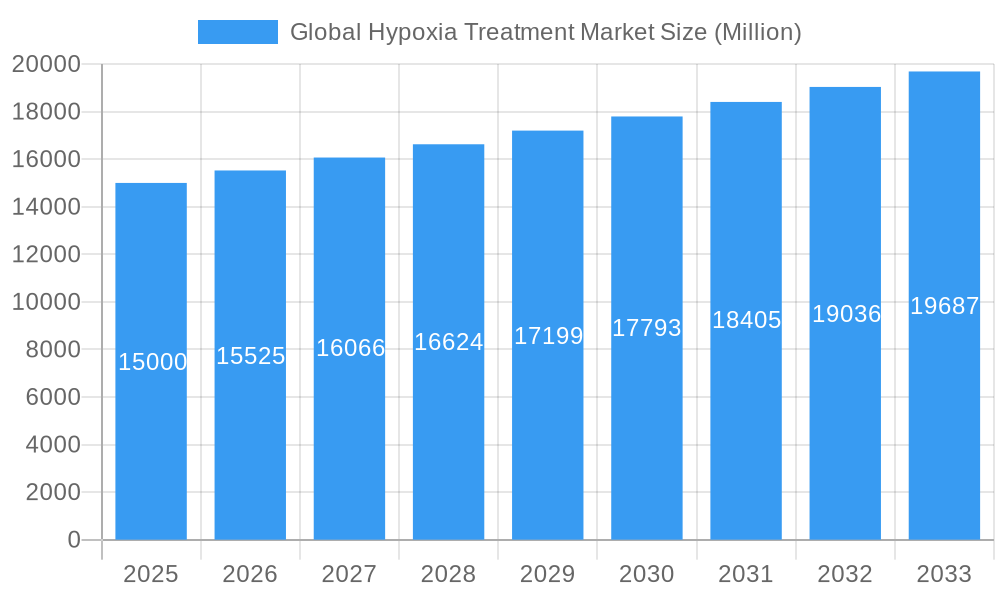
Global Hypoxia Treatment Market Market Size (In Billion)
North America and Europe currently lead the market due to developed healthcare infrastructure and significant expenditure. However, the Asia-Pacific region presents substantial growth opportunities, fueled by its rapidly advancing healthcare sector and increasing respiratory disease burden. The competitive landscape features established medical device manufacturers and specialized treatment providers, including Natus Medical Incorporated, Invacare Corporation, and Koninklijke Philips NV. Future growth will be shaped by ongoing research into novel therapeutic strategies, a stronger focus on early diagnosis and prevention of respiratory diseases, and efforts to expand healthcare access in underserved areas. Despite affordability and accessibility challenges, sustained demand from rising respiratory disease rates and continuous technological advancements will ensure continued market growth, fostering further innovation in hypoxia treatment efficacy and cost-effectiveness.
Global Hypoxia Treatment Market Company Market Share
Global Hypoxia Treatment Market: A Comprehensive Report (2019-2033)
This comprehensive report provides an in-depth analysis of the global hypoxia treatment market, encompassing market dynamics, growth trends, regional analysis, product landscape, key players, and future outlook. The report covers the period from 2019 to 2033, with a focus on the forecast period 2025-2033, using 2025 as the base year. The market is segmented by type (Hypoxic Hypoxia, Anaemic Hypoxia, Stagnant Hypoxia, Histotoxic Hypoxia), disease type (Chronic Obstructive Pulmonary Disease (COPD), Pneumonia, Asthma, Others), and end-user (Hospitals/Clinics, Others). The total market size is projected to reach xx Million by 2033.
Global Hypoxia Treatment Market Market Dynamics & Structure
The global hypoxia treatment market is a dynamic landscape shaped by several intertwined factors. Market concentration is moderately high, with a few major players dominating specific segments. Technological innovation, particularly in portable oxygen concentrators and non-invasive ventilation, is a significant growth driver. Stringent regulatory frameworks governing medical devices impact market entry and product approval timelines. The market witnesses competition from alternative treatments, although the effectiveness of hypoxia treatment remains a key differentiator. End-user demographics, particularly the aging population and rising prevalence of chronic respiratory diseases, fuel market demand. The M&A landscape has seen xx deals in the last five years, primarily focused on expanding product portfolios and geographical reach.
- Market Concentration: Moderately high, with top 5 players holding approximately xx% market share.
- Technological Innovation: Driving growth through advancements in portable oxygen concentrators and non-invasive ventilation.
- Regulatory Framework: Stringent regulations influence market access and product approvals.
- Competitive Substitutes: Alternative treatments exist, but hypoxia treatment remains crucial for specific conditions.
- End-User Demographics: Aging population and rising prevalence of chronic respiratory diseases drive demand.
- M&A Activity: xx deals in the past five years, focused on portfolio expansion and geographic reach.
Global Hypoxia Treatment Market Growth Trends & Insights
The global hypoxia treatment market has witnessed consistent growth throughout the historical period (2019-2024). Market size expanded from xx Million in 2019 to xx Million in 2024, exhibiting a CAGR of xx%. This growth is primarily driven by the increasing prevalence of chronic respiratory diseases like COPD and asthma, coupled with rising healthcare expenditure globally. Technological advancements, such as the introduction of more portable and user-friendly oxygen therapy devices, have significantly improved patient compliance and contributed to market expansion. Changes in consumer behavior, with a greater emphasis on home-based care and improved quality of life, further bolster market adoption. The market penetration rate is currently at approximately xx%, with significant untapped potential in developing economies. The forecast period (2025-2033) anticipates continued growth, reaching xx Million by 2033, driven by factors including rising healthcare investments and technological innovations in the field.
Dominant Regions, Countries, or Segments in Global Hypoxia Treatment Market
North America currently dominates the global hypoxia treatment market, driven by factors such as high healthcare expenditure, technological advancements, and the high prevalence of chronic respiratory diseases. Europe follows as a significant market, exhibiting substantial growth potential due to rising healthcare awareness and an aging population. Within the segment breakdown, Chronic Obstructive Pulmonary Disease (COPD) accounts for the largest share, followed by Pneumonia and Asthma. Hospitals and clinics constitute the primary end-user segment.
- North America: High healthcare expenditure, technological advancements, and prevalence of respiratory diseases drive market dominance.
- Europe: Significant growth potential due to rising healthcare awareness and an aging population.
- COPD: Largest disease-type segment due to high prevalence globally.
- Hospitals/Clinics: Primary end-user segment due to specialized equipment and expertise.
Global Hypoxia Treatment Market Product Landscape
The hypoxia treatment market encompasses a wide range of products, including oxygen concentrators (portable and stationary), ventilators (invasive and non-invasive), oxygen masks, and other supplemental oxygen delivery systems. Recent innovations focus on portability, ease of use, and improved patient comfort. Key features such as pulse-dose delivery, integrated humidifiers, and advanced monitoring capabilities are driving product differentiation and market expansion. The unique selling propositions often center around enhanced portability, improved patient comfort, and better therapeutic outcomes.
Key Drivers, Barriers & Challenges in Global Hypoxia Treatment Market
Key Drivers: The rising prevalence of chronic respiratory diseases, an aging global population, advancements in medical technology, and increased healthcare spending are major drivers of market growth. Technological innovations such as advanced oxygen concentrators and non-invasive ventilation systems have simplified treatment and improved patient quality of life. Favorable government regulations and reimbursements also contribute to the expansion of the market.
Key Barriers & Challenges: High treatment costs, particularly for advanced technologies, can limit accessibility. Strict regulatory approvals and compliance requirements pose challenges to market entry. Competition from established players and emerging companies creates price pressures. Supply chain disruptions, especially in the manufacturing of essential components, can impact product availability.
Emerging Opportunities in Global Hypoxia Treatment Market
The growing demand for home-based healthcare solutions, coupled with technological advancements in telemedicine and remote patient monitoring, presents significant opportunities. Expanding into untapped markets in developing economies, where the prevalence of respiratory diseases is high but access to treatment is limited, presents substantial growth potential. Innovation in non-invasive ventilation techniques and the development of personalized therapies could also drive market expansion.
Growth Accelerators in the Global Hypoxia Treatment Market Industry
Strategic partnerships between medical device manufacturers and healthcare providers can accelerate market penetration and improve access to treatment. Investing in research and development to improve existing technologies and develop novel therapies is crucial for sustained growth. Expansion into new geographical markets, particularly in emerging economies, presents significant opportunities for growth. Focusing on patient education and awareness campaigns can improve compliance and treatment outcomes, further driving market growth.
Key Players Shaping the Global Hypoxia Treatment Market Market
- Natus Medical Incorporated
- Invacare Corporation
- Merck KGaA
- Spotlight Labs LLC
- Koninklijke Philips NV
- Thermo Fisher Scientific Inc
- HypOxygen
- Resmed
- Hancock Medical Inc
- Fisher & Paykel Healthcare Limited
- Getinge AB
- Hamilton Company
Notable Milestones in Global Hypoxia Treatment Sector
- April 2022: CAIRE The LifeStyle portable oxygen concentrator launch significantly improved the quality of life for oxygen users.
- May 2022: Max ventilator launched multifunctional noninvasive ventilators with built-in oxygen therapy and humidification.
In-Depth Global Hypoxia Treatment Market Market Outlook
The global hypoxia treatment market is poised for significant growth in the coming years, driven by technological advancements, rising prevalence of respiratory diseases, and increasing healthcare spending. Strategic partnerships, market expansion into developing economies, and a focus on improving patient outcomes will be crucial for success. The market is expected to witness continued innovation in non-invasive ventilation, portable oxygen concentrators, and personalized treatment approaches, creating substantial opportunities for market players.
Global Hypoxia Treatment Market Segmentation
-
1. Type
- 1.1. Hypoxic Hypoxia
- 1.2. Anaemic Hypoxia
- 1.3. Stagnant Hypoxia
- 1.4. Histotoxic Hypoxia
-
2. Diseases Type
- 2.1. Chronic Obstructive Pulmonary Disease (COPD)
- 2.2. Pneumonia
- 2.3. Asthma
- 2.4. Others
-
3. End User
- 3.1. Hospitals/Clinics
- 3.2. Others
Global Hypoxia Treatment Market Segmentation By Geography
- 1. North America
- 2. Europe
- 3. Asia Pacific
- 4. Middle East and Africa
- 5. South America
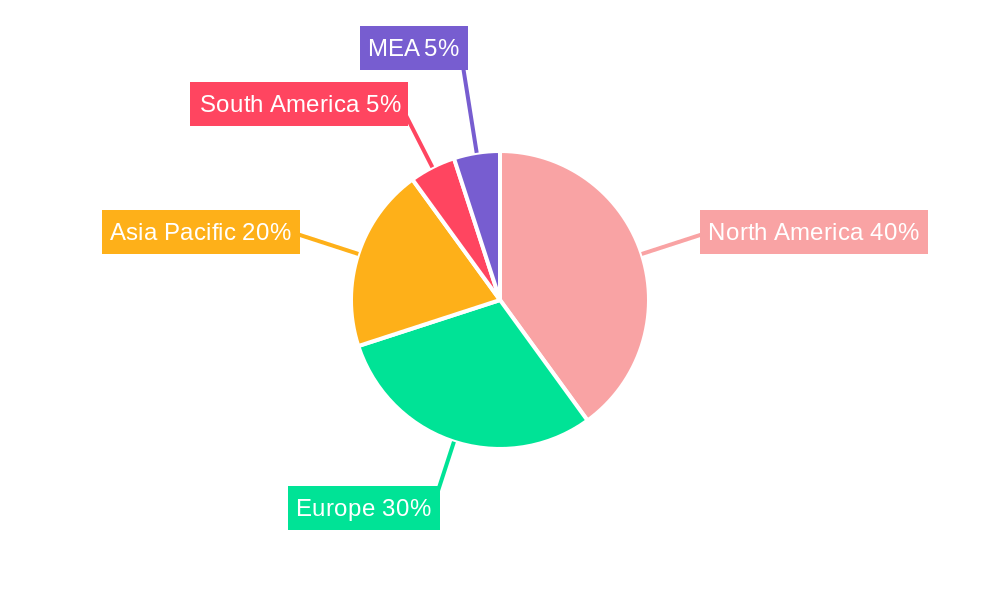
Global Hypoxia Treatment Market Regional Market Share
Geographic Coverage of Global Hypoxia Treatment Market
Global Hypoxia Treatment Market REPORT HIGHLIGHTS
| Aspects | Details |
|---|---|
| Study Period | 2020-2034 |
| Base Year | 2025 |
| Estimated Year | 2026 |
| Forecast Period | 2026-2034 |
| Historical Period | 2020-2025 |
| Growth Rate | CAGR of 7.06% from 2020-2034 |
| Segmentation |
|
Table of Contents
- 1. Introduction
- 1.1. Research Scope
- 1.2. Market Segmentation
- 1.3. Research Methodology
- 1.4. Definitions and Assumptions
- 2. Executive Summary
- 2.1. Introduction
- 3. Market Dynamics
- 3.1. Introduction
- 3.2. Market Drivers
- 3.2.1. Growing Prevalence of Hypoxia; Increasing Research and Development Activity
- 3.3. Market Restrains
- 3.3.1. Stringent Government Regulation Coupled with Availability of Substitute Product
- 3.4. Market Trends
- 3.4.1. Asthma are Expected to Witness Healthy Growth Over the Forecast Period
- 4. Market Factor Analysis
- 4.1. Porters Five Forces
- 4.2. Supply/Value Chain
- 4.3. PESTEL analysis
- 4.4. Market Entropy
- 4.5. Patent/Trademark Analysis
- 5. Global Hypoxia Treatment Market Analysis, Insights and Forecast, 2020-2032
- 5.1. Market Analysis, Insights and Forecast - by Type
- 5.1.1. Hypoxic Hypoxia
- 5.1.2. Anaemic Hypoxia
- 5.1.3. Stagnant Hypoxia
- 5.1.4. Histotoxic Hypoxia
- 5.2. Market Analysis, Insights and Forecast - by Diseases Type
- 5.2.1. Chronic Obstructive Pulmonary Disease (COPD)
- 5.2.2. Pneumonia
- 5.2.3. Asthma
- 5.2.4. Others
- 5.3. Market Analysis, Insights and Forecast - by End User
- 5.3.1. Hospitals/Clinics
- 5.3.2. Others
- 5.4. Market Analysis, Insights and Forecast - by Region
- 5.4.1. North America
- 5.4.2. Europe
- 5.4.3. Asia Pacific
- 5.4.4. Middle East and Africa
- 5.4.5. South America
- 5.1. Market Analysis, Insights and Forecast - by Type
- 6. North America Global Hypoxia Treatment Market Analysis, Insights and Forecast, 2020-2032
- 6.1. Market Analysis, Insights and Forecast - by Type
- 6.1.1. Hypoxic Hypoxia
- 6.1.2. Anaemic Hypoxia
- 6.1.3. Stagnant Hypoxia
- 6.1.4. Histotoxic Hypoxia
- 6.2. Market Analysis, Insights and Forecast - by Diseases Type
- 6.2.1. Chronic Obstructive Pulmonary Disease (COPD)
- 6.2.2. Pneumonia
- 6.2.3. Asthma
- 6.2.4. Others
- 6.3. Market Analysis, Insights and Forecast - by End User
- 6.3.1. Hospitals/Clinics
- 6.3.2. Others
- 6.1. Market Analysis, Insights and Forecast - by Type
- 7. Europe Global Hypoxia Treatment Market Analysis, Insights and Forecast, 2020-2032
- 7.1. Market Analysis, Insights and Forecast - by Type
- 7.1.1. Hypoxic Hypoxia
- 7.1.2. Anaemic Hypoxia
- 7.1.3. Stagnant Hypoxia
- 7.1.4. Histotoxic Hypoxia
- 7.2. Market Analysis, Insights and Forecast - by Diseases Type
- 7.2.1. Chronic Obstructive Pulmonary Disease (COPD)
- 7.2.2. Pneumonia
- 7.2.3. Asthma
- 7.2.4. Others
- 7.3. Market Analysis, Insights and Forecast - by End User
- 7.3.1. Hospitals/Clinics
- 7.3.2. Others
- 7.1. Market Analysis, Insights and Forecast - by Type
- 8. Asia Pacific Global Hypoxia Treatment Market Analysis, Insights and Forecast, 2020-2032
- 8.1. Market Analysis, Insights and Forecast - by Type
- 8.1.1. Hypoxic Hypoxia
- 8.1.2. Anaemic Hypoxia
- 8.1.3. Stagnant Hypoxia
- 8.1.4. Histotoxic Hypoxia
- 8.2. Market Analysis, Insights and Forecast - by Diseases Type
- 8.2.1. Chronic Obstructive Pulmonary Disease (COPD)
- 8.2.2. Pneumonia
- 8.2.3. Asthma
- 8.2.4. Others
- 8.3. Market Analysis, Insights and Forecast - by End User
- 8.3.1. Hospitals/Clinics
- 8.3.2. Others
- 8.1. Market Analysis, Insights and Forecast - by Type
- 9. Middle East and Africa Global Hypoxia Treatment Market Analysis, Insights and Forecast, 2020-2032
- 9.1. Market Analysis, Insights and Forecast - by Type
- 9.1.1. Hypoxic Hypoxia
- 9.1.2. Anaemic Hypoxia
- 9.1.3. Stagnant Hypoxia
- 9.1.4. Histotoxic Hypoxia
- 9.2. Market Analysis, Insights and Forecast - by Diseases Type
- 9.2.1. Chronic Obstructive Pulmonary Disease (COPD)
- 9.2.2. Pneumonia
- 9.2.3. Asthma
- 9.2.4. Others
- 9.3. Market Analysis, Insights and Forecast - by End User
- 9.3.1. Hospitals/Clinics
- 9.3.2. Others
- 9.1. Market Analysis, Insights and Forecast - by Type
- 10. South America Global Hypoxia Treatment Market Analysis, Insights and Forecast, 2020-2032
- 10.1. Market Analysis, Insights and Forecast - by Type
- 10.1.1. Hypoxic Hypoxia
- 10.1.2. Anaemic Hypoxia
- 10.1.3. Stagnant Hypoxia
- 10.1.4. Histotoxic Hypoxia
- 10.2. Market Analysis, Insights and Forecast - by Diseases Type
- 10.2.1. Chronic Obstructive Pulmonary Disease (COPD)
- 10.2.2. Pneumonia
- 10.2.3. Asthma
- 10.2.4. Others
- 10.3. Market Analysis, Insights and Forecast - by End User
- 10.3.1. Hospitals/Clinics
- 10.3.2. Others
- 10.1. Market Analysis, Insights and Forecast - by Type
- 11. Competitive Analysis
- 11.1. Market Share Analysis 2025
- 11.2. Company Profiles
- 11.2.1 Natus Medical Incorporated
- 11.2.1.1. Overview
- 11.2.1.2. Products
- 11.2.1.3. SWOT Analysis
- 11.2.1.4. Recent Developments
- 11.2.1.5. Financials (Based on Availability)
- 11.2.2 Invacare Corporation
- 11.2.2.1. Overview
- 11.2.2.2. Products
- 11.2.2.3. SWOT Analysis
- 11.2.2.4. Recent Developments
- 11.2.2.5. Financials (Based on Availability)
- 11.2.3 Merck KGaA
- 11.2.3.1. Overview
- 11.2.3.2. Products
- 11.2.3.3. SWOT Analysis
- 11.2.3.4. Recent Developments
- 11.2.3.5. Financials (Based on Availability)
- 11.2.4 Spotlight Labs LLC
- 11.2.4.1. Overview
- 11.2.4.2. Products
- 11.2.4.3. SWOT Analysis
- 11.2.4.4. Recent Developments
- 11.2.4.5. Financials (Based on Availability)
- 11.2.5 Koninklijke Philips NV
- 11.2.5.1. Overview
- 11.2.5.2. Products
- 11.2.5.3. SWOT Analysis
- 11.2.5.4. Recent Developments
- 11.2.5.5. Financials (Based on Availability)
- 11.2.6 Thermo Fisher Scientific Inc
- 11.2.6.1. Overview
- 11.2.6.2. Products
- 11.2.6.3. SWOT Analysis
- 11.2.6.4. Recent Developments
- 11.2.6.5. Financials (Based on Availability)
- 11.2.7 HypOxygen
- 11.2.7.1. Overview
- 11.2.7.2. Products
- 11.2.7.3. SWOT Analysis
- 11.2.7.4. Recent Developments
- 11.2.7.5. Financials (Based on Availability)
- 11.2.8 Resmed
- 11.2.8.1. Overview
- 11.2.8.2. Products
- 11.2.8.3. SWOT Analysis
- 11.2.8.4. Recent Developments
- 11.2.8.5. Financials (Based on Availability)
- 11.2.9 Hancock Medical Inc
- 11.2.9.1. Overview
- 11.2.9.2. Products
- 11.2.9.3. SWOT Analysis
- 11.2.9.4. Recent Developments
- 11.2.9.5. Financials (Based on Availability)
- 11.2.10 Fisher & Paykel Healthcare Limited
- 11.2.10.1. Overview
- 11.2.10.2. Products
- 11.2.10.3. SWOT Analysis
- 11.2.10.4. Recent Developments
- 11.2.10.5. Financials (Based on Availability)
- 11.2.11 Getinge AB
- 11.2.11.1. Overview
- 11.2.11.2. Products
- 11.2.11.3. SWOT Analysis
- 11.2.11.4. Recent Developments
- 11.2.11.5. Financials (Based on Availability)
- 11.2.12 Hamilton Company
- 11.2.12.1. Overview
- 11.2.12.2. Products
- 11.2.12.3. SWOT Analysis
- 11.2.12.4. Recent Developments
- 11.2.12.5. Financials (Based on Availability)
- 11.2.1 Natus Medical Incorporated
List of Figures
- Figure 1: Global Global Hypoxia Treatment Market Revenue Breakdown (billion, %) by Region 2025 & 2033
- Figure 2: Global Global Hypoxia Treatment Market Volume Breakdown (K Unit, %) by Region 2025 & 2033
- Figure 3: North America Global Hypoxia Treatment Market Revenue (billion), by Type 2025 & 2033
- Figure 4: North America Global Hypoxia Treatment Market Volume (K Unit), by Type 2025 & 2033
- Figure 5: North America Global Hypoxia Treatment Market Revenue Share (%), by Type 2025 & 2033
- Figure 6: North America Global Hypoxia Treatment Market Volume Share (%), by Type 2025 & 2033
- Figure 7: North America Global Hypoxia Treatment Market Revenue (billion), by Diseases Type 2025 & 2033
- Figure 8: North America Global Hypoxia Treatment Market Volume (K Unit), by Diseases Type 2025 & 2033
- Figure 9: North America Global Hypoxia Treatment Market Revenue Share (%), by Diseases Type 2025 & 2033
- Figure 10: North America Global Hypoxia Treatment Market Volume Share (%), by Diseases Type 2025 & 2033
- Figure 11: North America Global Hypoxia Treatment Market Revenue (billion), by End User 2025 & 2033
- Figure 12: North America Global Hypoxia Treatment Market Volume (K Unit), by End User 2025 & 2033
- Figure 13: North America Global Hypoxia Treatment Market Revenue Share (%), by End User 2025 & 2033
- Figure 14: North America Global Hypoxia Treatment Market Volume Share (%), by End User 2025 & 2033
- Figure 15: North America Global Hypoxia Treatment Market Revenue (billion), by Country 2025 & 2033
- Figure 16: North America Global Hypoxia Treatment Market Volume (K Unit), by Country 2025 & 2033
- Figure 17: North America Global Hypoxia Treatment Market Revenue Share (%), by Country 2025 & 2033
- Figure 18: North America Global Hypoxia Treatment Market Volume Share (%), by Country 2025 & 2033
- Figure 19: Europe Global Hypoxia Treatment Market Revenue (billion), by Type 2025 & 2033
- Figure 20: Europe Global Hypoxia Treatment Market Volume (K Unit), by Type 2025 & 2033
- Figure 21: Europe Global Hypoxia Treatment Market Revenue Share (%), by Type 2025 & 2033
- Figure 22: Europe Global Hypoxia Treatment Market Volume Share (%), by Type 2025 & 2033
- Figure 23: Europe Global Hypoxia Treatment Market Revenue (billion), by Diseases Type 2025 & 2033
- Figure 24: Europe Global Hypoxia Treatment Market Volume (K Unit), by Diseases Type 2025 & 2033
- Figure 25: Europe Global Hypoxia Treatment Market Revenue Share (%), by Diseases Type 2025 & 2033
- Figure 26: Europe Global Hypoxia Treatment Market Volume Share (%), by Diseases Type 2025 & 2033
- Figure 27: Europe Global Hypoxia Treatment Market Revenue (billion), by End User 2025 & 2033
- Figure 28: Europe Global Hypoxia Treatment Market Volume (K Unit), by End User 2025 & 2033
- Figure 29: Europe Global Hypoxia Treatment Market Revenue Share (%), by End User 2025 & 2033
- Figure 30: Europe Global Hypoxia Treatment Market Volume Share (%), by End User 2025 & 2033
- Figure 31: Europe Global Hypoxia Treatment Market Revenue (billion), by Country 2025 & 2033
- Figure 32: Europe Global Hypoxia Treatment Market Volume (K Unit), by Country 2025 & 2033
- Figure 33: Europe Global Hypoxia Treatment Market Revenue Share (%), by Country 2025 & 2033
- Figure 34: Europe Global Hypoxia Treatment Market Volume Share (%), by Country 2025 & 2033
- Figure 35: Asia Pacific Global Hypoxia Treatment Market Revenue (billion), by Type 2025 & 2033
- Figure 36: Asia Pacific Global Hypoxia Treatment Market Volume (K Unit), by Type 2025 & 2033
- Figure 37: Asia Pacific Global Hypoxia Treatment Market Revenue Share (%), by Type 2025 & 2033
- Figure 38: Asia Pacific Global Hypoxia Treatment Market Volume Share (%), by Type 2025 & 2033
- Figure 39: Asia Pacific Global Hypoxia Treatment Market Revenue (billion), by Diseases Type 2025 & 2033
- Figure 40: Asia Pacific Global Hypoxia Treatment Market Volume (K Unit), by Diseases Type 2025 & 2033
- Figure 41: Asia Pacific Global Hypoxia Treatment Market Revenue Share (%), by Diseases Type 2025 & 2033
- Figure 42: Asia Pacific Global Hypoxia Treatment Market Volume Share (%), by Diseases Type 2025 & 2033
- Figure 43: Asia Pacific Global Hypoxia Treatment Market Revenue (billion), by End User 2025 & 2033
- Figure 44: Asia Pacific Global Hypoxia Treatment Market Volume (K Unit), by End User 2025 & 2033
- Figure 45: Asia Pacific Global Hypoxia Treatment Market Revenue Share (%), by End User 2025 & 2033
- Figure 46: Asia Pacific Global Hypoxia Treatment Market Volume Share (%), by End User 2025 & 2033
- Figure 47: Asia Pacific Global Hypoxia Treatment Market Revenue (billion), by Country 2025 & 2033
- Figure 48: Asia Pacific Global Hypoxia Treatment Market Volume (K Unit), by Country 2025 & 2033
- Figure 49: Asia Pacific Global Hypoxia Treatment Market Revenue Share (%), by Country 2025 & 2033
- Figure 50: Asia Pacific Global Hypoxia Treatment Market Volume Share (%), by Country 2025 & 2033
- Figure 51: Middle East and Africa Global Hypoxia Treatment Market Revenue (billion), by Type 2025 & 2033
- Figure 52: Middle East and Africa Global Hypoxia Treatment Market Volume (K Unit), by Type 2025 & 2033
- Figure 53: Middle East and Africa Global Hypoxia Treatment Market Revenue Share (%), by Type 2025 & 2033
- Figure 54: Middle East and Africa Global Hypoxia Treatment Market Volume Share (%), by Type 2025 & 2033
- Figure 55: Middle East and Africa Global Hypoxia Treatment Market Revenue (billion), by Diseases Type 2025 & 2033
- Figure 56: Middle East and Africa Global Hypoxia Treatment Market Volume (K Unit), by Diseases Type 2025 & 2033
- Figure 57: Middle East and Africa Global Hypoxia Treatment Market Revenue Share (%), by Diseases Type 2025 & 2033
- Figure 58: Middle East and Africa Global Hypoxia Treatment Market Volume Share (%), by Diseases Type 2025 & 2033
- Figure 59: Middle East and Africa Global Hypoxia Treatment Market Revenue (billion), by End User 2025 & 2033
- Figure 60: Middle East and Africa Global Hypoxia Treatment Market Volume (K Unit), by End User 2025 & 2033
- Figure 61: Middle East and Africa Global Hypoxia Treatment Market Revenue Share (%), by End User 2025 & 2033
- Figure 62: Middle East and Africa Global Hypoxia Treatment Market Volume Share (%), by End User 2025 & 2033
- Figure 63: Middle East and Africa Global Hypoxia Treatment Market Revenue (billion), by Country 2025 & 2033
- Figure 64: Middle East and Africa Global Hypoxia Treatment Market Volume (K Unit), by Country 2025 & 2033
- Figure 65: Middle East and Africa Global Hypoxia Treatment Market Revenue Share (%), by Country 2025 & 2033
- Figure 66: Middle East and Africa Global Hypoxia Treatment Market Volume Share (%), by Country 2025 & 2033
- Figure 67: South America Global Hypoxia Treatment Market Revenue (billion), by Type 2025 & 2033
- Figure 68: South America Global Hypoxia Treatment Market Volume (K Unit), by Type 2025 & 2033
- Figure 69: South America Global Hypoxia Treatment Market Revenue Share (%), by Type 2025 & 2033
- Figure 70: South America Global Hypoxia Treatment Market Volume Share (%), by Type 2025 & 2033
- Figure 71: South America Global Hypoxia Treatment Market Revenue (billion), by Diseases Type 2025 & 2033
- Figure 72: South America Global Hypoxia Treatment Market Volume (K Unit), by Diseases Type 2025 & 2033
- Figure 73: South America Global Hypoxia Treatment Market Revenue Share (%), by Diseases Type 2025 & 2033
- Figure 74: South America Global Hypoxia Treatment Market Volume Share (%), by Diseases Type 2025 & 2033
- Figure 75: South America Global Hypoxia Treatment Market Revenue (billion), by End User 2025 & 2033
- Figure 76: South America Global Hypoxia Treatment Market Volume (K Unit), by End User 2025 & 2033
- Figure 77: South America Global Hypoxia Treatment Market Revenue Share (%), by End User 2025 & 2033
- Figure 78: South America Global Hypoxia Treatment Market Volume Share (%), by End User 2025 & 2033
- Figure 79: South America Global Hypoxia Treatment Market Revenue (billion), by Country 2025 & 2033
- Figure 80: South America Global Hypoxia Treatment Market Volume (K Unit), by Country 2025 & 2033
- Figure 81: South America Global Hypoxia Treatment Market Revenue Share (%), by Country 2025 & 2033
- Figure 82: South America Global Hypoxia Treatment Market Volume Share (%), by Country 2025 & 2033
List of Tables
- Table 1: Global Hypoxia Treatment Market Revenue billion Forecast, by Type 2020 & 2033
- Table 2: Global Hypoxia Treatment Market Volume K Unit Forecast, by Type 2020 & 2033
- Table 3: Global Hypoxia Treatment Market Revenue billion Forecast, by Diseases Type 2020 & 2033
- Table 4: Global Hypoxia Treatment Market Volume K Unit Forecast, by Diseases Type 2020 & 2033
- Table 5: Global Hypoxia Treatment Market Revenue billion Forecast, by End User 2020 & 2033
- Table 6: Global Hypoxia Treatment Market Volume K Unit Forecast, by End User 2020 & 2033
- Table 7: Global Hypoxia Treatment Market Revenue billion Forecast, by Region 2020 & 2033
- Table 8: Global Hypoxia Treatment Market Volume K Unit Forecast, by Region 2020 & 2033
- Table 9: Global Hypoxia Treatment Market Revenue billion Forecast, by Type 2020 & 2033
- Table 10: Global Hypoxia Treatment Market Volume K Unit Forecast, by Type 2020 & 2033
- Table 11: Global Hypoxia Treatment Market Revenue billion Forecast, by Diseases Type 2020 & 2033
- Table 12: Global Hypoxia Treatment Market Volume K Unit Forecast, by Diseases Type 2020 & 2033
- Table 13: Global Hypoxia Treatment Market Revenue billion Forecast, by End User 2020 & 2033
- Table 14: Global Hypoxia Treatment Market Volume K Unit Forecast, by End User 2020 & 2033
- Table 15: Global Hypoxia Treatment Market Revenue billion Forecast, by Country 2020 & 2033
- Table 16: Global Hypoxia Treatment Market Volume K Unit Forecast, by Country 2020 & 2033
- Table 17: Global Hypoxia Treatment Market Revenue billion Forecast, by Type 2020 & 2033
- Table 18: Global Hypoxia Treatment Market Volume K Unit Forecast, by Type 2020 & 2033
- Table 19: Global Hypoxia Treatment Market Revenue billion Forecast, by Diseases Type 2020 & 2033
- Table 20: Global Hypoxia Treatment Market Volume K Unit Forecast, by Diseases Type 2020 & 2033
- Table 21: Global Hypoxia Treatment Market Revenue billion Forecast, by End User 2020 & 2033
- Table 22: Global Hypoxia Treatment Market Volume K Unit Forecast, by End User 2020 & 2033
- Table 23: Global Hypoxia Treatment Market Revenue billion Forecast, by Country 2020 & 2033
- Table 24: Global Hypoxia Treatment Market Volume K Unit Forecast, by Country 2020 & 2033
- Table 25: Global Hypoxia Treatment Market Revenue billion Forecast, by Type 2020 & 2033
- Table 26: Global Hypoxia Treatment Market Volume K Unit Forecast, by Type 2020 & 2033
- Table 27: Global Hypoxia Treatment Market Revenue billion Forecast, by Diseases Type 2020 & 2033
- Table 28: Global Hypoxia Treatment Market Volume K Unit Forecast, by Diseases Type 2020 & 2033
- Table 29: Global Hypoxia Treatment Market Revenue billion Forecast, by End User 2020 & 2033
- Table 30: Global Hypoxia Treatment Market Volume K Unit Forecast, by End User 2020 & 2033
- Table 31: Global Hypoxia Treatment Market Revenue billion Forecast, by Country 2020 & 2033
- Table 32: Global Hypoxia Treatment Market Volume K Unit Forecast, by Country 2020 & 2033
- Table 33: Global Hypoxia Treatment Market Revenue billion Forecast, by Type 2020 & 2033
- Table 34: Global Hypoxia Treatment Market Volume K Unit Forecast, by Type 2020 & 2033
- Table 35: Global Hypoxia Treatment Market Revenue billion Forecast, by Diseases Type 2020 & 2033
- Table 36: Global Hypoxia Treatment Market Volume K Unit Forecast, by Diseases Type 2020 & 2033
- Table 37: Global Hypoxia Treatment Market Revenue billion Forecast, by End User 2020 & 2033
- Table 38: Global Hypoxia Treatment Market Volume K Unit Forecast, by End User 2020 & 2033
- Table 39: Global Hypoxia Treatment Market Revenue billion Forecast, by Country 2020 & 2033
- Table 40: Global Hypoxia Treatment Market Volume K Unit Forecast, by Country 2020 & 2033
- Table 41: Global Hypoxia Treatment Market Revenue billion Forecast, by Type 2020 & 2033
- Table 42: Global Hypoxia Treatment Market Volume K Unit Forecast, by Type 2020 & 2033
- Table 43: Global Hypoxia Treatment Market Revenue billion Forecast, by Diseases Type 2020 & 2033
- Table 44: Global Hypoxia Treatment Market Volume K Unit Forecast, by Diseases Type 2020 & 2033
- Table 45: Global Hypoxia Treatment Market Revenue billion Forecast, by End User 2020 & 2033
- Table 46: Global Hypoxia Treatment Market Volume K Unit Forecast, by End User 2020 & 2033
- Table 47: Global Hypoxia Treatment Market Revenue billion Forecast, by Country 2020 & 2033
- Table 48: Global Hypoxia Treatment Market Volume K Unit Forecast, by Country 2020 & 2033
Frequently Asked Questions
1. What is the projected Compound Annual Growth Rate (CAGR) of the Global Hypoxia Treatment Market?
The projected CAGR is approximately 7.06%.
2. Which companies are prominent players in the Global Hypoxia Treatment Market?
Key companies in the market include Natus Medical Incorporated, Invacare Corporation, Merck KGaA, Spotlight Labs LLC, Koninklijke Philips NV, Thermo Fisher Scientific Inc, HypOxygen, Resmed, Hancock Medical Inc, Fisher & Paykel Healthcare Limited, Getinge AB, Hamilton Company.
3. What are the main segments of the Global Hypoxia Treatment Market?
The market segments include Type, Diseases Type, End User.
4. Can you provide details about the market size?
The market size is estimated to be USD 15.27 billion as of 2022.
5. What are some drivers contributing to market growth?
Growing Prevalence of Hypoxia; Increasing Research and Development Activity.
6. What are the notable trends driving market growth?
Asthma are Expected to Witness Healthy Growth Over the Forecast Period.
7. Are there any restraints impacting market growth?
Stringent Government Regulation Coupled with Availability of Substitute Product.
8. Can you provide examples of recent developments in the market?
In April 2022, CAIRE The LifeStyle portable oxygen concentrator was introduced, vastly enhancing the quality of life for oxygen users all over the world.
9. What pricing options are available for accessing the report?
Pricing options include single-user, multi-user, and enterprise licenses priced at USD 4750, USD 5250, and USD 8750 respectively.
10. Is the market size provided in terms of value or volume?
The market size is provided in terms of value, measured in billion and volume, measured in K Unit.
11. Are there any specific market keywords associated with the report?
Yes, the market keyword associated with the report is "Global Hypoxia Treatment Market," which aids in identifying and referencing the specific market segment covered.
12. How do I determine which pricing option suits my needs best?
The pricing options vary based on user requirements and access needs. Individual users may opt for single-user licenses, while businesses requiring broader access may choose multi-user or enterprise licenses for cost-effective access to the report.
13. Are there any additional resources or data provided in the Global Hypoxia Treatment Market report?
While the report offers comprehensive insights, it's advisable to review the specific contents or supplementary materials provided to ascertain if additional resources or data are available.
14. How can I stay updated on further developments or reports in the Global Hypoxia Treatment Market?
To stay informed about further developments, trends, and reports in the Global Hypoxia Treatment Market, consider subscribing to industry newsletters, following relevant companies and organizations, or regularly checking reputable industry news sources and publications.
Methodology
Step 1 - Identification of Relevant Samples Size from Population Database


Step 2 - Approaches for Defining Global Market Size (Value, Volume* & Price*)

Note*: In applicable scenarios
Step 3 - Data Sources
Primary Research
- Web Analytics
- Survey Reports
- Research Institute
- Latest Research Reports
- Opinion Leaders
Secondary Research
- Annual Reports
- White Paper
- Latest Press Release
- Industry Association
- Paid Database
- Investor Presentations

Step 4 - Data Triangulation
Involves using different sources of information in order to increase the validity of a study
These sources are likely to be stakeholders in a program - participants, other researchers, program staff, other community members, and so on.
Then we put all data in single framework & apply various statistical tools to find out the dynamic on the market.
During the analysis stage, feedback from the stakeholder groups would be compared to determine areas of agreement as well as areas of divergence