
Key Insights
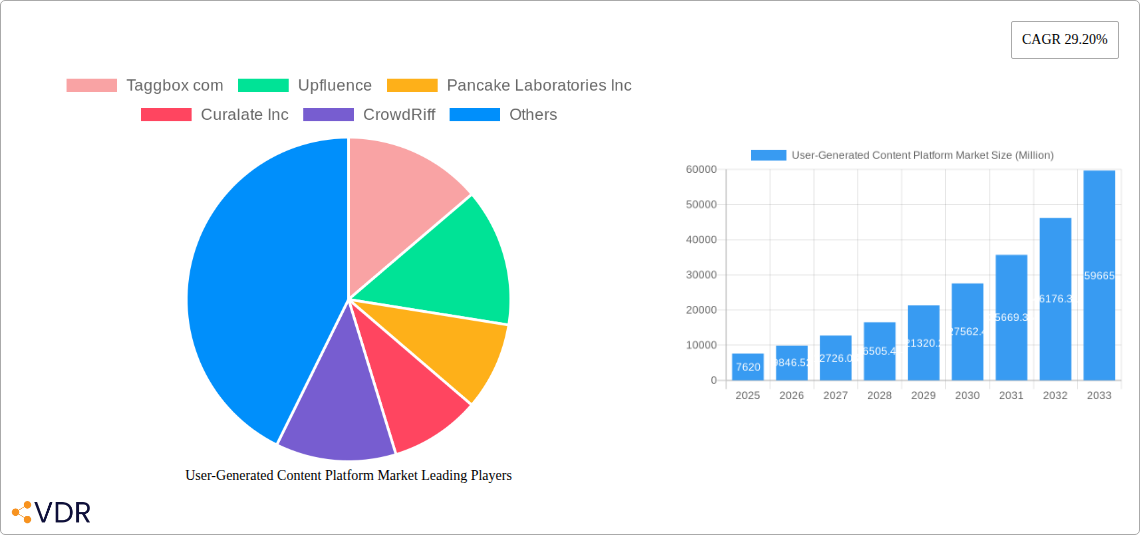
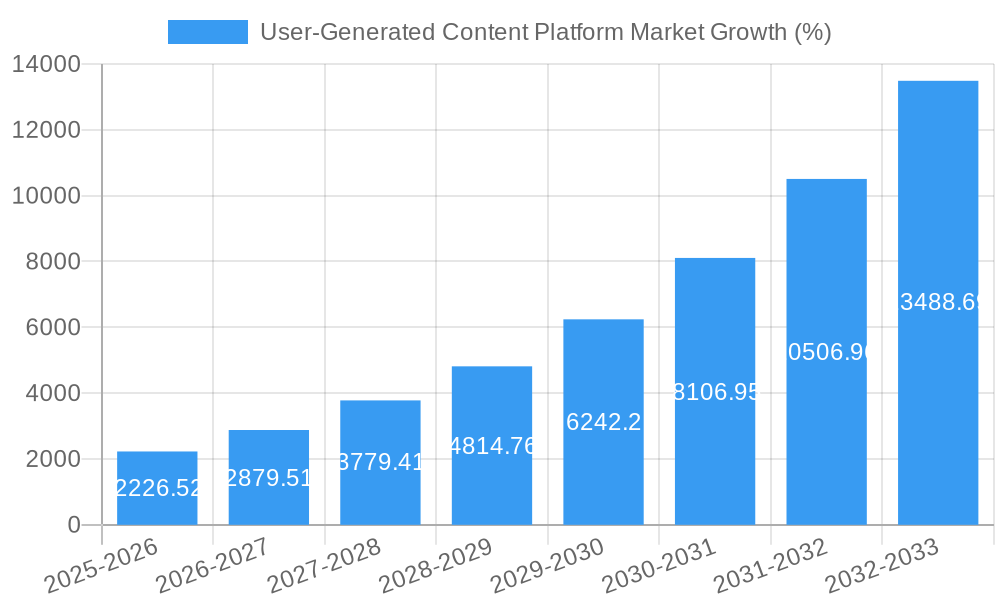
The User-Generated Content (UGC) Platform market is experiencing robust growth, projected to reach \$7.62 billion in 2025 and maintain a Compound Annual Growth Rate (CAGR) of 29.20% from 2025 to 2033. This expansion is driven by several key factors. Firstly, brands are increasingly recognizing the power of authentic user content to build trust and engagement, shifting marketing strategies away from solely professionally produced materials. The rise of social commerce, where UGC directly influences purchasing decisions, further fuels this trend. Secondly, technological advancements are making it easier and more affordable for businesses of all sizes to leverage UGC platforms, simplifying content acquisition, moderation, and integration into marketing campaigns. Finally, the increasing preference for personalized and interactive digital experiences resonates deeply with consumers, making UGC, with its relatable and genuine nature, a highly effective marketing tool.
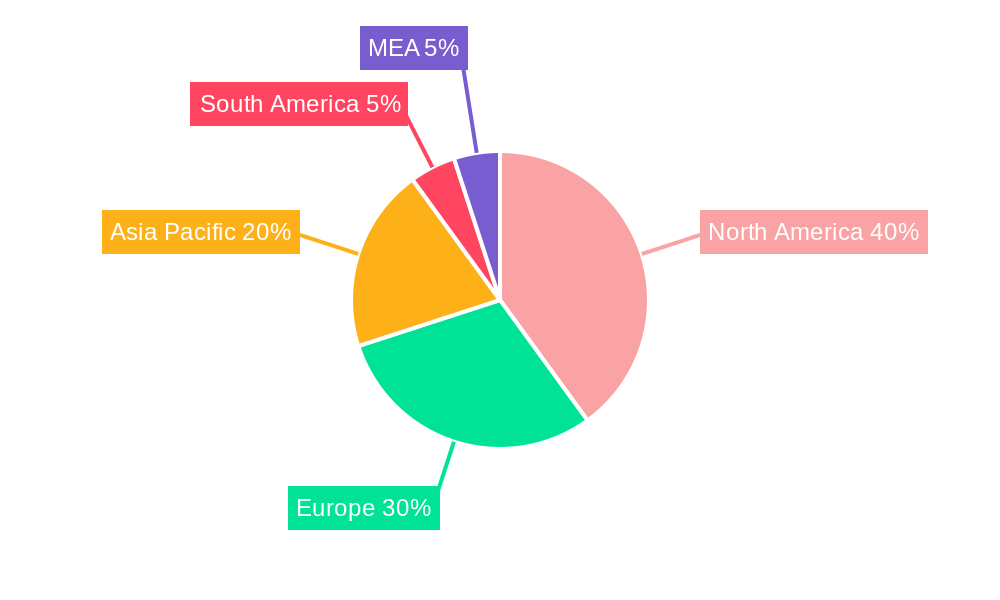
However, challenges remain. The market faces hurdles related to content moderation and ensuring the authenticity and quality of UGC. Maintaining brand control while leveraging user-generated content requires sophisticated tools and strategies. Moreover, data privacy concerns and the potential for negative or misleading UGC pose significant risks that platform providers must address effectively. The segmentation of the market reveals that the “Blogs” and “Websites” product types currently hold the largest share but are expected to witness increased competition from rapidly evolving platforms focused on “Social Media” and “Audio and Video” content. The enterprise segment shows particularly strong growth potential due to the scalable nature of UGC integration into broader marketing strategies. Geographic distribution indicates a strong concentration of the market in North America and Europe, with Asia-Pacific experiencing rapid growth, driven by increasing internet penetration and smartphone usage. This suggests a considerable opportunity for expansion and market penetration in emerging economies.
User-Generated Content Platform Market Report: 2019-2033
This comprehensive report provides a detailed analysis of the User-Generated Content (UGC) Platform market, encompassing market dynamics, growth trends, regional insights, competitive landscape, and future outlook. The study period covers 2019-2033, with 2025 as the base year and a forecast period of 2025-2033. The report segments the market by product type (Blogs, Websites, Advertising & Promotions, Social Media, Audio & Video, Other Product Types) and end-user (Individual, Enterprises), offering granular insights into this rapidly evolving sector. The market size is projected to reach xx Million by 2033.
User-Generated Content Platform Market Dynamics & Structure
The User-Generated Content Platform market is characterized by a moderately fragmented landscape with a few key players holding significant market share. Technological innovation, particularly in AI-powered content moderation and analytics, is a primary growth driver. Regulatory frameworks concerning data privacy and user rights significantly influence market operations. The rise of short-form video content presents both an opportunity and a challenge, demanding platforms capable of managing and leveraging this format effectively. Competitive substitutes include traditional marketing methods and influencer marketing platforms without integrated UGC capabilities. The market witnesses substantial M&A activity, reflecting the consolidation trend.
- Market Concentration: Moderately fragmented, with the top 5 players holding approximately xx% market share in 2024.
- Technological Innovation: AI-driven content moderation, analytics, and personalization are key drivers.
- Regulatory Frameworks: GDPR, CCPA, and other data privacy regulations shape market practices.
- Competitive Substitutes: Traditional marketing, influencer marketing platforms.
- M&A Trends: Significant M&A activity observed, with xx deals recorded between 2019 and 2024. (Average deal value: xx Million).
- End-User Demographics: Increasing adoption by enterprises, driven by demand for authentic marketing.
User-Generated Content Platform Market Growth Trends & Insights
The UGC Platform market has witnessed robust growth, driven by increasing consumer preference for authentic content and the rising adoption of social commerce. The market size expanded from xx Million in 2019 to xx Million in 2024, exhibiting a Compound Annual Growth Rate (CAGR) of xx%. Technological disruptions, such as the rise of short-form video and the integration of AI, are reshaping market dynamics. Consumer behavior shifts towards interactive and personalized experiences further fuel market expansion. Market penetration remains relatively low, indicating substantial growth potential, particularly in emerging markets. The increasing demand for effective content moderation tools, to manage potential negative user-generated content, is also driving market growth.
Dominant Regions, Countries, or Segments in User-Generated Content Platform Market
North America currently holds the largest market share, driven by early adoption of social commerce and a robust digital infrastructure. Europe is a significant market, with growth fueled by increasing demand for personalized marketing and the adoption of robust data privacy regulations. The Asia-Pacific region is expected to experience the fastest growth rate due to rising internet penetration and a large, young, tech-savvy population. Within the product type segment, Social Media platforms currently dominate, followed by Websites and Blogs, while the enterprise segment shows significant growth potential.
- North America: High adoption rates, well-established digital infrastructure. Market share in 2024: xx%.
- Europe: Strong growth driven by increasing consumer demand and regulatory compliance. Market share in 2024: xx%.
- Asia-Pacific: High growth potential driven by rising internet penetration and young population. Market share in 2024: xx%.
- By Product Type: Social Media dominates with xx% market share in 2024, followed by Websites (xx%) and Blogs (xx%).
- By End-user: Enterprises segment demonstrates rapid growth, projected to reach xx Million by 2033.
User-Generated Content Platform Market Product Landscape
UGC platforms are constantly evolving, incorporating advanced features such as AI-powered content moderation, advanced analytics dashboards providing detailed insights into user engagement, and seamless integration with existing marketing and e-commerce ecosystems. These platforms offer unique selling propositions such as improved brand authenticity, increased customer engagement, and cost-effective marketing solutions. Technological advancements are focused on enhancing user experience, improving content quality, and providing insightful data analysis capabilities.
Key Drivers, Barriers & Challenges in User-Generated Content Platform Market
Key Drivers: The increasing demand for authentic marketing, the rising popularity of social commerce, and technological advancements in AI and data analytics are major drivers. Government initiatives promoting digitalization also contribute.
Key Challenges: Maintaining content quality and managing negative UGC present significant challenges. Data privacy regulations and the complexities of integrating UGC into existing marketing strategies pose hurdles. Competition from established marketing platforms and the need to continuously adapt to evolving social media landscapes require significant investment in R&D and adaptability. Furthermore, ensuring compliance with evolving data privacy and security regulations across multiple jurisdictions is a continuous challenge.
Emerging Opportunities in User-Generated Content Platform Market
Untapped markets in developing economies, the integration of UGC into augmented reality (AR) and virtual reality (VR) experiences, and the increasing use of UGC in live commerce offer significant opportunities. Evolving consumer preferences for personalized and interactive content demand innovative solutions from UGC platform providers. The rise of metaverse technologies will potentially offer new avenues for leveraging UGC.
Growth Accelerators in the User-Generated Content Platform Market Industry
Technological breakthroughs in AI and machine learning, strategic partnerships with social media platforms, and expansion into new geographical markets will significantly accelerate market growth. Focus on enhancing user experience and providing robust data analytics features will further drive market expansion. The development of more sophisticated content moderation tools, capable of proactively identifying and mitigating negative UGC will also be critical.
Key Players Shaping the User-Generated Content Platform Market Market
- Taggbox com
- Upfluence
- Pancake Laboratories Inc
- Curalate Inc
- CrowdRiff
- Grin Technologies Inc
- Bazaarvoice
- Yotpo Ltd
- Pixlee TurnTo
- Monotype Imaging Inc
Notable Milestones in User-Generated Content Platform Market Sector
- November 2022: Emplifi acquires Pixlee TurnTo, expanding its customer experience platform capabilities.
- June 2022: A new European player emerges through a partnership between Photoslurp and Flowbox, forming Flowbox.
In-Depth User-Generated Content Platform Market Market Outlook
The User-Generated Content Platform market is poised for sustained growth, driven by ongoing technological advancements, increasing adoption by enterprises, and the expansion into new geographical markets. Strategic partnerships, focus on innovation, and proactive adaptation to evolving consumer preferences will be crucial for success in this dynamic market. The market’s future potential is substantial, particularly in leveraging the rising adoption of immersive technologies and the growing demand for authentic, user-driven marketing strategies.
User-Generated Content Platform Market Segmentation
-
1. Product Type
- 1.1. Blogs
- 1.2. Websites
- 1.3. Advertising and Promotions
- 1.4. Social Media
- 1.5. Audio and Video
- 1.6. Other Product Types
-
2. End-user
- 2.1. Individual
- 2.2. Enterprises
User-Generated Content Platform Market Segmentation By Geography
- 1. North America
- 2. Europe
- 3. Asia
- 4. Latin America
- 5. Middle East and Africa
User-Generated Content Platform Market REPORT HIGHLIGHTS
| Aspects | Details |
|---|---|
| Study Period | 2019-2033 |
| Base Year | 2024 |
| Estimated Year | 2025 |
| Forecast Period | 2025-2033 |
| Historical Period | 2019-2024 |
| Growth Rate | CAGR of 29.20% from 2019-2033 |
| Segmentation |
|
Table of Contents
- 1. Introduction
- 1.1. Research Scope
- 1.2. Market Segmentation
- 1.3. Research Methodology
- 1.4. Definitions and Assumptions
- 2. Executive Summary
- 2.1. Introduction
- 3. Market Dynamics
- 3.1. Introduction
- 3.2. Market Drivers
- 3.2.1. Increase in Use of Influencer Marketing; Development of AI and Machine Learning
- 3.3. Market Restrains
- 3.3.1. Trust and Safety Issues
- 3.4. Market Trends
- 3.4.1. Development of AI and machine learning
- 4. Market Factor Analysis
- 4.1. Porters Five Forces
- 4.2. Supply/Value Chain
- 4.3. PESTEL analysis
- 4.4. Market Entropy
- 4.5. Patent/Trademark Analysis
- 5. Global User-Generated Content Platform Market Analysis, Insights and Forecast, 2019-2031
- 5.1. Market Analysis, Insights and Forecast - by Product Type
- 5.1.1. Blogs
- 5.1.2. Websites
- 5.1.3. Advertising and Promotions
- 5.1.4. Social Media
- 5.1.5. Audio and Video
- 5.1.6. Other Product Types
- 5.2. Market Analysis, Insights and Forecast - by End-user
- 5.2.1. Individual
- 5.2.2. Enterprises
- 5.3. Market Analysis, Insights and Forecast - by Region
- 5.3.1. North America
- 5.3.2. Europe
- 5.3.3. Asia
- 5.3.4. Latin America
- 5.3.5. Middle East and Africa
- 5.1. Market Analysis, Insights and Forecast - by Product Type
- 6. North America User-Generated Content Platform Market Analysis, Insights and Forecast, 2019-2031
- 6.1. Market Analysis, Insights and Forecast - by Product Type
- 6.1.1. Blogs
- 6.1.2. Websites
- 6.1.3. Advertising and Promotions
- 6.1.4. Social Media
- 6.1.5. Audio and Video
- 6.1.6. Other Product Types
- 6.2. Market Analysis, Insights and Forecast - by End-user
- 6.2.1. Individual
- 6.2.2. Enterprises
- 6.1. Market Analysis, Insights and Forecast - by Product Type
- 7. Europe User-Generated Content Platform Market Analysis, Insights and Forecast, 2019-2031
- 7.1. Market Analysis, Insights and Forecast - by Product Type
- 7.1.1. Blogs
- 7.1.2. Websites
- 7.1.3. Advertising and Promotions
- 7.1.4. Social Media
- 7.1.5. Audio and Video
- 7.1.6. Other Product Types
- 7.2. Market Analysis, Insights and Forecast - by End-user
- 7.2.1. Individual
- 7.2.2. Enterprises
- 7.1. Market Analysis, Insights and Forecast - by Product Type
- 8. Asia User-Generated Content Platform Market Analysis, Insights and Forecast, 2019-2031
- 8.1. Market Analysis, Insights and Forecast - by Product Type
- 8.1.1. Blogs
- 8.1.2. Websites
- 8.1.3. Advertising and Promotions
- 8.1.4. Social Media
- 8.1.5. Audio and Video
- 8.1.6. Other Product Types
- 8.2. Market Analysis, Insights and Forecast - by End-user
- 8.2.1. Individual
- 8.2.2. Enterprises
- 8.1. Market Analysis, Insights and Forecast - by Product Type
- 9. Latin America User-Generated Content Platform Market Analysis, Insights and Forecast, 2019-2031
- 9.1. Market Analysis, Insights and Forecast - by Product Type
- 9.1.1. Blogs
- 9.1.2. Websites
- 9.1.3. Advertising and Promotions
- 9.1.4. Social Media
- 9.1.5. Audio and Video
- 9.1.6. Other Product Types
- 9.2. Market Analysis, Insights and Forecast - by End-user
- 9.2.1. Individual
- 9.2.2. Enterprises
- 9.1. Market Analysis, Insights and Forecast - by Product Type
- 10. Middle East and Africa User-Generated Content Platform Market Analysis, Insights and Forecast, 2019-2031
- 10.1. Market Analysis, Insights and Forecast - by Product Type
- 10.1.1. Blogs
- 10.1.2. Websites
- 10.1.3. Advertising and Promotions
- 10.1.4. Social Media
- 10.1.5. Audio and Video
- 10.1.6. Other Product Types
- 10.2. Market Analysis, Insights and Forecast - by End-user
- 10.2.1. Individual
- 10.2.2. Enterprises
- 10.1. Market Analysis, Insights and Forecast - by Product Type
- 11. North America User-Generated Content Platform Market Analysis, Insights and Forecast, 2019-2031
- 11.1. Market Analysis, Insights and Forecast - By Country/Sub-region
- 11.1.1 United States
- 11.1.2 Canada
- 11.1.3 Mexico
- 12. Europe User-Generated Content Platform Market Analysis, Insights and Forecast, 2019-2031
- 12.1. Market Analysis, Insights and Forecast - By Country/Sub-region
- 12.1.1 Germany
- 12.1.2 United Kingdom
- 12.1.3 France
- 12.1.4 Spain
- 12.1.5 Italy
- 12.1.6 Spain
- 12.1.7 Belgium
- 12.1.8 Netherland
- 12.1.9 Nordics
- 12.1.10 Rest of Europe
- 13. Asia Pacific User-Generated Content Platform Market Analysis, Insights and Forecast, 2019-2031
- 13.1. Market Analysis, Insights and Forecast - By Country/Sub-region
- 13.1.1 China
- 13.1.2 Japan
- 13.1.3 India
- 13.1.4 South Korea
- 13.1.5 Southeast Asia
- 13.1.6 Australia
- 13.1.7 Indonesia
- 13.1.8 Phillipes
- 13.1.9 Singapore
- 13.1.10 Thailandc
- 13.1.11 Rest of Asia Pacific
- 14. South America User-Generated Content Platform Market Analysis, Insights and Forecast, 2019-2031
- 14.1. Market Analysis, Insights and Forecast - By Country/Sub-region
- 14.1.1 Brazil
- 14.1.2 Argentina
- 14.1.3 Peru
- 14.1.4 Chile
- 14.1.5 Colombia
- 14.1.6 Ecuador
- 14.1.7 Venezuela
- 14.1.8 Rest of South America
- 15. North America User-Generated Content Platform Market Analysis, Insights and Forecast, 2019-2031
- 15.1. Market Analysis, Insights and Forecast - By Country/Sub-region
- 15.1.1 United States
- 15.1.2 Canada
- 15.1.3 Mexico
- 16. MEA User-Generated Content Platform Market Analysis, Insights and Forecast, 2019-2031
- 16.1. Market Analysis, Insights and Forecast - By Country/Sub-region
- 16.1.1 United Arab Emirates
- 16.1.2 Saudi Arabia
- 16.1.3 South Africa
- 16.1.4 Rest of Middle East and Africa
- 17. Competitive Analysis
- 17.1. Global Market Share Analysis 2024
- 17.2. Company Profiles
- 17.2.1 Taggbox com
- 17.2.1.1. Overview
- 17.2.1.2. Products
- 17.2.1.3. SWOT Analysis
- 17.2.1.4. Recent Developments
- 17.2.1.5. Financials (Based on Availability)
- 17.2.2 Upfluence
- 17.2.2.1. Overview
- 17.2.2.2. Products
- 17.2.2.3. SWOT Analysis
- 17.2.2.4. Recent Developments
- 17.2.2.5. Financials (Based on Availability)
- 17.2.3 Pancake Laboratories Inc
- 17.2.3.1. Overview
- 17.2.3.2. Products
- 17.2.3.3. SWOT Analysis
- 17.2.3.4. Recent Developments
- 17.2.3.5. Financials (Based on Availability)
- 17.2.4 Curalate Inc
- 17.2.4.1. Overview
- 17.2.4.2. Products
- 17.2.4.3. SWOT Analysis
- 17.2.4.4. Recent Developments
- 17.2.4.5. Financials (Based on Availability)
- 17.2.5 CrowdRiff
- 17.2.5.1. Overview
- 17.2.5.2. Products
- 17.2.5.3. SWOT Analysis
- 17.2.5.4. Recent Developments
- 17.2.5.5. Financials (Based on Availability)
- 17.2.6 Grin Technologies Inc
- 17.2.6.1. Overview
- 17.2.6.2. Products
- 17.2.6.3. SWOT Analysis
- 17.2.6.4. Recent Developments
- 17.2.6.5. Financials (Based on Availability)
- 17.2.7 Bazaarvoice
- 17.2.7.1. Overview
- 17.2.7.2. Products
- 17.2.7.3. SWOT Analysis
- 17.2.7.4. Recent Developments
- 17.2.7.5. Financials (Based on Availability)
- 17.2.8 Yotpo Ltd
- 17.2.8.1. Overview
- 17.2.8.2. Products
- 17.2.8.3. SWOT Analysis
- 17.2.8.4. Recent Developments
- 17.2.8.5. Financials (Based on Availability)
- 17.2.9 Pixlee TurnTo
- 17.2.9.1. Overview
- 17.2.9.2. Products
- 17.2.9.3. SWOT Analysis
- 17.2.9.4. Recent Developments
- 17.2.9.5. Financials (Based on Availability)
- 17.2.10 Monotype Imaging Inc
- 17.2.10.1. Overview
- 17.2.10.2. Products
- 17.2.10.3. SWOT Analysis
- 17.2.10.4. Recent Developments
- 17.2.10.5. Financials (Based on Availability)
- 17.2.1 Taggbox com
List of Figures
- Figure 1: Global User-Generated Content Platform Market Revenue Breakdown (Million, %) by Region 2024 & 2032
- Figure 2: Global User-Generated Content Platform Market Volume Breakdown (K Unit, %) by Region 2024 & 2032
- Figure 3: North America User-Generated Content Platform Market Revenue (Million), by Country 2024 & 2032
- Figure 4: North America User-Generated Content Platform Market Volume (K Unit), by Country 2024 & 2032
- Figure 5: North America User-Generated Content Platform Market Revenue Share (%), by Country 2024 & 2032
- Figure 6: North America User-Generated Content Platform Market Volume Share (%), by Country 2024 & 2032
- Figure 7: Europe User-Generated Content Platform Market Revenue (Million), by Country 2024 & 2032
- Figure 8: Europe User-Generated Content Platform Market Volume (K Unit), by Country 2024 & 2032
- Figure 9: Europe User-Generated Content Platform Market Revenue Share (%), by Country 2024 & 2032
- Figure 10: Europe User-Generated Content Platform Market Volume Share (%), by Country 2024 & 2032
- Figure 11: Asia Pacific User-Generated Content Platform Market Revenue (Million), by Country 2024 & 2032
- Figure 12: Asia Pacific User-Generated Content Platform Market Volume (K Unit), by Country 2024 & 2032
- Figure 13: Asia Pacific User-Generated Content Platform Market Revenue Share (%), by Country 2024 & 2032
- Figure 14: Asia Pacific User-Generated Content Platform Market Volume Share (%), by Country 2024 & 2032
- Figure 15: South America User-Generated Content Platform Market Revenue (Million), by Country 2024 & 2032
- Figure 16: South America User-Generated Content Platform Market Volume (K Unit), by Country 2024 & 2032
- Figure 17: South America User-Generated Content Platform Market Revenue Share (%), by Country 2024 & 2032
- Figure 18: South America User-Generated Content Platform Market Volume Share (%), by Country 2024 & 2032
- Figure 19: North America User-Generated Content Platform Market Revenue (Million), by Country 2024 & 2032
- Figure 20: North America User-Generated Content Platform Market Volume (K Unit), by Country 2024 & 2032
- Figure 21: North America User-Generated Content Platform Market Revenue Share (%), by Country 2024 & 2032
- Figure 22: North America User-Generated Content Platform Market Volume Share (%), by Country 2024 & 2032
- Figure 23: MEA User-Generated Content Platform Market Revenue (Million), by Country 2024 & 2032
- Figure 24: MEA User-Generated Content Platform Market Volume (K Unit), by Country 2024 & 2032
- Figure 25: MEA User-Generated Content Platform Market Revenue Share (%), by Country 2024 & 2032
- Figure 26: MEA User-Generated Content Platform Market Volume Share (%), by Country 2024 & 2032
- Figure 27: North America User-Generated Content Platform Market Revenue (Million), by Product Type 2024 & 2032
- Figure 28: North America User-Generated Content Platform Market Volume (K Unit), by Product Type 2024 & 2032
- Figure 29: North America User-Generated Content Platform Market Revenue Share (%), by Product Type 2024 & 2032
- Figure 30: North America User-Generated Content Platform Market Volume Share (%), by Product Type 2024 & 2032
- Figure 31: North America User-Generated Content Platform Market Revenue (Million), by End-user 2024 & 2032
- Figure 32: North America User-Generated Content Platform Market Volume (K Unit), by End-user 2024 & 2032
- Figure 33: North America User-Generated Content Platform Market Revenue Share (%), by End-user 2024 & 2032
- Figure 34: North America User-Generated Content Platform Market Volume Share (%), by End-user 2024 & 2032
- Figure 35: North America User-Generated Content Platform Market Revenue (Million), by Country 2024 & 2032
- Figure 36: North America User-Generated Content Platform Market Volume (K Unit), by Country 2024 & 2032
- Figure 37: North America User-Generated Content Platform Market Revenue Share (%), by Country 2024 & 2032
- Figure 38: North America User-Generated Content Platform Market Volume Share (%), by Country 2024 & 2032
- Figure 39: Europe User-Generated Content Platform Market Revenue (Million), by Product Type 2024 & 2032
- Figure 40: Europe User-Generated Content Platform Market Volume (K Unit), by Product Type 2024 & 2032
- Figure 41: Europe User-Generated Content Platform Market Revenue Share (%), by Product Type 2024 & 2032
- Figure 42: Europe User-Generated Content Platform Market Volume Share (%), by Product Type 2024 & 2032
- Figure 43: Europe User-Generated Content Platform Market Revenue (Million), by End-user 2024 & 2032
- Figure 44: Europe User-Generated Content Platform Market Volume (K Unit), by End-user 2024 & 2032
- Figure 45: Europe User-Generated Content Platform Market Revenue Share (%), by End-user 2024 & 2032
- Figure 46: Europe User-Generated Content Platform Market Volume Share (%), by End-user 2024 & 2032
- Figure 47: Europe User-Generated Content Platform Market Revenue (Million), by Country 2024 & 2032
- Figure 48: Europe User-Generated Content Platform Market Volume (K Unit), by Country 2024 & 2032
- Figure 49: Europe User-Generated Content Platform Market Revenue Share (%), by Country 2024 & 2032
- Figure 50: Europe User-Generated Content Platform Market Volume Share (%), by Country 2024 & 2032
- Figure 51: Asia User-Generated Content Platform Market Revenue (Million), by Product Type 2024 & 2032
- Figure 52: Asia User-Generated Content Platform Market Volume (K Unit), by Product Type 2024 & 2032
- Figure 53: Asia User-Generated Content Platform Market Revenue Share (%), by Product Type 2024 & 2032
- Figure 54: Asia User-Generated Content Platform Market Volume Share (%), by Product Type 2024 & 2032
- Figure 55: Asia User-Generated Content Platform Market Revenue (Million), by End-user 2024 & 2032
- Figure 56: Asia User-Generated Content Platform Market Volume (K Unit), by End-user 2024 & 2032
- Figure 57: Asia User-Generated Content Platform Market Revenue Share (%), by End-user 2024 & 2032
- Figure 58: Asia User-Generated Content Platform Market Volume Share (%), by End-user 2024 & 2032
- Figure 59: Asia User-Generated Content Platform Market Revenue (Million), by Country 2024 & 2032
- Figure 60: Asia User-Generated Content Platform Market Volume (K Unit), by Country 2024 & 2032
- Figure 61: Asia User-Generated Content Platform Market Revenue Share (%), by Country 2024 & 2032
- Figure 62: Asia User-Generated Content Platform Market Volume Share (%), by Country 2024 & 2032
- Figure 63: Latin America User-Generated Content Platform Market Revenue (Million), by Product Type 2024 & 2032
- Figure 64: Latin America User-Generated Content Platform Market Volume (K Unit), by Product Type 2024 & 2032
- Figure 65: Latin America User-Generated Content Platform Market Revenue Share (%), by Product Type 2024 & 2032
- Figure 66: Latin America User-Generated Content Platform Market Volume Share (%), by Product Type 2024 & 2032
- Figure 67: Latin America User-Generated Content Platform Market Revenue (Million), by End-user 2024 & 2032
- Figure 68: Latin America User-Generated Content Platform Market Volume (K Unit), by End-user 2024 & 2032
- Figure 69: Latin America User-Generated Content Platform Market Revenue Share (%), by End-user 2024 & 2032
- Figure 70: Latin America User-Generated Content Platform Market Volume Share (%), by End-user 2024 & 2032
- Figure 71: Latin America User-Generated Content Platform Market Revenue (Million), by Country 2024 & 2032
- Figure 72: Latin America User-Generated Content Platform Market Volume (K Unit), by Country 2024 & 2032
- Figure 73: Latin America User-Generated Content Platform Market Revenue Share (%), by Country 2024 & 2032
- Figure 74: Latin America User-Generated Content Platform Market Volume Share (%), by Country 2024 & 2032
- Figure 75: Middle East and Africa User-Generated Content Platform Market Revenue (Million), by Product Type 2024 & 2032
- Figure 76: Middle East and Africa User-Generated Content Platform Market Volume (K Unit), by Product Type 2024 & 2032
- Figure 77: Middle East and Africa User-Generated Content Platform Market Revenue Share (%), by Product Type 2024 & 2032
- Figure 78: Middle East and Africa User-Generated Content Platform Market Volume Share (%), by Product Type 2024 & 2032
- Figure 79: Middle East and Africa User-Generated Content Platform Market Revenue (Million), by End-user 2024 & 2032
- Figure 80: Middle East and Africa User-Generated Content Platform Market Volume (K Unit), by End-user 2024 & 2032
- Figure 81: Middle East and Africa User-Generated Content Platform Market Revenue Share (%), by End-user 2024 & 2032
- Figure 82: Middle East and Africa User-Generated Content Platform Market Volume Share (%), by End-user 2024 & 2032
- Figure 83: Middle East and Africa User-Generated Content Platform Market Revenue (Million), by Country 2024 & 2032
- Figure 84: Middle East and Africa User-Generated Content Platform Market Volume (K Unit), by Country 2024 & 2032
- Figure 85: Middle East and Africa User-Generated Content Platform Market Revenue Share (%), by Country 2024 & 2032
- Figure 86: Middle East and Africa User-Generated Content Platform Market Volume Share (%), by Country 2024 & 2032
List of Tables
- Table 1: Global User-Generated Content Platform Market Revenue Million Forecast, by Region 2019 & 2032
- Table 2: Global User-Generated Content Platform Market Volume K Unit Forecast, by Region 2019 & 2032
- Table 3: Global User-Generated Content Platform Market Revenue Million Forecast, by Product Type 2019 & 2032
- Table 4: Global User-Generated Content Platform Market Volume K Unit Forecast, by Product Type 2019 & 2032
- Table 5: Global User-Generated Content Platform Market Revenue Million Forecast, by End-user 2019 & 2032
- Table 6: Global User-Generated Content Platform Market Volume K Unit Forecast, by End-user 2019 & 2032
- Table 7: Global User-Generated Content Platform Market Revenue Million Forecast, by Region 2019 & 2032
- Table 8: Global User-Generated Content Platform Market Volume K Unit Forecast, by Region 2019 & 2032
- Table 9: Global User-Generated Content Platform Market Revenue Million Forecast, by Country 2019 & 2032
- Table 10: Global User-Generated Content Platform Market Volume K Unit Forecast, by Country 2019 & 2032
- Table 11: United States User-Generated Content Platform Market Revenue (Million) Forecast, by Application 2019 & 2032
- Table 12: United States User-Generated Content Platform Market Volume (K Unit) Forecast, by Application 2019 & 2032
- Table 13: Canada User-Generated Content Platform Market Revenue (Million) Forecast, by Application 2019 & 2032
- Table 14: Canada User-Generated Content Platform Market Volume (K Unit) Forecast, by Application 2019 & 2032
- Table 15: Mexico User-Generated Content Platform Market Revenue (Million) Forecast, by Application 2019 & 2032
- Table 16: Mexico User-Generated Content Platform Market Volume (K Unit) Forecast, by Application 2019 & 2032
- Table 17: Global User-Generated Content Platform Market Revenue Million Forecast, by Country 2019 & 2032
- Table 18: Global User-Generated Content Platform Market Volume K Unit Forecast, by Country 2019 & 2032
- Table 19: Germany User-Generated Content Platform Market Revenue (Million) Forecast, by Application 2019 & 2032
- Table 20: Germany User-Generated Content Platform Market Volume (K Unit) Forecast, by Application 2019 & 2032
- Table 21: United Kingdom User-Generated Content Platform Market Revenue (Million) Forecast, by Application 2019 & 2032
- Table 22: United Kingdom User-Generated Content Platform Market Volume (K Unit) Forecast, by Application 2019 & 2032
- Table 23: France User-Generated Content Platform Market Revenue (Million) Forecast, by Application 2019 & 2032
- Table 24: France User-Generated Content Platform Market Volume (K Unit) Forecast, by Application 2019 & 2032
- Table 25: Spain User-Generated Content Platform Market Revenue (Million) Forecast, by Application 2019 & 2032
- Table 26: Spain User-Generated Content Platform Market Volume (K Unit) Forecast, by Application 2019 & 2032
- Table 27: Italy User-Generated Content Platform Market Revenue (Million) Forecast, by Application 2019 & 2032
- Table 28: Italy User-Generated Content Platform Market Volume (K Unit) Forecast, by Application 2019 & 2032
- Table 29: Spain User-Generated Content Platform Market Revenue (Million) Forecast, by Application 2019 & 2032
- Table 30: Spain User-Generated Content Platform Market Volume (K Unit) Forecast, by Application 2019 & 2032
- Table 31: Belgium User-Generated Content Platform Market Revenue (Million) Forecast, by Application 2019 & 2032
- Table 32: Belgium User-Generated Content Platform Market Volume (K Unit) Forecast, by Application 2019 & 2032
- Table 33: Netherland User-Generated Content Platform Market Revenue (Million) Forecast, by Application 2019 & 2032
- Table 34: Netherland User-Generated Content Platform Market Volume (K Unit) Forecast, by Application 2019 & 2032
- Table 35: Nordics User-Generated Content Platform Market Revenue (Million) Forecast, by Application 2019 & 2032
- Table 36: Nordics User-Generated Content Platform Market Volume (K Unit) Forecast, by Application 2019 & 2032
- Table 37: Rest of Europe User-Generated Content Platform Market Revenue (Million) Forecast, by Application 2019 & 2032
- Table 38: Rest of Europe User-Generated Content Platform Market Volume (K Unit) Forecast, by Application 2019 & 2032
- Table 39: Global User-Generated Content Platform Market Revenue Million Forecast, by Country 2019 & 2032
- Table 40: Global User-Generated Content Platform Market Volume K Unit Forecast, by Country 2019 & 2032
- Table 41: China User-Generated Content Platform Market Revenue (Million) Forecast, by Application 2019 & 2032
- Table 42: China User-Generated Content Platform Market Volume (K Unit) Forecast, by Application 2019 & 2032
- Table 43: Japan User-Generated Content Platform Market Revenue (Million) Forecast, by Application 2019 & 2032
- Table 44: Japan User-Generated Content Platform Market Volume (K Unit) Forecast, by Application 2019 & 2032
- Table 45: India User-Generated Content Platform Market Revenue (Million) Forecast, by Application 2019 & 2032
- Table 46: India User-Generated Content Platform Market Volume (K Unit) Forecast, by Application 2019 & 2032
- Table 47: South Korea User-Generated Content Platform Market Revenue (Million) Forecast, by Application 2019 & 2032
- Table 48: South Korea User-Generated Content Platform Market Volume (K Unit) Forecast, by Application 2019 & 2032
- Table 49: Southeast Asia User-Generated Content Platform Market Revenue (Million) Forecast, by Application 2019 & 2032
- Table 50: Southeast Asia User-Generated Content Platform Market Volume (K Unit) Forecast, by Application 2019 & 2032
- Table 51: Australia User-Generated Content Platform Market Revenue (Million) Forecast, by Application 2019 & 2032
- Table 52: Australia User-Generated Content Platform Market Volume (K Unit) Forecast, by Application 2019 & 2032
- Table 53: Indonesia User-Generated Content Platform Market Revenue (Million) Forecast, by Application 2019 & 2032
- Table 54: Indonesia User-Generated Content Platform Market Volume (K Unit) Forecast, by Application 2019 & 2032
- Table 55: Phillipes User-Generated Content Platform Market Revenue (Million) Forecast, by Application 2019 & 2032
- Table 56: Phillipes User-Generated Content Platform Market Volume (K Unit) Forecast, by Application 2019 & 2032
- Table 57: Singapore User-Generated Content Platform Market Revenue (Million) Forecast, by Application 2019 & 2032
- Table 58: Singapore User-Generated Content Platform Market Volume (K Unit) Forecast, by Application 2019 & 2032
- Table 59: Thailandc User-Generated Content Platform Market Revenue (Million) Forecast, by Application 2019 & 2032
- Table 60: Thailandc User-Generated Content Platform Market Volume (K Unit) Forecast, by Application 2019 & 2032
- Table 61: Rest of Asia Pacific User-Generated Content Platform Market Revenue (Million) Forecast, by Application 2019 & 2032
- Table 62: Rest of Asia Pacific User-Generated Content Platform Market Volume (K Unit) Forecast, by Application 2019 & 2032
- Table 63: Global User-Generated Content Platform Market Revenue Million Forecast, by Country 2019 & 2032
- Table 64: Global User-Generated Content Platform Market Volume K Unit Forecast, by Country 2019 & 2032
- Table 65: Brazil User-Generated Content Platform Market Revenue (Million) Forecast, by Application 2019 & 2032
- Table 66: Brazil User-Generated Content Platform Market Volume (K Unit) Forecast, by Application 2019 & 2032
- Table 67: Argentina User-Generated Content Platform Market Revenue (Million) Forecast, by Application 2019 & 2032
- Table 68: Argentina User-Generated Content Platform Market Volume (K Unit) Forecast, by Application 2019 & 2032
- Table 69: Peru User-Generated Content Platform Market Revenue (Million) Forecast, by Application 2019 & 2032
- Table 70: Peru User-Generated Content Platform Market Volume (K Unit) Forecast, by Application 2019 & 2032
- Table 71: Chile User-Generated Content Platform Market Revenue (Million) Forecast, by Application 2019 & 2032
- Table 72: Chile User-Generated Content Platform Market Volume (K Unit) Forecast, by Application 2019 & 2032
- Table 73: Colombia User-Generated Content Platform Market Revenue (Million) Forecast, by Application 2019 & 2032
- Table 74: Colombia User-Generated Content Platform Market Volume (K Unit) Forecast, by Application 2019 & 2032
- Table 75: Ecuador User-Generated Content Platform Market Revenue (Million) Forecast, by Application 2019 & 2032
- Table 76: Ecuador User-Generated Content Platform Market Volume (K Unit) Forecast, by Application 2019 & 2032
- Table 77: Venezuela User-Generated Content Platform Market Revenue (Million) Forecast, by Application 2019 & 2032
- Table 78: Venezuela User-Generated Content Platform Market Volume (K Unit) Forecast, by Application 2019 & 2032
- Table 79: Rest of South America User-Generated Content Platform Market Revenue (Million) Forecast, by Application 2019 & 2032
- Table 80: Rest of South America User-Generated Content Platform Market Volume (K Unit) Forecast, by Application 2019 & 2032
- Table 81: Global User-Generated Content Platform Market Revenue Million Forecast, by Country 2019 & 2032
- Table 82: Global User-Generated Content Platform Market Volume K Unit Forecast, by Country 2019 & 2032
- Table 83: United States User-Generated Content Platform Market Revenue (Million) Forecast, by Application 2019 & 2032
- Table 84: United States User-Generated Content Platform Market Volume (K Unit) Forecast, by Application 2019 & 2032
- Table 85: Canada User-Generated Content Platform Market Revenue (Million) Forecast, by Application 2019 & 2032
- Table 86: Canada User-Generated Content Platform Market Volume (K Unit) Forecast, by Application 2019 & 2032
- Table 87: Mexico User-Generated Content Platform Market Revenue (Million) Forecast, by Application 2019 & 2032
- Table 88: Mexico User-Generated Content Platform Market Volume (K Unit) Forecast, by Application 2019 & 2032
- Table 89: Global User-Generated Content Platform Market Revenue Million Forecast, by Country 2019 & 2032
- Table 90: Global User-Generated Content Platform Market Volume K Unit Forecast, by Country 2019 & 2032
- Table 91: United Arab Emirates User-Generated Content Platform Market Revenue (Million) Forecast, by Application 2019 & 2032
- Table 92: United Arab Emirates User-Generated Content Platform Market Volume (K Unit) Forecast, by Application 2019 & 2032
- Table 93: Saudi Arabia User-Generated Content Platform Market Revenue (Million) Forecast, by Application 2019 & 2032
- Table 94: Saudi Arabia User-Generated Content Platform Market Volume (K Unit) Forecast, by Application 2019 & 2032
- Table 95: South Africa User-Generated Content Platform Market Revenue (Million) Forecast, by Application 2019 & 2032
- Table 96: South Africa User-Generated Content Platform Market Volume (K Unit) Forecast, by Application 2019 & 2032
- Table 97: Rest of Middle East and Africa User-Generated Content Platform Market Revenue (Million) Forecast, by Application 2019 & 2032
- Table 98: Rest of Middle East and Africa User-Generated Content Platform Market Volume (K Unit) Forecast, by Application 2019 & 2032
- Table 99: Global User-Generated Content Platform Market Revenue Million Forecast, by Product Type 2019 & 2032
- Table 100: Global User-Generated Content Platform Market Volume K Unit Forecast, by Product Type 2019 & 2032
- Table 101: Global User-Generated Content Platform Market Revenue Million Forecast, by End-user 2019 & 2032
- Table 102: Global User-Generated Content Platform Market Volume K Unit Forecast, by End-user 2019 & 2032
- Table 103: Global User-Generated Content Platform Market Revenue Million Forecast, by Country 2019 & 2032
- Table 104: Global User-Generated Content Platform Market Volume K Unit Forecast, by Country 2019 & 2032
- Table 105: Global User-Generated Content Platform Market Revenue Million Forecast, by Product Type 2019 & 2032
- Table 106: Global User-Generated Content Platform Market Volume K Unit Forecast, by Product Type 2019 & 2032
- Table 107: Global User-Generated Content Platform Market Revenue Million Forecast, by End-user 2019 & 2032
- Table 108: Global User-Generated Content Platform Market Volume K Unit Forecast, by End-user 2019 & 2032
- Table 109: Global User-Generated Content Platform Market Revenue Million Forecast, by Country 2019 & 2032
- Table 110: Global User-Generated Content Platform Market Volume K Unit Forecast, by Country 2019 & 2032
- Table 111: Global User-Generated Content Platform Market Revenue Million Forecast, by Product Type 2019 & 2032
- Table 112: Global User-Generated Content Platform Market Volume K Unit Forecast, by Product Type 2019 & 2032
- Table 113: Global User-Generated Content Platform Market Revenue Million Forecast, by End-user 2019 & 2032
- Table 114: Global User-Generated Content Platform Market Volume K Unit Forecast, by End-user 2019 & 2032
- Table 115: Global User-Generated Content Platform Market Revenue Million Forecast, by Country 2019 & 2032
- Table 116: Global User-Generated Content Platform Market Volume K Unit Forecast, by Country 2019 & 2032
- Table 117: Global User-Generated Content Platform Market Revenue Million Forecast, by Product Type 2019 & 2032
- Table 118: Global User-Generated Content Platform Market Volume K Unit Forecast, by Product Type 2019 & 2032
- Table 119: Global User-Generated Content Platform Market Revenue Million Forecast, by End-user 2019 & 2032
- Table 120: Global User-Generated Content Platform Market Volume K Unit Forecast, by End-user 2019 & 2032
- Table 121: Global User-Generated Content Platform Market Revenue Million Forecast, by Country 2019 & 2032
- Table 122: Global User-Generated Content Platform Market Volume K Unit Forecast, by Country 2019 & 2032
- Table 123: Global User-Generated Content Platform Market Revenue Million Forecast, by Product Type 2019 & 2032
- Table 124: Global User-Generated Content Platform Market Volume K Unit Forecast, by Product Type 2019 & 2032
- Table 125: Global User-Generated Content Platform Market Revenue Million Forecast, by End-user 2019 & 2032
- Table 126: Global User-Generated Content Platform Market Volume K Unit Forecast, by End-user 2019 & 2032
- Table 127: Global User-Generated Content Platform Market Revenue Million Forecast, by Country 2019 & 2032
- Table 128: Global User-Generated Content Platform Market Volume K Unit Forecast, by Country 2019 & 2032
Frequently Asked Questions
1. What is the projected Compound Annual Growth Rate (CAGR) of the User-Generated Content Platform Market?
The projected CAGR is approximately 29.20%.
2. Which companies are prominent players in the User-Generated Content Platform Market?
Key companies in the market include Taggbox com, Upfluence, Pancake Laboratories Inc, Curalate Inc, CrowdRiff, Grin Technologies Inc, Bazaarvoice, Yotpo Ltd, Pixlee TurnTo, Monotype Imaging Inc.
3. What are the main segments of the User-Generated Content Platform Market?
The market segments include Product Type, End-user.
4. Can you provide details about the market size?
The market size is estimated to be USD 7.62 Million as of 2022.
5. What are some drivers contributing to market growth?
Increase in Use of Influencer Marketing; Development of AI and Machine Learning.
6. What are the notable trends driving market growth?
Development of AI and machine learning.
7. Are there any restraints impacting market growth?
Trust and Safety Issues.
8. Can you provide examples of recent developments in the market?
November 2022: Emplifi, a unified customer experience platform, introduced the acquisition of Pixlee TurnTo, a US-based provider of user-generated content, ratings and reviews, and influencer marketing solutions. Pixlee TurnTo provides innovative, customer-driven solutions that enable brands to market, sell, and deliver care to consumers at an authentic cost and scale. Emplifi will integrate Pixlee TurnTo's capabilities in social marketing, live commerce, and customer care workflows as part of its unified CX Cloud platform.
9. What pricing options are available for accessing the report?
Pricing options include single-user, multi-user, and enterprise licenses priced at USD 4750, USD 5250, and USD 8750 respectively.
10. Is the market size provided in terms of value or volume?
The market size is provided in terms of value, measured in Million and volume, measured in K Unit.
11. Are there any specific market keywords associated with the report?
Yes, the market keyword associated with the report is "User-Generated Content Platform Market," which aids in identifying and referencing the specific market segment covered.
12. How do I determine which pricing option suits my needs best?
The pricing options vary based on user requirements and access needs. Individual users may opt for single-user licenses, while businesses requiring broader access may choose multi-user or enterprise licenses for cost-effective access to the report.
13. Are there any additional resources or data provided in the User-Generated Content Platform Market report?
While the report offers comprehensive insights, it's advisable to review the specific contents or supplementary materials provided to ascertain if additional resources or data are available.
14. How can I stay updated on further developments or reports in the User-Generated Content Platform Market?
To stay informed about further developments, trends, and reports in the User-Generated Content Platform Market, consider subscribing to industry newsletters, following relevant companies and organizations, or regularly checking reputable industry news sources and publications.
Methodology
Step 1 - Identification of Relevant Samples Size from Population Database


Step 2 - Approaches for Defining Global Market Size (Value, Volume* & Price*)

Note*: In applicable scenarios
Step 3 - Data Sources
Primary Research
- Web Analytics
- Survey Reports
- Research Institute
- Latest Research Reports
- Opinion Leaders
Secondary Research
- Annual Reports
- White Paper
- Latest Press Release
- Industry Association
- Paid Database
- Investor Presentations

Step 4 - Data Triangulation
Involves using different sources of information in order to increase the validity of a study
These sources are likely to be stakeholders in a program - participants, other researchers, program staff, other community members, and so on.
Then we put all data in single framework & apply various statistical tools to find out the dynamic on the market.
During the analysis stage, feedback from the stakeholder groups would be compared to determine areas of agreement as well as areas of divergence


