Passive Biometrics Verification Industry Market’s Technological Evolution: Trends and Analysis 2025-2033

Passive Biometrics Verification Industry by Component (Software, Services), by Deployment Type (On-premises, Cloud), by End-User Industry (BFSI, Retail, IT and Telecom, Helathcare, Government, Other End-User Inustries), by North America, by Europe, by Asia Pacific, by Latin America, by Middle East and Africa Forecast 2025-2033

Jul 22 2025
Base Year: 2024

234 Pages
Main Logo

Passive Biometrics Verification Industry Market’s Technological Evolution: Trends and Analysis 2025-2033


Home
Industries
Technology, Media and Telecom
sponsor image
sponsor image
sponsor image
sponsor image
sponsor image
sponsor image
sponsor image
sponsor image
sponsor image
sponsor image
sponsor image
sponsor image
sponsor image
sponsor image
sponsor image
sponsor image
sponsor image
sponsor image
sponsor image
sponsor image

Tailored for you

  • In-depth Analysis Tailored to Specified Regions or Segments
  • Company Profiles Customized to User Preferences
  • Comprehensive Insights Focused on Specific Segments or Regions
  • Customized Evaluation of Competitive Landscape to Meet Your Needs
  • Tailored Customization to Address Other Specific Requirements
Ask for customization


Key Insights

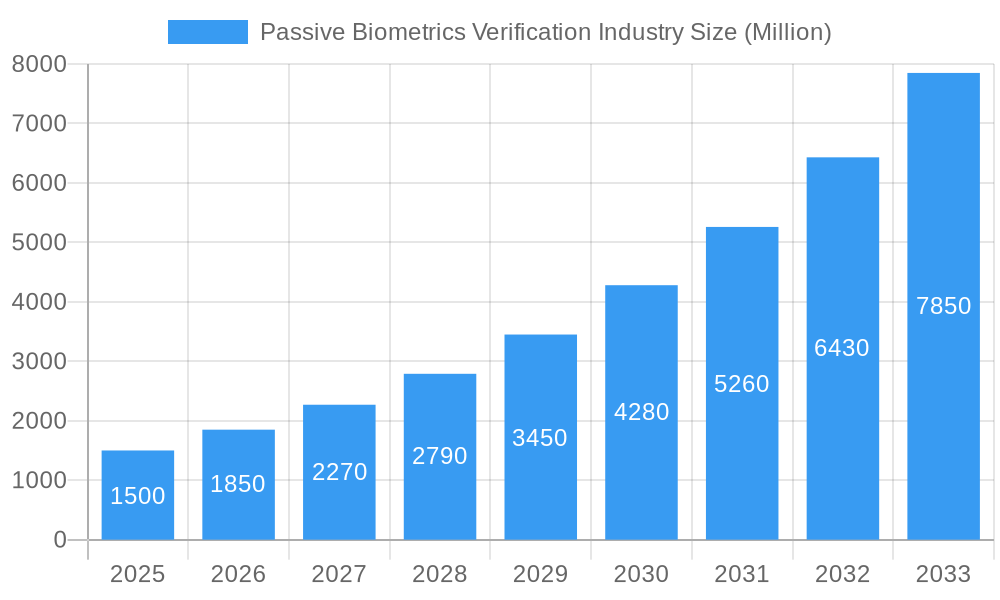
The Passive Biometrics Verification market is experiencing robust growth, projected to reach a substantial value by 2033. A Compound Annual Growth Rate (CAGR) of 23.65% from 2025 to 2033 indicates a significant expansion driven by several key factors. Increased concerns over data security and fraud prevention across various sectors, particularly BFSI (Banking, Financial Services, and Insurance), retail, and healthcare, are fueling the adoption of passive biometrics. The shift towards cloud-based solutions enhances accessibility and scalability, contributing to market growth. Furthermore, advancements in technology, leading to more accurate and reliable passive biometric verification systems, are attracting wider adoption. The market segmentation reveals a strong preference for software solutions and cloud deployments, highlighting the importance of user-friendly and flexible systems. The North American region currently holds a significant market share, but the Asia-Pacific region is poised for substantial growth given the expanding digital landscape and increasing technological advancements in countries like India and China.

Despite the promising outlook, challenges remain. Integration complexities with existing security systems and concerns regarding data privacy and regulatory compliance can impede market expansion. However, ongoing technological improvements and the growing awareness of the benefits of passive biometrics are expected to mitigate these restraints. The competitive landscape is dynamic, with established players like Nuance Communications, IBM, and Thales Group alongside emerging innovative companies driving innovation and expanding market opportunities. The continuous improvement in accuracy and efficiency of passive biometrics will likely open new applications, further propelling market growth in the forecast period. The increasing adoption across various industries suggests a long-term positive trend for the passive biometrics verification market.

Passive Biometrics Verification Industry Research Report - Market Size, Growth & Forecast

Passive Biometrics Verification Industry Market Report: 2019-2033

This comprehensive report offers an in-depth analysis of the Passive Biometrics Verification market, encompassing market dynamics, growth trends, regional analysis, competitive landscape, and future outlook. The study period covers 2019-2033, with 2025 as the base and estimated year, and a forecast period of 2025-2033. The report segments the market by component (Software, Services), deployment type (On-premises, Cloud), and end-user industry (BFSI, Retail, IT & Telecom, Healthcare, Government, Other). Key players analyzed include Nuance Communications Inc, IBM Corporation, ID R&D Inc, Thales Group (Gemalto N V), Cisco Systems Inc, Aware Inc, Pindrop Security Inc, Verint Systems Inc, OneSpan Inc, NEC Corporation, Fortress Identity, Equifax Inc, and BioCatch Ltd. (List not exhaustive). The market size in 2025 is estimated at xx Million.

Passive Biometrics Verification Industry Market Dynamics & Structure

The Passive Biometrics Verification market is characterized by moderate concentration, with a few major players holding significant market share. Technological innovation, particularly in AI and machine learning, is a key driver, enabling more accurate and efficient verification. Regulatory frameworks, such as GDPR and CCPA, significantly influence adoption and data security practices. Competitive substitutes include traditional authentication methods like passwords and one-time pins. The end-user demographic is expanding rapidly, driven by increasing digital transactions and the need for enhanced security. M&A activity has been moderate, with strategic acquisitions aimed at expanding capabilities and market reach.

  • Market Concentration: Moderately Concentrated, with top 5 players holding approximately xx% market share in 2025.
  • Technological Innovation: AI, machine learning, and behavioral biometrics are key drivers.
  • Regulatory Framework: GDPR, CCPA, and other data privacy regulations shape market practices.
  • Competitive Substitutes: Traditional authentication methods (passwords, OTPs) pose a competitive threat.
  • M&A Activity: xx deals recorded between 2019-2024, with an average deal value of xx Million.
  • Innovation Barriers: High initial investment costs and data privacy concerns.

Passive Biometrics Verification Industry Growth Trends & Insights

The Passive Biometrics Verification market has witnessed robust growth over the past few years, driven by the increasing adoption of digital channels across various industries and rising concerns over security breaches. The market size is projected to reach xx Million by 2033, exhibiting a CAGR of xx% during the forecast period. Technological advancements, such as improved accuracy and reduced latency, are fueling market adoption. Consumer behavior shifts toward contactless transactions and the increasing use of mobile devices further propel market growth. The market penetration rate in the BFSI sector is expected to reach xx% by 2033, significantly higher than other sectors. Factors such as the rise in cybercrime, growing demand for seamless user experience, and increasing government regulations contribute to the market's rapid growth. The integration of passive biometrics into various applications, such as fraud detection and risk management, is boosting market demand.

Passive Biometrics Verification Industry Growth

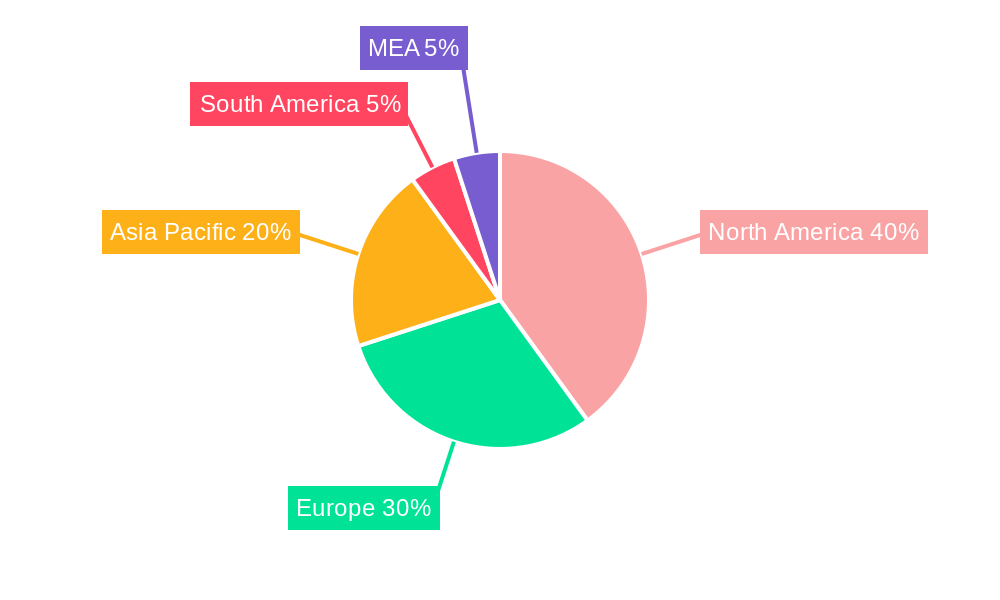
Dominant Regions, Countries, or Segments in Passive Biometrics Verification Industry

North America currently dominates the Passive Biometrics Verification market, driven by early adoption of advanced technologies and stringent regulatory compliance requirements. Within the segments, the software segment holds a larger market share compared to the services segment, owing to the increasing demand for scalable and cost-effective solutions. The cloud deployment type is experiencing faster growth than the on-premises deployment due to its flexibility and scalability. The BFSI sector remains the dominant end-user industry due to the high security needs of financial transactions.

  • North America: High adoption rates, advanced technology infrastructure, and stringent security regulations contribute to market dominance. Market share: xx% in 2025.
  • Software Segment: High demand for scalable and cost-effective solutions drives market growth. Market share: xx% in 2025.
  • Cloud Deployment: Flexibility and scalability drive increased adoption. Market share: xx% in 2025.
  • BFSI Sector: High security needs in financial transactions fuels strong demand. Market share: xx% in 2025.

Passive Biometrics Verification Industry Product Landscape

The Passive Biometrics Verification product landscape is characterized by continuous innovation, focusing on enhanced accuracy, reduced latency, and improved user experience. Products incorporate advanced algorithms and machine learning techniques for more reliable verification. Unique selling propositions include seamless integration with existing systems, low friction user experience, and robust security features. Technological advancements include the integration of behavioral biometrics, improving the detection of fraudulent activities. The market is seeing a shift toward cloud-based solutions due to their scalability and cost-effectiveness.

Key Drivers, Barriers & Challenges in Passive Biometrics Verification Industry

Key Drivers: Increasing cyber threats, growing demand for secure digital transactions, stringent government regulations, and advancements in AI and machine learning are key drivers. For instance, the rising number of data breaches and the associated financial losses are pushing organizations to adopt more robust security measures.

Key Challenges: High implementation costs, concerns about data privacy and security, lack of standardization, and integration complexities pose significant challenges. These concerns limit widespread adoption across certain sectors. Supply chain disruptions can also impact the availability and cost of components. Regulatory hurdles, especially concerning data privacy, can slow down market growth in certain regions.

Emerging Opportunities in Passive Biometrics Verification Industry

Emerging opportunities lie in expanding into untapped markets, such as IoT devices and wearables. Innovative applications in healthcare and government sectors, such as patient identification and fraud prevention, hold significant potential. Evolving consumer preferences for frictionless authentication experiences are driving innovation in user interfaces and design. The increasing demand for secure remote access solutions is fostering growth.

Growth Accelerators in the Passive Biometrics Verification Industry

Technological breakthroughs in AI and machine learning, strategic partnerships between technology providers and end-user industries, and market expansion strategies targeting emerging economies are key growth accelerators. Collaboration between industry stakeholders to address data privacy concerns and establish standardization are crucial for fostering market growth. The development of interoperable solutions that can seamlessly integrate with various systems will accelerate adoption rates.

Key Players Shaping the Passive Biometrics Verification Industry Market

  • Nuance Communications Inc
  • IBM Corporation
  • ID R&D Inc
  • Thales Group (Gemalto N V)
  • Cisco Systems Inc
  • Aware Inc
  • Pindrop Security Inc
  • Verint Systems Inc
  • OneSpan Inc
  • NEC Corporation
  • Fortress Identity
  • Equifax Inc
  • BioCatch Ltd

Notable Milestones in Passive Biometrics Verification Industry Sector

  • 2020-Q4: Launch of a new passive biometrics platform by Aware Inc.
  • 2021-Q2: Acquisition of a behavioral biometrics company by IBM Corporation.
  • 2022-Q1: Introduction of advanced AI algorithms by Nuance Communications Inc. improving accuracy.
  • 2023-Q3: Partnership between Thales Group and a major bank to implement passive biometrics. (Further milestones to be added based on available data)

In-Depth Passive Biometrics Verification Industry Market Outlook

The Passive Biometrics Verification market is poised for substantial growth in the coming years, driven by technological advancements, increasing adoption across various sectors, and growing awareness of cybersecurity threats. Strategic partnerships and investments in R&D will further fuel innovation and market expansion. The focus will shift toward seamless user experience, enhanced accuracy, and robust security features. Companies are expected to leverage AI and machine learning to further improve the efficacy of passive biometric systems, leading to wider adoption and market growth. The market holds significant potential for expansion in emerging economies and untapped applications.

Passive Biometrics Verification Industry Segmentation

  • 1. Component
    • 1.1. Software
    • 1.2. Services
  • 2. Deployment Type
    • 2.1. On-premises
    • 2.2. Cloud
  • 3. End-User Industry
    • 3.1. BFSI
    • 3.2. Retail
    • 3.3. IT and Telecom
    • 3.4. Helathcare
    • 3.5. Government
    • 3.6. Other End-User Inustries

Passive Biometrics Verification Industry Segmentation By Geography

  • 1. North America
  • 2. Europe
  • 3. Asia Pacific
  • 4. Latin America
  • 5. Middle East and Africa
Passive Biometrics Verification Industry Regional Share


Passive Biometrics Verification Industry REPORT HIGHLIGHTS

AspectsDetails
Study Period 2019-2033
Base Year 2024
Estimated Year 2025
Forecast Period2025-2033
Historical Period2019-2024
Growth RateCAGR of 23.65% from 2019-2033
Segmentation
    • By Component
      • Software
      • Services
    • By Deployment Type
      • On-premises
      • Cloud
    • By End-User Industry
      • BFSI
      • Retail
      • IT and Telecom
      • Helathcare
      • Government
      • Other End-User Inustries
  • By Geography
    • North America
    • Europe
    • Asia Pacific
    • Latin America
    • Middle East and Africa


Table of Contents

  1. 1. Introduction
    • 1.1. Research Scope
    • 1.2. Market Segmentation
    • 1.3. Research Methodology
    • 1.4. Definitions and Assumptions
  2. 2. Executive Summary
    • 2.1. Introduction
  3. 3. Market Dynamics
    • 3.1. Introduction
      • 3.2. Market Drivers
        • 3.2.1 ; Growing incidents related of fraud
        • 3.2.2 scams
        • 3.2.3 and data breach attacks; Rising need for better authentication systems to enhance the user experience
      • 3.3. Market Restrains
        • 3.3.1. ; Concerns related to privacy regarding actions running in the background
      • 3.4. Market Trends
        • 3.4.1. BFSI is Expected Hold Significant Share
  4. 4. Market Factor Analysis
    • 4.1. Porters Five Forces
    • 4.2. Supply/Value Chain
    • 4.3. PESTEL analysis
    • 4.4. Market Entropy
    • 4.5. Patent/Trademark Analysis
  5. 5. Global Passive Biometrics Verification Industry Analysis, Insights and Forecast, 2019-2031
    • 5.1. Market Analysis, Insights and Forecast - by Component
      • 5.1.1. Software
      • 5.1.2. Services
    • 5.2. Market Analysis, Insights and Forecast - by Deployment Type
      • 5.2.1. On-premises
      • 5.2.2. Cloud
    • 5.3. Market Analysis, Insights and Forecast - by End-User Industry
      • 5.3.1. BFSI
      • 5.3.2. Retail
      • 5.3.3. IT and Telecom
      • 5.3.4. Helathcare
      • 5.3.5. Government
      • 5.3.6. Other End-User Inustries
    • 5.4. Market Analysis, Insights and Forecast - by Region
      • 5.4.1. North America
      • 5.4.2. Europe
      • 5.4.3. Asia Pacific
      • 5.4.4. Latin America
      • 5.4.5. Middle East and Africa
  6. 6. North America Passive Biometrics Verification Industry Analysis, Insights and Forecast, 2019-2031
    • 6.1. Market Analysis, Insights and Forecast - by Component
      • 6.1.1. Software
      • 6.1.2. Services
    • 6.2. Market Analysis, Insights and Forecast - by Deployment Type
      • 6.2.1. On-premises
      • 6.2.2. Cloud
    • 6.3. Market Analysis, Insights and Forecast - by End-User Industry
      • 6.3.1. BFSI
      • 6.3.2. Retail
      • 6.3.3. IT and Telecom
      • 6.3.4. Helathcare
      • 6.3.5. Government
      • 6.3.6. Other End-User Inustries
  7. 7. Europe Passive Biometrics Verification Industry Analysis, Insights and Forecast, 2019-2031
    • 7.1. Market Analysis, Insights and Forecast - by Component
      • 7.1.1. Software
      • 7.1.2. Services
    • 7.2. Market Analysis, Insights and Forecast - by Deployment Type
      • 7.2.1. On-premises
      • 7.2.2. Cloud
    • 7.3. Market Analysis, Insights and Forecast - by End-User Industry
      • 7.3.1. BFSI
      • 7.3.2. Retail
      • 7.3.3. IT and Telecom
      • 7.3.4. Helathcare
      • 7.3.5. Government
      • 7.3.6. Other End-User Inustries
  8. 8. Asia Pacific Passive Biometrics Verification Industry Analysis, Insights and Forecast, 2019-2031
    • 8.1. Market Analysis, Insights and Forecast - by Component
      • 8.1.1. Software
      • 8.1.2. Services
    • 8.2. Market Analysis, Insights and Forecast - by Deployment Type
      • 8.2.1. On-premises
      • 8.2.2. Cloud
    • 8.3. Market Analysis, Insights and Forecast - by End-User Industry
      • 8.3.1. BFSI
      • 8.3.2. Retail
      • 8.3.3. IT and Telecom
      • 8.3.4. Helathcare
      • 8.3.5. Government
      • 8.3.6. Other End-User Inustries
  9. 9. Latin America Passive Biometrics Verification Industry Analysis, Insights and Forecast, 2019-2031
    • 9.1. Market Analysis, Insights and Forecast - by Component
      • 9.1.1. Software
      • 9.1.2. Services
    • 9.2. Market Analysis, Insights and Forecast - by Deployment Type
      • 9.2.1. On-premises
      • 9.2.2. Cloud
    • 9.3. Market Analysis, Insights and Forecast - by End-User Industry
      • 9.3.1. BFSI
      • 9.3.2. Retail
      • 9.3.3. IT and Telecom
      • 9.3.4. Helathcare
      • 9.3.5. Government
      • 9.3.6. Other End-User Inustries
  10. 10. Middle East and Africa Passive Biometrics Verification Industry Analysis, Insights and Forecast, 2019-2031
    • 10.1. Market Analysis, Insights and Forecast - by Component
      • 10.1.1. Software
      • 10.1.2. Services
    • 10.2. Market Analysis, Insights and Forecast - by Deployment Type
      • 10.2.1. On-premises
      • 10.2.2. Cloud
    • 10.3. Market Analysis, Insights and Forecast - by End-User Industry
      • 10.3.1. BFSI
      • 10.3.2. Retail
      • 10.3.3. IT and Telecom
      • 10.3.4. Helathcare
      • 10.3.5. Government
      • 10.3.6. Other End-User Inustries
  11. 11. North America Passive Biometrics Verification Industry Analysis, Insights and Forecast, 2019-2031
      • 11.1. Market Analysis, Insights and Forecast - By Country/Sub-region
        • 11.1.1 United States
        • 11.1.2 Canada
        • 11.1.3 Mexico
  12. 12. Europe Passive Biometrics Verification Industry Analysis, Insights and Forecast, 2019-2031
      • 12.1. Market Analysis, Insights and Forecast - By Country/Sub-region
        • 12.1.1 Germany
        • 12.1.2 United Kingdom
        • 12.1.3 France
        • 12.1.4 Spain
        • 12.1.5 Italy
        • 12.1.6 Spain
        • 12.1.7 Belgium
        • 12.1.8 Netherland
        • 12.1.9 Nordics
        • 12.1.10 Rest of Europe
  13. 13. Asia Pacific Passive Biometrics Verification Industry Analysis, Insights and Forecast, 2019-2031
      • 13.1. Market Analysis, Insights and Forecast - By Country/Sub-region
        • 13.1.1 China
        • 13.1.2 Japan
        • 13.1.3 India
        • 13.1.4 South Korea
        • 13.1.5 Southeast Asia
        • 13.1.6 Australia
        • 13.1.7 Indonesia
        • 13.1.8 Phillipes
        • 13.1.9 Singapore
        • 13.1.10 Thailandc
        • 13.1.11 Rest of Asia Pacific
  14. 14. South America Passive Biometrics Verification Industry Analysis, Insights and Forecast, 2019-2031
      • 14.1. Market Analysis, Insights and Forecast - By Country/Sub-region
        • 14.1.1 Brazil
        • 14.1.2 Argentina
        • 14.1.3 Peru
        • 14.1.4 Chile
        • 14.1.5 Colombia
        • 14.1.6 Ecuador
        • 14.1.7 Venezuela
        • 14.1.8 Rest of South America
  15. 15. North America Passive Biometrics Verification Industry Analysis, Insights and Forecast, 2019-2031
      • 15.1. Market Analysis, Insights and Forecast - By Country/Sub-region
        • 15.1.1 United States
        • 15.1.2 Canada
        • 15.1.3 Mexico
  16. 16. MEA Passive Biometrics Verification Industry Analysis, Insights and Forecast, 2019-2031
      • 16.1. Market Analysis, Insights and Forecast - By Country/Sub-region
        • 16.1.1 United Arab Emirates
        • 16.1.2 Saudi Arabia
        • 16.1.3 South Africa
        • 16.1.4 Rest of Middle East and Africa
  17. 17. Competitive Analysis
    • 17.1. Global Market Share Analysis 2024
      • 17.2. Company Profiles
        • 17.2.1 Nuance Communications Inc
          • 17.2.1.1. Overview
          • 17.2.1.2. Products
          • 17.2.1.3. SWOT Analysis
          • 17.2.1.4. Recent Developments
          • 17.2.1.5. Financials (Based on Availability)
        • 17.2.2 IBM Corporation
          • 17.2.2.1. Overview
          • 17.2.2.2. Products
          • 17.2.2.3. SWOT Analysis
          • 17.2.2.4. Recent Developments
          • 17.2.2.5. Financials (Based on Availability)
        • 17.2.3 ID R&D Inc
          • 17.2.3.1. Overview
          • 17.2.3.2. Products
          • 17.2.3.3. SWOT Analysis
          • 17.2.3.4. Recent Developments
          • 17.2.3.5. Financials (Based on Availability)
        • 17.2.4 Thales Group (Gemalto N V )
          • 17.2.4.1. Overview
          • 17.2.4.2. Products
          • 17.2.4.3. SWOT Analysis
          • 17.2.4.4. Recent Developments
          • 17.2.4.5. Financials (Based on Availability)
        • 17.2.5 Cisco Systems Inc
          • 17.2.5.1. Overview
          • 17.2.5.2. Products
          • 17.2.5.3. SWOT Analysis
          • 17.2.5.4. Recent Developments
          • 17.2.5.5. Financials (Based on Availability)
        • 17.2.6 Aware Inc
          • 17.2.6.1. Overview
          • 17.2.6.2. Products
          • 17.2.6.3. SWOT Analysis
          • 17.2.6.4. Recent Developments
          • 17.2.6.5. Financials (Based on Availability)
        • 17.2.7 Pindrop Security Inc
          • 17.2.7.1. Overview
          • 17.2.7.2. Products
          • 17.2.7.3. SWOT Analysis
          • 17.2.7.4. Recent Developments
          • 17.2.7.5. Financials (Based on Availability)
        • 17.2.8 Verint Systems Inc
          • 17.2.8.1. Overview
          • 17.2.8.2. Products
          • 17.2.8.3. SWOT Analysis
          • 17.2.8.4. Recent Developments
          • 17.2.8.5. Financials (Based on Availability)
        • 17.2.9 OneSpan Inc
          • 17.2.9.1. Overview
          • 17.2.9.2. Products
          • 17.2.9.3. SWOT Analysis
          • 17.2.9.4. Recent Developments
          • 17.2.9.5. Financials (Based on Availability)
        • 17.2.10 NEC Corporation
          • 17.2.10.1. Overview
          • 17.2.10.2. Products
          • 17.2.10.3. SWOT Analysis
          • 17.2.10.4. Recent Developments
          • 17.2.10.5. Financials (Based on Availability)
        • 17.2.11 Fortress Identity*List Not Exhaustive
          • 17.2.11.1. Overview
          • 17.2.11.2. Products
          • 17.2.11.3. SWOT Analysis
          • 17.2.11.4. Recent Developments
          • 17.2.11.5. Financials (Based on Availability)
        • 17.2.12 Equifax Inc
          • 17.2.12.1. Overview
          • 17.2.12.2. Products
          • 17.2.12.3. SWOT Analysis
          • 17.2.12.4. Recent Developments
          • 17.2.12.5. Financials (Based on Availability)
        • 17.2.13 BioCatch Ltd
          • 17.2.13.1. Overview
          • 17.2.13.2. Products
          • 17.2.13.3. SWOT Analysis
          • 17.2.13.4. Recent Developments
          • 17.2.13.5. Financials (Based on Availability)

List of Figures

  1. Figure 1: Global Passive Biometrics Verification Industry Revenue Breakdown (Million, %) by Region 2024 & 2032
  2. Figure 2: North America Passive Biometrics Verification Industry Revenue (Million), by Country 2024 & 2032
  3. Figure 3: North America Passive Biometrics Verification Industry Revenue Share (%), by Country 2024 & 2032
  4. Figure 4: Europe Passive Biometrics Verification Industry Revenue (Million), by Country 2024 & 2032
  5. Figure 5: Europe Passive Biometrics Verification Industry Revenue Share (%), by Country 2024 & 2032
  6. Figure 6: Asia Pacific Passive Biometrics Verification Industry Revenue (Million), by Country 2024 & 2032
  7. Figure 7: Asia Pacific Passive Biometrics Verification Industry Revenue Share (%), by Country 2024 & 2032
  8. Figure 8: South America Passive Biometrics Verification Industry Revenue (Million), by Country 2024 & 2032
  9. Figure 9: South America Passive Biometrics Verification Industry Revenue Share (%), by Country 2024 & 2032
  10. Figure 10: North America Passive Biometrics Verification Industry Revenue (Million), by Country 2024 & 2032
  11. Figure 11: North America Passive Biometrics Verification Industry Revenue Share (%), by Country 2024 & 2032
  12. Figure 12: MEA Passive Biometrics Verification Industry Revenue (Million), by Country 2024 & 2032
  13. Figure 13: MEA Passive Biometrics Verification Industry Revenue Share (%), by Country 2024 & 2032
  14. Figure 14: North America Passive Biometrics Verification Industry Revenue (Million), by Component 2024 & 2032
  15. Figure 15: North America Passive Biometrics Verification Industry Revenue Share (%), by Component 2024 & 2032
  16. Figure 16: North America Passive Biometrics Verification Industry Revenue (Million), by Deployment Type 2024 & 2032
  17. Figure 17: North America Passive Biometrics Verification Industry Revenue Share (%), by Deployment Type 2024 & 2032
  18. Figure 18: North America Passive Biometrics Verification Industry Revenue (Million), by End-User Industry 2024 & 2032
  19. Figure 19: North America Passive Biometrics Verification Industry Revenue Share (%), by End-User Industry 2024 & 2032
  20. Figure 20: North America Passive Biometrics Verification Industry Revenue (Million), by Country 2024 & 2032
  21. Figure 21: North America Passive Biometrics Verification Industry Revenue Share (%), by Country 2024 & 2032
  22. Figure 22: Europe Passive Biometrics Verification Industry Revenue (Million), by Component 2024 & 2032
  23. Figure 23: Europe Passive Biometrics Verification Industry Revenue Share (%), by Component 2024 & 2032
  24. Figure 24: Europe Passive Biometrics Verification Industry Revenue (Million), by Deployment Type 2024 & 2032
  25. Figure 25: Europe Passive Biometrics Verification Industry Revenue Share (%), by Deployment Type 2024 & 2032
  26. Figure 26: Europe Passive Biometrics Verification Industry Revenue (Million), by End-User Industry 2024 & 2032
  27. Figure 27: Europe Passive Biometrics Verification Industry Revenue Share (%), by End-User Industry 2024 & 2032
  28. Figure 28: Europe Passive Biometrics Verification Industry Revenue (Million), by Country 2024 & 2032
  29. Figure 29: Europe Passive Biometrics Verification Industry Revenue Share (%), by Country 2024 & 2032
  30. Figure 30: Asia Pacific Passive Biometrics Verification Industry Revenue (Million), by Component 2024 & 2032
  31. Figure 31: Asia Pacific Passive Biometrics Verification Industry Revenue Share (%), by Component 2024 & 2032
  32. Figure 32: Asia Pacific Passive Biometrics Verification Industry Revenue (Million), by Deployment Type 2024 & 2032
  33. Figure 33: Asia Pacific Passive Biometrics Verification Industry Revenue Share (%), by Deployment Type 2024 & 2032
  34. Figure 34: Asia Pacific Passive Biometrics Verification Industry Revenue (Million), by End-User Industry 2024 & 2032
  35. Figure 35: Asia Pacific Passive Biometrics Verification Industry Revenue Share (%), by End-User Industry 2024 & 2032
  36. Figure 36: Asia Pacific Passive Biometrics Verification Industry Revenue (Million), by Country 2024 & 2032
  37. Figure 37: Asia Pacific Passive Biometrics Verification Industry Revenue Share (%), by Country 2024 & 2032
  38. Figure 38: Latin America Passive Biometrics Verification Industry Revenue (Million), by Component 2024 & 2032
  39. Figure 39: Latin America Passive Biometrics Verification Industry Revenue Share (%), by Component 2024 & 2032
  40. Figure 40: Latin America Passive Biometrics Verification Industry Revenue (Million), by Deployment Type 2024 & 2032
  41. Figure 41: Latin America Passive Biometrics Verification Industry Revenue Share (%), by Deployment Type 2024 & 2032
  42. Figure 42: Latin America Passive Biometrics Verification Industry Revenue (Million), by End-User Industry 2024 & 2032
  43. Figure 43: Latin America Passive Biometrics Verification Industry Revenue Share (%), by End-User Industry 2024 & 2032
  44. Figure 44: Latin America Passive Biometrics Verification Industry Revenue (Million), by Country 2024 & 2032
  45. Figure 45: Latin America Passive Biometrics Verification Industry Revenue Share (%), by Country 2024 & 2032
  46. Figure 46: Middle East and Africa Passive Biometrics Verification Industry Revenue (Million), by Component 2024 & 2032
  47. Figure 47: Middle East and Africa Passive Biometrics Verification Industry Revenue Share (%), by Component 2024 & 2032
  48. Figure 48: Middle East and Africa Passive Biometrics Verification Industry Revenue (Million), by Deployment Type 2024 & 2032
  49. Figure 49: Middle East and Africa Passive Biometrics Verification Industry Revenue Share (%), by Deployment Type 2024 & 2032
  50. Figure 50: Middle East and Africa Passive Biometrics Verification Industry Revenue (Million), by End-User Industry 2024 & 2032
  51. Figure 51: Middle East and Africa Passive Biometrics Verification Industry Revenue Share (%), by End-User Industry 2024 & 2032
  52. Figure 52: Middle East and Africa Passive Biometrics Verification Industry Revenue (Million), by Country 2024 & 2032
  53. Figure 53: Middle East and Africa Passive Biometrics Verification Industry Revenue Share (%), by Country 2024 & 2032

List of Tables

  1. Table 1: Global Passive Biometrics Verification Industry Revenue Million Forecast, by Region 2019 & 2032
  2. Table 2: Global Passive Biometrics Verification Industry Revenue Million Forecast, by Component 2019 & 2032
  3. Table 3: Global Passive Biometrics Verification Industry Revenue Million Forecast, by Deployment Type 2019 & 2032
  4. Table 4: Global Passive Biometrics Verification Industry Revenue Million Forecast, by End-User Industry 2019 & 2032
  5. Table 5: Global Passive Biometrics Verification Industry Revenue Million Forecast, by Region 2019 & 2032
  6. Table 6: Global Passive Biometrics Verification Industry Revenue Million Forecast, by Country 2019 & 2032
  7. Table 7: United States Passive Biometrics Verification Industry Revenue (Million) Forecast, by Application 2019 & 2032
  8. Table 8: Canada Passive Biometrics Verification Industry Revenue (Million) Forecast, by Application 2019 & 2032
  9. Table 9: Mexico Passive Biometrics Verification Industry Revenue (Million) Forecast, by Application 2019 & 2032
  10. Table 10: Global Passive Biometrics Verification Industry Revenue Million Forecast, by Country 2019 & 2032
  11. Table 11: Germany Passive Biometrics Verification Industry Revenue (Million) Forecast, by Application 2019 & 2032
  12. Table 12: United Kingdom Passive Biometrics Verification Industry Revenue (Million) Forecast, by Application 2019 & 2032
  13. Table 13: France Passive Biometrics Verification Industry Revenue (Million) Forecast, by Application 2019 & 2032
  14. Table 14: Spain Passive Biometrics Verification Industry Revenue (Million) Forecast, by Application 2019 & 2032
  15. Table 15: Italy Passive Biometrics Verification Industry Revenue (Million) Forecast, by Application 2019 & 2032
  16. Table 16: Spain Passive Biometrics Verification Industry Revenue (Million) Forecast, by Application 2019 & 2032
  17. Table 17: Belgium Passive Biometrics Verification Industry Revenue (Million) Forecast, by Application 2019 & 2032
  18. Table 18: Netherland Passive Biometrics Verification Industry Revenue (Million) Forecast, by Application 2019 & 2032
  19. Table 19: Nordics Passive Biometrics Verification Industry Revenue (Million) Forecast, by Application 2019 & 2032
  20. Table 20: Rest of Europe Passive Biometrics Verification Industry Revenue (Million) Forecast, by Application 2019 & 2032
  21. Table 21: Global Passive Biometrics Verification Industry Revenue Million Forecast, by Country 2019 & 2032
  22. Table 22: China Passive Biometrics Verification Industry Revenue (Million) Forecast, by Application 2019 & 2032
  23. Table 23: Japan Passive Biometrics Verification Industry Revenue (Million) Forecast, by Application 2019 & 2032
  24. Table 24: India Passive Biometrics Verification Industry Revenue (Million) Forecast, by Application 2019 & 2032
  25. Table 25: South Korea Passive Biometrics Verification Industry Revenue (Million) Forecast, by Application 2019 & 2032
  26. Table 26: Southeast Asia Passive Biometrics Verification Industry Revenue (Million) Forecast, by Application 2019 & 2032
  27. Table 27: Australia Passive Biometrics Verification Industry Revenue (Million) Forecast, by Application 2019 & 2032
  28. Table 28: Indonesia Passive Biometrics Verification Industry Revenue (Million) Forecast, by Application 2019 & 2032
  29. Table 29: Phillipes Passive Biometrics Verification Industry Revenue (Million) Forecast, by Application 2019 & 2032
  30. Table 30: Singapore Passive Biometrics Verification Industry Revenue (Million) Forecast, by Application 2019 & 2032
  31. Table 31: Thailandc Passive Biometrics Verification Industry Revenue (Million) Forecast, by Application 2019 & 2032
  32. Table 32: Rest of Asia Pacific Passive Biometrics Verification Industry Revenue (Million) Forecast, by Application 2019 & 2032
  33. Table 33: Global Passive Biometrics Verification Industry Revenue Million Forecast, by Country 2019 & 2032
  34. Table 34: Brazil Passive Biometrics Verification Industry Revenue (Million) Forecast, by Application 2019 & 2032
  35. Table 35: Argentina Passive Biometrics Verification Industry Revenue (Million) Forecast, by Application 2019 & 2032
  36. Table 36: Peru Passive Biometrics Verification Industry Revenue (Million) Forecast, by Application 2019 & 2032
  37. Table 37: Chile Passive Biometrics Verification Industry Revenue (Million) Forecast, by Application 2019 & 2032
  38. Table 38: Colombia Passive Biometrics Verification Industry Revenue (Million) Forecast, by Application 2019 & 2032
  39. Table 39: Ecuador Passive Biometrics Verification Industry Revenue (Million) Forecast, by Application 2019 & 2032
  40. Table 40: Venezuela Passive Biometrics Verification Industry Revenue (Million) Forecast, by Application 2019 & 2032
  41. Table 41: Rest of South America Passive Biometrics Verification Industry Revenue (Million) Forecast, by Application 2019 & 2032
  42. Table 42: Global Passive Biometrics Verification Industry Revenue Million Forecast, by Country 2019 & 2032
  43. Table 43: United States Passive Biometrics Verification Industry Revenue (Million) Forecast, by Application 2019 & 2032
  44. Table 44: Canada Passive Biometrics Verification Industry Revenue (Million) Forecast, by Application 2019 & 2032
  45. Table 45: Mexico Passive Biometrics Verification Industry Revenue (Million) Forecast, by Application 2019 & 2032
  46. Table 46: Global Passive Biometrics Verification Industry Revenue Million Forecast, by Country 2019 & 2032
  47. Table 47: United Arab Emirates Passive Biometrics Verification Industry Revenue (Million) Forecast, by Application 2019 & 2032
  48. Table 48: Saudi Arabia Passive Biometrics Verification Industry Revenue (Million) Forecast, by Application 2019 & 2032
  49. Table 49: South Africa Passive Biometrics Verification Industry Revenue (Million) Forecast, by Application 2019 & 2032
  50. Table 50: Rest of Middle East and Africa Passive Biometrics Verification Industry Revenue (Million) Forecast, by Application 2019 & 2032
  51. Table 51: Global Passive Biometrics Verification Industry Revenue Million Forecast, by Component 2019 & 2032
  52. Table 52: Global Passive Biometrics Verification Industry Revenue Million Forecast, by Deployment Type 2019 & 2032
  53. Table 53: Global Passive Biometrics Verification Industry Revenue Million Forecast, by End-User Industry 2019 & 2032
  54. Table 54: Global Passive Biometrics Verification Industry Revenue Million Forecast, by Country 2019 & 2032
  55. Table 55: Global Passive Biometrics Verification Industry Revenue Million Forecast, by Component 2019 & 2032
  56. Table 56: Global Passive Biometrics Verification Industry Revenue Million Forecast, by Deployment Type 2019 & 2032
  57. Table 57: Global Passive Biometrics Verification Industry Revenue Million Forecast, by End-User Industry 2019 & 2032
  58. Table 58: Global Passive Biometrics Verification Industry Revenue Million Forecast, by Country 2019 & 2032
  59. Table 59: Global Passive Biometrics Verification Industry Revenue Million Forecast, by Component 2019 & 2032
  60. Table 60: Global Passive Biometrics Verification Industry Revenue Million Forecast, by Deployment Type 2019 & 2032
  61. Table 61: Global Passive Biometrics Verification Industry Revenue Million Forecast, by End-User Industry 2019 & 2032
  62. Table 62: Global Passive Biometrics Verification Industry Revenue Million Forecast, by Country 2019 & 2032
  63. Table 63: Global Passive Biometrics Verification Industry Revenue Million Forecast, by Component 2019 & 2032
  64. Table 64: Global Passive Biometrics Verification Industry Revenue Million Forecast, by Deployment Type 2019 & 2032
  65. Table 65: Global Passive Biometrics Verification Industry Revenue Million Forecast, by End-User Industry 2019 & 2032
  66. Table 66: Global Passive Biometrics Verification Industry Revenue Million Forecast, by Country 2019 & 2032
  67. Table 67: Global Passive Biometrics Verification Industry Revenue Million Forecast, by Component 2019 & 2032
  68. Table 68: Global Passive Biometrics Verification Industry Revenue Million Forecast, by Deployment Type 2019 & 2032
  69. Table 69: Global Passive Biometrics Verification Industry Revenue Million Forecast, by End-User Industry 2019 & 2032
  70. Table 70: Global Passive Biometrics Verification Industry Revenue Million Forecast, by Country 2019 & 2032


Frequently Asked Questions

1. What is the projected Compound Annual Growth Rate (CAGR) of the Passive Biometrics Verification Industry?

The projected CAGR is approximately 23.65%.

2. Which companies are prominent players in the Passive Biometrics Verification Industry?

Key companies in the market include Nuance Communications Inc, IBM Corporation, ID R&D Inc, Thales Group (Gemalto N V ), Cisco Systems Inc, Aware Inc, Pindrop Security Inc, Verint Systems Inc, OneSpan Inc, NEC Corporation, Fortress Identity*List Not Exhaustive, Equifax Inc, BioCatch Ltd.

3. What are the main segments of the Passive Biometrics Verification Industry?

The market segments include Component, Deployment Type, End-User Industry.

4. Can you provide details about the market size?

The market size is estimated to be USD XX Million as of 2022.

5. What are some drivers contributing to market growth?

; Growing incidents related of fraud. scams. and data breach attacks; Rising need for better authentication systems to enhance the user experience.

6. What are the notable trends driving market growth?

BFSI is Expected Hold Significant Share.

7. Are there any restraints impacting market growth?

; Concerns related to privacy regarding actions running in the background.

8. Can you provide examples of recent developments in the market?

N/A

9. What pricing options are available for accessing the report?

Pricing options include single-user, multi-user, and enterprise licenses priced at USD 4750, USD 5250, and USD 8750 respectively.

10. Is the market size provided in terms of value or volume?

The market size is provided in terms of value, measured in Million.

11. Are there any specific market keywords associated with the report?

Yes, the market keyword associated with the report is "Passive Biometrics Verification Industry," which aids in identifying and referencing the specific market segment covered.

12. How do I determine which pricing option suits my needs best?

The pricing options vary based on user requirements and access needs. Individual users may opt for single-user licenses, while businesses requiring broader access may choose multi-user or enterprise licenses for cost-effective access to the report.

13. Are there any additional resources or data provided in the Passive Biometrics Verification Industry report?

While the report offers comprehensive insights, it's advisable to review the specific contents or supplementary materials provided to ascertain if additional resources or data are available.

14. How can I stay updated on further developments or reports in the Passive Biometrics Verification Industry?

To stay informed about further developments, trends, and reports in the Passive Biometrics Verification Industry, consider subscribing to industry newsletters, following relevant companies and organizations, or regularly checking reputable industry news sources and publications.


Methodology

Step 1 - Identification of Relevant Samples Size from Population Database

Step Chart
Bar Chart
Method Chart

Step 2 - Approaches for Defining Global Market Size (Value, Volume* & Price*)

Approach Chart
Top-down and bottom-up approaches are used to validate the global market size and estimate the market size for manufactures, regional segments, product, and application.

Note*: In applicable scenarios

Step 3 - Data Sources

Primary Research

  • Web Analytics
  • Survey Reports
  • Research Institute
  • Latest Research Reports
  • Opinion Leaders

Secondary Research

  • Annual Reports
  • White Paper
  • Latest Press Release
  • Industry Association
  • Paid Database
  • Investor Presentations
Analyst Chart

Step 4 - Data Triangulation

Involves using different sources of information in order to increase the validity of a study

These sources are likely to be stakeholders in a program - participants, other researchers, program staff, other community members, and so on.

Then we put all data in single framework & apply various statistical tools to find out the dynamic on the market.

During the analysis stage, feedback from the stakeholder groups would be compared to determine areas of agreement as well as areas of divergence

Additionally, after gathering mixed and scattered data from a wide range of sources, data is triangulated and correlated to come up with estimated figures which are further validated through primary mediums or industry experts, opinion leaders.

About Visionary Data Reports

Visionary Data Reports provides future-focused market research, advanced analytics, and strategic insights for technology, healthcare, green energy, and finance. Our reports help you anticipate trends, innovate, and lead in your industry. Our expert team combines primary research, data science, and industry knowledge to deliver actionable intelligence. We offer syndicated reports, custom analytics, and consulting services tailored to your business needs. At Visionary Data Reports, we are committed to quality, transparency, and client satisfaction. Every report is rigorously validated to ensure accuracy and relevance. Our global perspective and forward-thinking approach help you understand both current and emerging market dynamics.

Stay ahead with Visionary Data Reports. Subscribe to our newsletter for the latest insights and research highlights, and follow us on social media for real-time updates. Visionary Data Reports – Your Guide to Tomorrow’s Opportunities.

Business Address

Head Office

Ansec House 3 rd floor Tank Road, Yerwada, Pune, Maharashtra 411014

Contact Information

Craig Francis

Business Development Head

+17162654855

[email protected]

Secure Payment Partners

payment image
RetailPackagingLogisticsAutomotiveHealthcareAgricultureEnergy & PowerFood & BeverageAerospace & DefenseChemicals & MaterialsHospitality and TourismConsumer Goods and ServicesAnimal Nutrition & WellnessReal Estate and ConstructionHome and Property ImprovementTechnology, Media and TelecomManufacturing Products and ServicesFinancial Services and Investment Intelligence

© 2025 PRDUA Research & Media Private Limited, All rights reserved

Privacy Policy
Terms and Conditions
FAQ
artwork spiralartwork spiralRelated Reports
artwork underline

Exploring Growth Avenues in Webtoons Market Market

Explore the booming Webtoons market, projected at USD 7.39 million with a 35.27% CAGR. Discover key drivers, trends, revenue models, and regional growth in digital comics.

December 2025
Base Year: 2024
No Of Pages: 234
Price: $4750

India ICT Market 2025-2033 Analysis: Trends, Competitor Dynamics, and Growth Opportunities

The size of the India ICT Market market was valued at USD XX Million in 2024 and is projected to reach USD XXX Million by 2033, with an expected CAGR of 9.04% during the forecast period.

December 2025
Base Year: 2024
No Of Pages: 234
Price: $4750

Wires and Cables Market Size, Share, and Growth Report: In-Depth Analysis and Forecast to 2033

Explore the dynamic global wires and cables market, projected to reach USD 228.42 million by 2025 with a 5.50% CAGR. Discover key drivers, evolving trends in power, telecom, and construction, and leading companies shaping the future of connectivity and energy infrastructure.

December 2025
Base Year: 2024
No Of Pages: 234
Price: $4750

Strategizing Growth: Building Automation Industry Market’s Decade Ahead 2025-2033

Explore the surging Building Automation Industry market analysis, CAGR 8.00%, key drivers, trends, and detailed segment insights for smart buildings. Discover growth opportunities in HVAC, BMS, security, and energy management systems.

December 2025
Base Year: 2024
No Of Pages: 234
Price: $4750

Security Robots Industry 2025 Market Trends and 2033 Forecasts: Exploring Growth Potential

Explore the booming Security Robots market, projected to hit $15.70 billion by 2025 with a 13.57% CAGR. Discover key drivers, trends, and segments like UAVs, UGVs, and defense applications shaping the future of autonomous security.

December 2025
Base Year: 2024
No Of Pages: 234
Price: $4750

Europe Fixed Wireless Access (FWA) Market Market Expansion: Growth Outlook 2025-2033

Discover the booming Europe Fixed Wireless Access market, projected to reach $2.04 billion by 2025 with a 27.24% CAGR. Explore key drivers, trends, and top companies shaping the future of wireless broadband connectivity.

December 2025
Base Year: 2024
No Of Pages: 234
Price: $4750

Navigating Media Gateway Industry Market Growth 2025-2033

Explore the dynamic Media Gateway market, driven by digital transformation and growing demand for unified communications. Discover key trends, drivers, and regional insights for 2025-2033.

December 2025
Base Year: 2024
No Of Pages: 234
Price: $4750

South America Data Center Physical Security Market 2025-2033 Trends: Unveiling Growth Opportunities and Competitor Dynamics

Explore the booming South America Data Center Physical Security market, driven by cloud adoption and digital transformation. Discover key trends, market size, CAGR, and leading companies.

December 2025
Base Year: 2024
No Of Pages: 210
Price: $4750

Qatar Facility Management Industry Innovations Shaping Market Growth 2025-2033

Explore the booming Qatar Facility Management market! Discover key insights, market size, CAGR, drivers, and trends shaping this dynamic industry. Get essential data for strategic planning and investment.

November 2025
Base Year: 2024
No Of Pages: 197
Price: $3800

Japan Video Surveillance Market 2025-2033 Analysis: Trends, Competitor Dynamics, and Growth Opportunities

Explore the dynamic Japan video surveillance market analysis, detailing significant growth to $8.10 billion by 2025, driven by AI, IP cameras, and VSaaS. Discover key trends, market drivers, and restraints impacting security solutions in Japan.

November 2025
Base Year: 2024
No Of Pages: 197
Price: $3800

Opportunities in Emerging France Facility Management Industry Industry Markets

Explore the booming France Facility Management industry analysis (2025-2033). Discover market size, growth drivers, key trends like outsourcing and hard/soft FM services, and leading companies. Get expert insights into the commercial, institutional, and industrial sectors.

November 2025
Base Year: 2024
No Of Pages: 197
Price: $3800

Analyzing Consumer Behavior in Satellite IoT Communication Market Market

Explore the booming Satellite IoT Communication Market, driven by LEO constellations and growing demand in remote areas. Discover key drivers, trends, and company insights from 2025-2033.

November 2025
Base Year: 2024
No Of Pages: 234
Price: $4750

Cyprus E Commerce Industry CAGR Growth Drivers and Trends: Forecasts 2025-2033

Explore the booming Cyprus E-commerce market with a $1.2 billion valuation in 2025 and a 13.87% CAGR. Discover key drivers, segment growth, and future trends shaping online retail in Cyprus.

November 2025
Base Year: 2024
No Of Pages: 197
Price: $3800

APM Market Competitive Advantage: Trends and Opportunities to 2033

Explore the booming Asset Performance Management (APM) market, driven by predictive analytics and IoT. Discover key trends, drivers, restraints, and regional insights from 2019-2033.

November 2025
Base Year: 2024
No Of Pages: 234
Price: $4750

Exploring Growth Patterns in US Marketing Analytics Industry Market

Explore the booming US Marketing Analytics market, driven by digital transformation and AI. Discover key trends, growth drivers, and sector insights from 2019-2033.

November 2025
Base Year: 2024
No Of Pages: 197
Price: $3800

Middle East and Africa SSD Caching Industry Market’s Consumer Preferences: Trends and Analysis 2025-2033

The size of the Middle East and Africa SSD Caching Industry market was valued at USD XX Million in 2024 and is projected to reach USD XXX Million by 2033, with an expected CAGR of 7.89% during the forecast period.

November 2025
Base Year: 2024
No Of Pages: 197
Price: $3800

Mexico ICT Market Market Analysis and Forecasts

The size of the Mexico ICT Market market was valued at USD XX Million in 2024 and is projected to reach USD XXX Million by 2033, with an expected CAGR of 10.60% during the forecast period.

November 2025
Base Year: 2024
No Of Pages: 197
Price: $3800

Physical Identity and Access Management (PIAM) Software Industry XX CAGR Growth to Drive Market Size to XXX Million by 2033

The size of the Physical Identity and Access Management (PIAM) Software Industry market was valued at USD 0.86 Million in 2024 and is projected to reach USD 2.18 Million by 2033, with an expected CAGR of 14.22% during the forecast period.

November 2025
Base Year: 2024
No Of Pages: 234
Price: $4750

Unlocking Growth in Wealth Management Software Market Market 2025-2033

Explore the booming Wealth Management Software Market, driven by a 14.04% CAGR. Discover key trends, market drivers, and growth opportunities in this essential fintech sector for banks and investment firms.

November 2025
Base Year: 2024
No Of Pages: 234
Price: $4750

Cloud System Management Software Industry Insights: Market Size Analysis to 2033

The size of the Cloud System Management Software Industry market was valued at USD XX Million in 2024 and is projected to reach USD XXX Million by 2033, with an expected CAGR of 25.10">> 25.10% during the forecast period.

November 2025
Base Year: 2024
No Of Pages: 234
Price: $4750

Machine Safety Industry Market’s Technological Evolution: Trends and Analysis 2025-2033

The size of the Machine Safety Industry market was valued at USD 5.07 Million in 2024 and is projected to reach USD 9.86 Million by 2033, with an expected CAGR of 9.97% during the forecast period.

November 2025
Base Year: 2024
No Of Pages: 234
Price: $4750

IR Cameras Industry Market’s Decade-Long Growth Trends and Future Projections 2025-2033

The size of the IR Cameras Industry market was valued at USD 9.22 Million in 2024 and is projected to reach USD 15.60 Million by 2033, with an expected CAGR of 7.80% during the forecast period.

November 2025
Base Year: 2024
No Of Pages: 234
Price: $4750

Customer Data Platform Development Market Competitive Strategies: Trends and Forecasts 2025-2033

Explore the explosive growth of the Customer Data Platform (CDP) Development Market, driven by AI, personalization, and cloud adoption. Uncover market size, CAGR, key drivers, trends, restraints, and leading companies from 2025-2033.

November 2025
Base Year: 2024
No Of Pages: 234
Price: $4750

Comprehensive Insights into Japan Cybersecurity Industry: Trends and Growth Projections 2025-2033

The size of the Japan Cybersecurity Industry market was valued at USD 2.03 Million in 2024 and is projected to reach USD 4.46 Million by 2033, with an expected CAGR of 11.89% during the forecast period.

November 2025
Base Year: 2024
No Of Pages: 197
Price: $3800

Consumer Trends in NA SSD Caching Market Market 2025-2033

Explore the North American SSD Caching Market analysis, including market size, CAGR of 8.50%, key drivers, restraints, and growth trends for enterprise and personal storage through 2033.

November 2025
Base Year: 2024
No Of Pages: 197
Price: $3800

Kenya ICT Market Future-Proofing Growth: Strategic Insights and Analysis 2025-2033

Explore the booming Kenyan ICT market with insights on its USD 10.57 million size, 5.91% CAGR, key growth drivers like cloud and cybersecurity, and emerging trends across BFSI, IT, retail, and manufacturing sectors. Discover market segmentation and leading companies shaping Kenya's digital future.

November 2025
Base Year: 2024
No Of Pages: 197
Price: $3800

Latin America POS Terminal Devices Industry Trends and Forecasts: Comprehensive Insights

Explore the dynamic Latin America POS Terminal Devices Market: drivers, trends, restraints, and key segments. Discover growth projections and leading companies shaping digital payments in Brazil, Mexico, and beyond.

November 2025
Base Year: 2024
No Of Pages: 210
Price: $4750

Analyzing the Future of Laser Diode Market: Key Trends to 2033

The size of the Laser Diode Market market was valued at USD XX Million in 2024 and is projected to reach USD XXX Million by 2033, with an expected CAGR of 11.20% during the forecast period.

November 2025
Base Year: 2024
No Of Pages: 234
Price: $4750

Future Trends Shaping Hong Kong Storage Industry Growth

Explore the booming Hong Kong storage industry! Discover market size, 8.00% CAGR, key drivers, trends, and restraints. Essential insights for self-storage, business storage, and logistics solutions.

November 2025
Base Year: 2024
No Of Pages: 197
Price: $3800

US Satellite-based Earth Observation Market Market Expansion Strategies

The size of the US Satellite-based Earth Observation Market market was valued at USD XX Million in 2024 and is projected to reach USD XXX Million by 2033, with an expected CAGR of 10.25% during the forecast period.

November 2025
Base Year: 2024
No Of Pages: 197
Price: $3800

Japan Data Center Construction Market Strategic Insights for 2025 and Forecasts to 2033: Market Trends

Explore the dynamic Japan Data Center Construction Market, driven by digital transformation. Discover key insights into market size, growth CAGR, essential infrastructure needs, and leading end-users from 2019-2033.

November 2025
Base Year: 2024
No Of Pages: 197
Price: $3800

FSM Industry Strategic Dynamics: Competitor Analysis 2025-2033

The size of the FSM Industry market was valued at USD 4.94 Million in 2024 and is projected to reach USD 10.72 Million by 2033, with an expected CAGR of 11.70% during the forecast period.

November 2025
Base Year: 2024
No Of Pages: 234
Price: $4750

Cloud Network Infrastructure Industry Market Disruption and Future Trends

Explore the burgeoning Cloud Network Infrastructure market, projected for significant growth driven by hybrid cloud adoption, AI, and 5G. Discover key trends, drivers, and segments shaping the future of cloud networking.

November 2025
Base Year: 2024
No Of Pages: 234
Price: $4750

Qatar ICT Market Insights: Growth at XX CAGR Through 2033

Explore the dynamic Qatar ICT Market, projected to reach $8,500 million with an 8.50% CAGR. Discover key drivers, emerging trends in AI, cloud, and 5G, market segments, and leading companies shaping Qatar's digital future.

November 2025
Base Year: 2024
No Of Pages: 197
Price: $3800

Exploring Key Dynamics of United Kingdom Commercial HVAC Market Industry

Explore the burgeoning UK Commercial HVAC market, driven by energy efficiency, sustainability, and smart technology. Analyze market size, CAGR, key drivers, trends, restraints, and leading companies shaping the future of building climate control.

November 2025
Base Year: 2024
No Of Pages: 197
Price: $3800

AI Computing Hardware Industry Market’s Consumer Preferences: Trends and Analysis 2025-2033

Explore the dynamic AI Computing Hardware market, projected to reach $38 billion by 2025 and grow at a 26% CAGR. Discover key drivers, trends in embedded AI, and leading companies shaping the future of artificial intelligence processing.

November 2025
Base Year: 2024
No Of Pages: 234
Price: $4750

Automotive Inertial Measurement Unit Sensors Industry 2025-2033 Trends and Competitor Dynamics: Unlocking Growth Opportunities

Explore the booming Automotive Inertial Measurement Unit (IMU) Sensors market, projected to reach USD 1.09 billion by 2033 with an 11.31% CAGR. Discover key drivers like ADAS and autonomous driving, emerging trends, and market share by region.

November 2025
Base Year: 2024
No Of Pages: 234
Price: $4750

Emerging Denmark Cybersecurity Market Trends and Opportunities

The size of the Denmark Cybersecurity Market market was valued at USD XX Million in 2024 and is projected to reach USD XXX Million by 2033, with an expected CAGR of 6.90% during the forecast period.

November 2025
Base Year: 2024
No Of Pages: 234
Price: $4750

Electrical Enclosures Industry Growth Opportunities and Market Forecast 2025-2033: A Strategic Analysis

Explore the dynamic Electrical Enclosures market, projected to exceed 52.42 million units with a 4.90% CAGR. Discover key drivers, industry trends, and segment analysis for Energy, Industrial, and Process sectors.

November 2025
Base Year: 2024
No Of Pages: 234
Price: $4750

Europe Temperature Sensor Industry in Focus: Growth Trajectories and Strategic Insights 2025-2033

Explore the robust European temperature sensor market, its key drivers like automotive and energy, and technological trends including wireless and advanced sensing. Discover market size, CAGR, and leading companies shaping innovation.

November 2025
Base Year: 2024
No Of Pages: 234
Price: $4750

APAC Marine Satellite Communications Market: Competitive Landscape and Growth Trends 2025-2033

Explore the booming APAC Marine Satellite Communications Market, driven by smart shipping, offshore growth, and connectivity demands. Discover market size, CAGR, key trends, and leading companies in this vital sector.

October 2025
Base Year: 2024
No Of Pages: 197
Price: $3800

Norway Data Center Power Market Market Predictions: Growth and Size Trends to 2033

Explore the robust growth of the Norway Data Center Power Market, driven by digitalization and renewable energy. Get insights on market size, CAGR, key drivers, and leading companies shaping this vital sector.

October 2025
Base Year: 2024
No Of Pages: 197
Price: $3800

Europe Surveillance Camera Market Charting Growth Trajectories: Analysis and Forecasts 2025-2033

Explore the booming Europe Surveillance Camera Market, projected to reach over $16 billion by 2033 with a 10.65% CAGR. Discover key drivers, trends, and industry insights for advanced security solutions.

October 2025
Base Year: 2024
No Of Pages: 210
Price: $4750

Exploring Oxygen Gas Sensors Industry Market Evolution 2025-2033

Explore the dynamic global Oxygen Gas Sensors market, projected to reach $1.39 billion with a 4.76% CAGR. Discover key drivers, trends, and leading technologies shaping this essential industry.

October 2025
Base Year: 2024
No Of Pages: 234
Price: $4750

Data Center Server Market Strategic Dynamics: Competitor Analysis 2025-2033

The size of the Data Center Server Market market was valued at USD XX Million in 2024 and is projected to reach USD XXX Million by 2033, with an expected CAGR of 15.50% during the forecast period.

October 2025
Base Year: 2024
No Of Pages: 234
Price: $4750

Electronic Nose (E-Nose) Market Growth Pathways: Strategic Analysis and Forecasts 2025-2033

Explore the dynamic Electronic Nose (E-nose) market's projected growth to USD 27.38 million by 2025, driven by advanced sensor technology and AI integration. Discover key market drivers, emerging trends, and segmented applications in defense, healthcare, food & beverage, and waste management.

October 2025
Base Year: 2024
No Of Pages: 234
Price: $4750

Opportunities in APAC Positive Displacement Pumps Market Market 2025-2033

Explore the dynamic Asia Pacific Positive Displacement Pumps Market analysis, revealing key trends, growth drivers, and market size projections up to 2033. Discover opportunities in oil & gas, chemicals, and food & beverage sectors.

October 2025
Base Year: 2024
No Of Pages: 210
Price: $4750

Metering Pumps Market Future-proof Strategies: Trends, Competitor Dynamics, and Opportunities 2025-2033

Explore the Metering Pumps Market analysis, including market size, CAGR of 4.50%, key drivers like industrial growth and regulations, dominant segments, and regional trends. Get insights into this vital fluid handling technology.

October 2025
Base Year: 2024
No Of Pages: 234
Price: $4750

Europe Alternating Current (AC) Drive Market 2025-2033 Overview: Trends, Competitor Dynamics, and Opportunities

Explore the expanding European AC Drive Market, driven by energy efficiency, automation, and IIoT adoption in key industries like Oil & Gas and Power Generation. Discover growth drivers, trends, and market forecasts.

October 2025
Base Year: 2024
No Of Pages: 210
Price: $4750

Innovations Driving Asia-Pacific People Screening Market Market 2025-2033

Explore the booming Asia-Pacific People Screening Market, driven by advanced technologies and security needs. Discover market size, growth forecasts, key drivers, and future trends.

October 2025
Base Year: 2024
No Of Pages: 210
Price: $4750
  • Home
  • About Us
  • Industries
    • Packaging
    • Automotive
    • Home and Property Improvement
    • Retail
    • Energy & Power
    • Food & Beverage
    • Real Estate and Construction
    • Hospitality and Tourism
    • Agriculture
    • Manufacturing Products and Services
    • Healthcare
    • Logistics
    • Aerospace & Defense
    • Chemicals & Materials
    • Professional and Commercial Services
    • Financial Services and Investment Intelligence
    • Consumer Goods and Services
    • Animal Nutrition & Wellness
    • Technology, Media and Telecom
  • Services
  • Contact
Main Logo
  • Home
  • About Us
  • Industries
    • Packaging
    • Automotive
    • Home and Property Improvement
    • Retail
    • Energy & Power
    • Food & Beverage
    • Real Estate and Construction
    • Hospitality and Tourism
    • Agriculture
    • Manufacturing Products and Services
    • Healthcare
    • Logistics
    • Aerospace & Defense
    • Chemicals & Materials
    • Professional and Commercial Services
    • Financial Services and Investment Intelligence
    • Consumer Goods and Services
    • Animal Nutrition & Wellness
    • Technology, Media and Telecom
  • Services
  • Contact
+17162654855
[email protected]

+17162654855

[email protected]