

Key Insights
The global mobile marketing market is experiencing significant expansion, propelled by widespread smartphone adoption and increasing mobile internet usage. With a projected Compound Annual Growth Rate (CAGR) of 23.9%, the market is poised for substantial growth from 2023 to 2033. This upward trajectory is driven by continuous advancements in mobile technology, including 5G integration and enhanced device capabilities, fostering more sophisticated marketing campaigns. The shift towards mobile-first consumer experiences and the proliferation of mobile commerce further amplify the demand for effective mobile marketing solutions. The diversification of advertising formats, encompassing in-app ads, video, and location-based marketing, offers marketers enhanced targeting and impact. Moreover, the adoption of data analytics and AI-driven automation is optimizing campaign performance and ROI, fueling market growth.
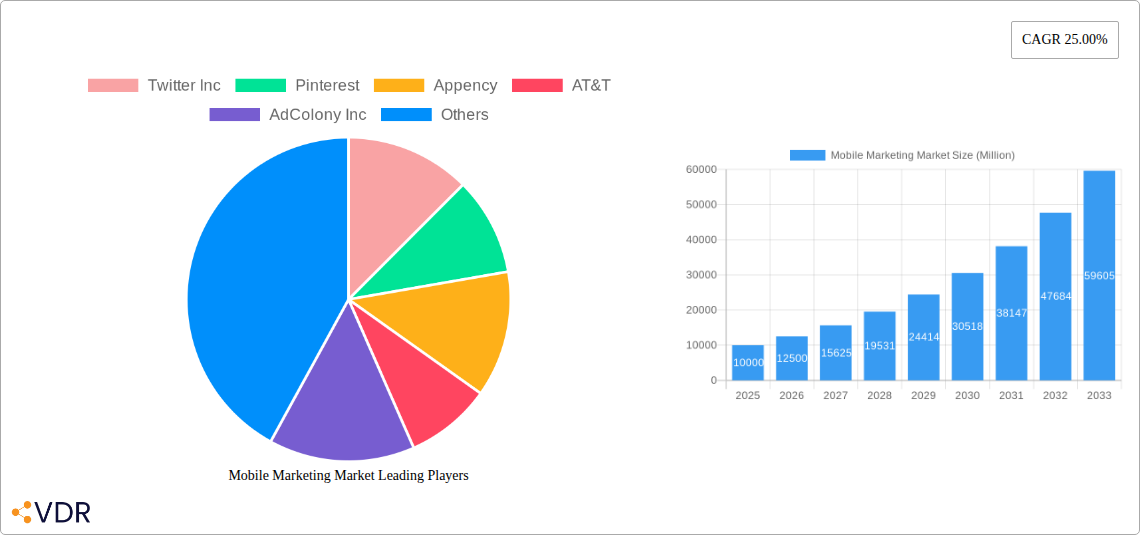
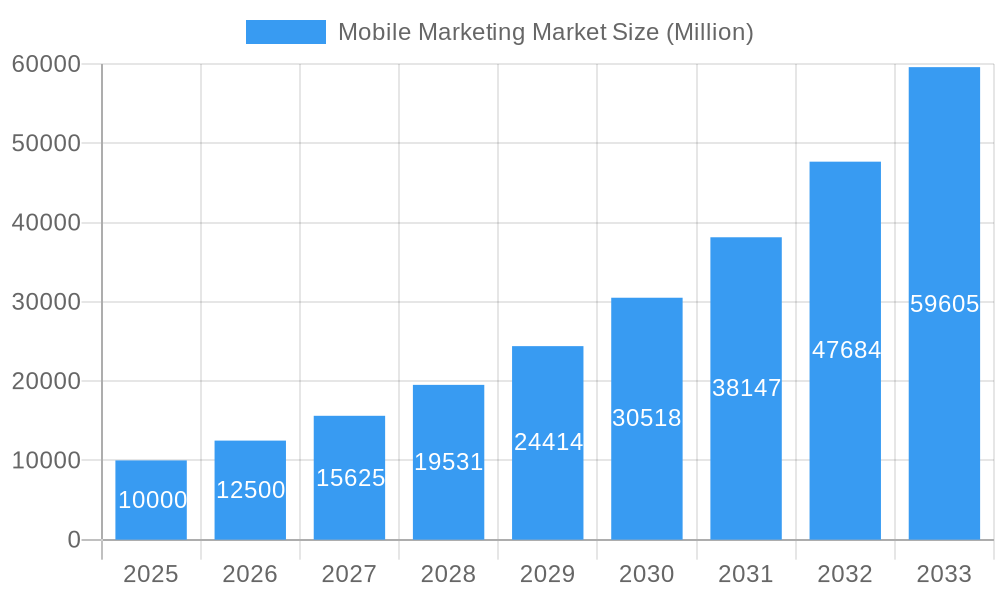
Mobile Marketing Market Market Size (In Billion)
Market segmentation reveals dynamic opportunities across various channels and industries. Affiliate, omni-channel, and social media marketing strategies remain key drivers. While retail, telecommunications, and media & entertainment currently lead in adoption, sectors like education, automotive, and travel & logistics present considerable growth potential as they increasingly utilize mobile engagement. Despite challenges such as ad-blocking software and data privacy concerns, sustained market expansion is anticipated, driven by technological innovation and evolving consumer behavior. Leading players like Google, Facebook, and Twitter highlight the market's competitive and strategic importance within the digital marketing ecosystem. Geographically, North America, Europe, and Asia-Pacific are key growth regions, with emerging markets in South America and MEA also contributing.
Mobile Marketing Market Company Market Share
This report delivers a comprehensive analysis of the Mobile Marketing Market, detailing market dynamics, growth trends, dominant segments, and key stakeholders. Covering the period from 2019 to 2033, with a base year of 2023 and a forecast period of 2023-2033, this analysis serves as an essential resource for professionals, investors, and strategists navigating this evolving market. The estimated market size in 2023 stands at $18.9 billion.
Mobile Marketing Market Dynamics & Structure
The mobile marketing market is characterized by intense competition, rapid technological advancements, and evolving regulatory landscapes. Market concentration is moderate, with a few dominant players alongside numerous niche players. Technological innovation, particularly in areas such as AI-powered personalization, programmatic advertising, and in-app advertising, is a key driver. Regulatory frameworks concerning data privacy (e.g., GDPR, CCPA) significantly influence market strategies. Competitive substitutes include traditional marketing channels, but mobile's reach and targeted capabilities provide a strong advantage. End-user demographics are increasingly diverse, with marketers focusing on personalized experiences across age groups and interests. M&A activity has been robust, with larger companies acquiring smaller firms to expand their capabilities and market reach. The number of M&A deals in the past five years is estimated to be xx.
- Market Concentration: Moderate, with a top 5 market share of approximately xx%.
- Technological Innovation: AI-powered personalization, programmatic advertising, in-app advertising are key drivers.
- Regulatory Frameworks: GDPR, CCPA, and other regional regulations impact data usage and targeting strategies.
- Competitive Substitutes: Traditional marketing channels, but mobile offers superior targeting and reach.
- End-User Demographics: Diverse, requiring personalized and segmented marketing approaches.
- M&A Trends: Significant activity, with xx deals closed in the last 5 years, driven by expansion and technological acquisition.
Mobile Marketing Market Growth Trends & Insights
The mobile marketing market has experienced substantial growth, driven by factors such as increasing smartphone penetration, the rise of social media, and the proliferation of mobile applications. The market size has grown from xx Million Units in 2019 to an estimated xx Million Units in 2025, exhibiting a Compound Annual Growth Rate (CAGR) of xx% during the historical period. Technological disruptions, such as the advent of 5G, are further accelerating market expansion. Consumer behavior shifts towards mobile-first consumption and an increased reliance on mobile devices for information and purchasing decisions fuel this growth. Market penetration is expected to reach xx% by 2033. The increasing adoption of programmatic advertising, coupled with advancements in data analytics, enhances campaign effectiveness and return on investment (ROI).
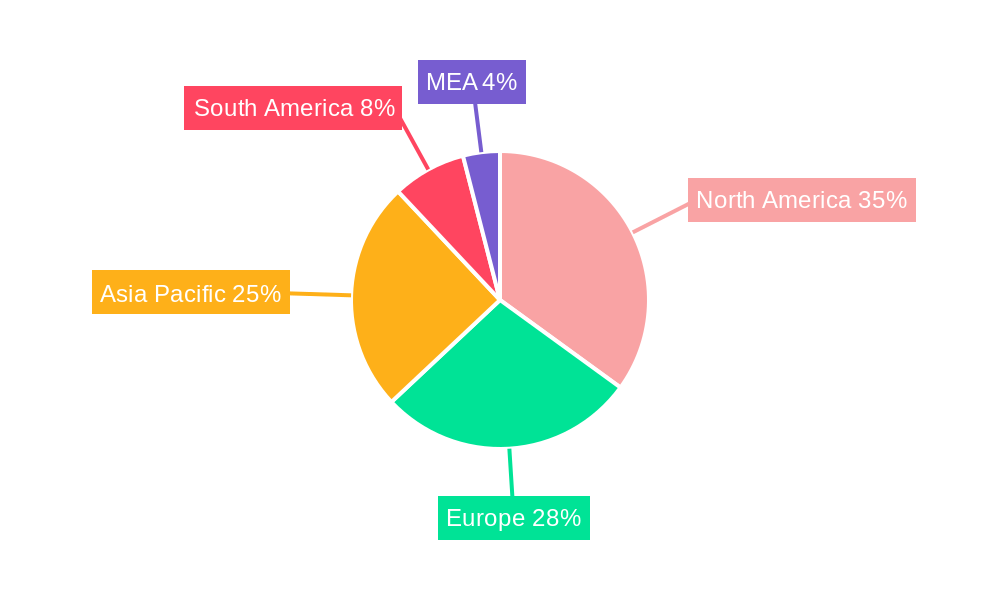
Dominant Regions, Countries, or Segments in Mobile Marketing Market
North America currently dominates the mobile marketing market, driven by high smartphone penetration, advanced technological infrastructure, and a strong digital advertising ecosystem. However, Asia-Pacific is projected to witness the fastest growth rate due to its large and rapidly expanding mobile user base. Within market segments, Social Media Marketing holds the largest market share among distribution channels and the retail end-user industry accounts for a significant portion of the overall market value.
By Type: The Solution segment is currently dominant, but the User segment is projected to grow rapidly.
By Distribution Channel: Social Media Marketing enjoys the highest market share, followed by Omni-channel Marketing.
By End-user Industry: Retail, Telecommunication, and Broadcast & Media are the leading sectors, with Retail leading in market share, followed closely by the Telecommunication Sector.
- North America: High smartphone penetration, advanced tech infrastructure, strong digital advertising ecosystem.
- Asia-Pacific: Fastest growth rate due to a large and expanding mobile user base.
- Europe: Significant market size, driven by strong digital adoption and regulatory frameworks.
- Social Media Marketing: Largest share among distribution channels due to high user engagement.
- Retail Industry: Dominates the end-user segment due to high mobile commerce adoption.
Mobile Marketing Market Product Landscape
Mobile marketing solutions are increasingly sophisticated, incorporating features such as AI-driven personalization, advanced analytics, and cross-platform campaign management. New product innovations focus on enhancing user experience, improving targeting accuracy, and optimizing campaign performance. Key performance indicators (KPIs) include click-through rates (CTRs), conversion rates, and return on ad spend (ROAS). Unique selling propositions often center on innovative targeting technologies, robust analytics dashboards, and seamless cross-channel integration.
Key Drivers, Barriers & Challenges in Mobile Marketing Market
Key Drivers:
- Increasing smartphone penetration and mobile internet usage.
- Rise of mobile commerce and in-app purchases.
- Advancements in mobile advertising technologies (e.g., programmatic advertising, AI).
- Growing demand for personalized mobile marketing campaigns.
Key Challenges:
- Data privacy regulations and concerns over user data security.
- Increasing ad blocking and mobile ad fraud.
- Competition from other marketing channels.
- Measurement challenges in attributing mobile marketing ROI. The impact of these challenges results in an estimated xx% decrease in overall market growth.
Emerging Opportunities in Mobile Marketing Market
- Growth of 5G networks and the Internet of Things (IoT) opens new avenues for mobile advertising.
- Expansion into untapped markets in developing countries presents significant potential.
- Increasing use of augmented reality (AR) and virtual reality (VR) in mobile marketing.
- Focus on mobile-first strategies to reach younger generations.
Growth Accelerators in the Mobile Marketing Market Industry
Strategic partnerships between mobile marketing platforms and technology providers are driving innovation and market expansion. Technological breakthroughs in areas such as AI, machine learning, and big data analytics are enhancing the effectiveness of mobile marketing campaigns. Market expansion into new geographic regions and emerging sectors is creating new opportunities for growth.
Key Players Shaping the Mobile Marketing Market Market
- Twitter Inc
- Appency
- AT&T
- AdColony Inc
- Microsoft Corporation
- InMobi
- One by AOL (Millennial Media)
- Facebook Inc
- GroundTruth
- Mobio
- Google Inc
- OpenMarket
- Phonevalley
Notable Milestones in Mobile Marketing Market Sector
- October 2022: Adverty AB (publ) partners with Apex Gaming Network to expand in-game advertising in Canada and the US.
- December 2022: Remerge launches a partnership program to empower agencies in programmatic in-app advertising.
In-Depth Mobile Marketing Market Market Outlook
The mobile marketing market is poised for sustained growth, driven by technological advancements, evolving consumer behavior, and expanding market penetration. Strategic partnerships and investments in innovative solutions will shape the market landscape. The future holds significant potential for players who leverage data-driven insights, personalize campaigns, and embrace new technologies to deliver compelling mobile experiences.
Mobile Marketing Market Segmentation
-
1. Type
- 1.1. Solution
- 1.2. User
-
2. End-user Industry
- 2.1. Retail
- 2.2. Telecommunication
- 2.3. Broadcast and Media
- 2.4. Travel & Logistics
- 2.5. Education
- 2.6. Automotive
- 2.7. Other End-user Industries
-
3. Distribution Channel
- 3.1. Affiliate Marketing
- 3.2. Omni-channel Marketing
- 3.3. Social Media Marketing
- 3.4. Content Marketing
- 3.5. Online Public Relations
Mobile Marketing Market Segmentation By Geography
-
1. North America
- 1.1. United States
- 1.2. Canada
-
2. Europe
- 2.1. United Kingdom
- 2.2. Germany
- 2.3. France
- 2.4. Rest of Europe
-
3. Asia Pacific
- 3.1. China
- 3.2. Japan
- 3.3. Australia
- 3.4. Rest of Asia Pacific
-
4. Latin America
- 4.1. Mexico
- 4.2. Brazil
- 4.3. Rest of Latin America
- 5. Middle East
-
6. United Arab Emirates
- 6.1. Saudi Arabia
- 6.2. Rest of Middle East
Mobile Marketing Market Regional Market Share
Geographic Coverage of Mobile Marketing Market
Mobile Marketing Market REPORT HIGHLIGHTS
| Aspects | Details |
|---|---|
| Study Period | 2020-2034 |
| Base Year | 2025 |
| Estimated Year | 2026 |
| Forecast Period | 2026-2034 |
| Historical Period | 2020-2025 |
| Growth Rate | CAGR of 23.9% from 2020-2034 |
| Segmentation |
|
Table of Contents
- 1. Introduction
- 1.1. Research Scope
- 1.2. Market Segmentation
- 1.3. Research Objective
- 1.4. Definitions and Assumptions
- 2. Executive Summary
- 2.1. Market Snapshot
- 3. Market Dynamics
- 3.1. Market Drivers
- 3.2. Market Restrains
- 3.3. Market Trends
- 3.4. Market Opportunities
- 4. Market Factor Analysis
- 4.1. Porters Five Forces
- 4.1.1. Bargaining Power of Suppliers
- 4.1.2. Bargaining Power of Buyers
- 4.1.3. Threat of New Entrants
- 4.1.4. Threat of Substitutes
- 4.1.5. Competitive Rivalry
- 4.2. PESTEL analysis
- 4.3. BCG Analysis
- 4.3.1. Stars (High Growth, High Market Share)
- 4.3.2. Cash Cows (Low Growth, High Market Share)
- 4.3.3. Question Mark (High Growth, Low Market Share)
- 4.3.4. Dogs (Low Growth, Low Market Share)
- 4.4. Ansoff Matrix Analysis
- 4.5. Supply Chain Analysis
- 4.6. Regulatory Landscape
- 4.7. Current Market Potential and Opportunity Assessment (TAM–SAM–SOM Framework)
- 4.8. VDR Analyst Note
- 4.1. Porters Five Forces
- 5. Market Analysis, Insights and Forecast 2021-2033
- 5.1. Market Analysis, Insights and Forecast - by Type
- 5.1.1. Solution
- 5.1.2. User
- 5.2. Market Analysis, Insights and Forecast - by End-user Industry
- 5.2.1. Retail
- 5.2.2. Telecommunication
- 5.2.3. Broadcast and Media
- 5.2.4. Travel & Logistics
- 5.2.5. Education
- 5.2.6. Automotive
- 5.2.7. Other End-user Industries
- 5.3. Market Analysis, Insights and Forecast - by Distribution Channel
- 5.3.1. Affiliate Marketing
- 5.3.2. Omni-channel Marketing
- 5.3.3. Social Media Marketing
- 5.3.4. Content Marketing
- 5.3.5. Online Public Relations
- 5.4. Market Analysis, Insights and Forecast - by Region
- 5.4.1. North America
- 5.4.2. Europe
- 5.4.3. Asia Pacific
- 5.4.4. Latin America
- 5.4.5. Middle East
- 5.4.6. United Arab Emirates
- 5.1. Market Analysis, Insights and Forecast - by Type
- 6. Global Mobile Marketing Market Analysis, Insights and Forecast, 2021-2033
- 6.1. Market Analysis, Insights and Forecast - by Type
- 6.1.1. Solution
- 6.1.2. User
- 6.2. Market Analysis, Insights and Forecast - by End-user Industry
- 6.2.1. Retail
- 6.2.2. Telecommunication
- 6.2.3. Broadcast and Media
- 6.2.4. Travel & Logistics
- 6.2.5. Education
- 6.2.6. Automotive
- 6.2.7. Other End-user Industries
- 6.3. Market Analysis, Insights and Forecast - by Distribution Channel
- 6.3.1. Affiliate Marketing
- 6.3.2. Omni-channel Marketing
- 6.3.3. Social Media Marketing
- 6.3.4. Content Marketing
- 6.3.5. Online Public Relations
- 6.1. Market Analysis, Insights and Forecast - by Type
- 7. North America Mobile Marketing Market Analysis, Insights and Forecast, 2021-2033
- 7.1. Market Analysis, Insights and Forecast - by Type
- 7.1.1. Solution
- 7.1.2. User
- 7.2. Market Analysis, Insights and Forecast - by End-user Industry
- 7.2.1. Retail
- 7.2.2. Telecommunication
- 7.2.3. Broadcast and Media
- 7.2.4. Travel & Logistics
- 7.2.5. Education
- 7.2.6. Automotive
- 7.2.7. Other End-user Industries
- 7.3. Market Analysis, Insights and Forecast - by Distribution Channel
- 7.3.1. Affiliate Marketing
- 7.3.2. Omni-channel Marketing
- 7.3.3. Social Media Marketing
- 7.3.4. Content Marketing
- 7.3.5. Online Public Relations
- 7.1. Market Analysis, Insights and Forecast - by Type
- 8. Europe Mobile Marketing Market Analysis, Insights and Forecast, 2021-2033
- 8.1. Market Analysis, Insights and Forecast - by Type
- 8.1.1. Solution
- 8.1.2. User
- 8.2. Market Analysis, Insights and Forecast - by End-user Industry
- 8.2.1. Retail
- 8.2.2. Telecommunication
- 8.2.3. Broadcast and Media
- 8.2.4. Travel & Logistics
- 8.2.5. Education
- 8.2.6. Automotive
- 8.2.7. Other End-user Industries
- 8.3. Market Analysis, Insights and Forecast - by Distribution Channel
- 8.3.1. Affiliate Marketing
- 8.3.2. Omni-channel Marketing
- 8.3.3. Social Media Marketing
- 8.3.4. Content Marketing
- 8.3.5. Online Public Relations
- 8.1. Market Analysis, Insights and Forecast - by Type
- 9. Asia Pacific Mobile Marketing Market Analysis, Insights and Forecast, 2021-2033
- 9.1. Market Analysis, Insights and Forecast - by Type
- 9.1.1. Solution
- 9.1.2. User
- 9.2. Market Analysis, Insights and Forecast - by End-user Industry
- 9.2.1. Retail
- 9.2.2. Telecommunication
- 9.2.3. Broadcast and Media
- 9.2.4. Travel & Logistics
- 9.2.5. Education
- 9.2.6. Automotive
- 9.2.7. Other End-user Industries
- 9.3. Market Analysis, Insights and Forecast - by Distribution Channel
- 9.3.1. Affiliate Marketing
- 9.3.2. Omni-channel Marketing
- 9.3.3. Social Media Marketing
- 9.3.4. Content Marketing
- 9.3.5. Online Public Relations
- 9.1. Market Analysis, Insights and Forecast - by Type
- 10. Latin America Mobile Marketing Market Analysis, Insights and Forecast, 2021-2033
- 10.1. Market Analysis, Insights and Forecast - by Type
- 10.1.1. Solution
- 10.1.2. User
- 10.2. Market Analysis, Insights and Forecast - by End-user Industry
- 10.2.1. Retail
- 10.2.2. Telecommunication
- 10.2.3. Broadcast and Media
- 10.2.4. Travel & Logistics
- 10.2.5. Education
- 10.2.6. Automotive
- 10.2.7. Other End-user Industries
- 10.3. Market Analysis, Insights and Forecast - by Distribution Channel
- 10.3.1. Affiliate Marketing
- 10.3.2. Omni-channel Marketing
- 10.3.3. Social Media Marketing
- 10.3.4. Content Marketing
- 10.3.5. Online Public Relations
- 10.1. Market Analysis, Insights and Forecast - by Type
- 11. Middle East Mobile Marketing Market Analysis, Insights and Forecast, 2021-2033
- 11.1. Market Analysis, Insights and Forecast - by Type
- 11.1.1. Solution
- 11.1.2. User
- 11.2. Market Analysis, Insights and Forecast - by End-user Industry
- 11.2.1. Retail
- 11.2.2. Telecommunication
- 11.2.3. Broadcast and Media
- 11.2.4. Travel & Logistics
- 11.2.5. Education
- 11.2.6. Automotive
- 11.2.7. Other End-user Industries
- 11.3. Market Analysis, Insights and Forecast - by Distribution Channel
- 11.3.1. Affiliate Marketing
- 11.3.2. Omni-channel Marketing
- 11.3.3. Social Media Marketing
- 11.3.4. Content Marketing
- 11.3.5. Online Public Relations
- 11.1. Market Analysis, Insights and Forecast - by Type
- 12. United Arab Emirates Mobile Marketing Market Analysis, Insights and Forecast, 2021-2033
- 12.1. Market Analysis, Insights and Forecast - by Type
- 12.1.1. Solution
- 12.1.2. User
- 12.2. Market Analysis, Insights and Forecast - by End-user Industry
- 12.2.1. Retail
- 12.2.2. Telecommunication
- 12.2.3. Broadcast and Media
- 12.2.4. Travel & Logistics
- 12.2.5. Education
- 12.2.6. Automotive
- 12.2.7. Other End-user Industries
- 12.3. Market Analysis, Insights and Forecast - by Distribution Channel
- 12.3.1. Affiliate Marketing
- 12.3.2. Omni-channel Marketing
- 12.3.3. Social Media Marketing
- 12.3.4. Content Marketing
- 12.3.5. Online Public Relations
- 12.1. Market Analysis, Insights and Forecast - by Type
- 13. Competitive Analysis
- 13.1. Company Profiles
- 13.1.1 Twitter Inc
- 13.1.1.1. Company Overview
- 13.1.1.2. Products
- 13.1.1.3. Company Financials
- 13.1.1.4. SWOT Analysis
- 13.1.2 Pinterest
- 13.1.2.1. Company Overview
- 13.1.2.2. Products
- 13.1.2.3. Company Financials
- 13.1.2.4. SWOT Analysis
- 13.1.3 Appency
- 13.1.3.1. Company Overview
- 13.1.3.2. Products
- 13.1.3.3. Company Financials
- 13.1.3.4. SWOT Analysis
- 13.1.4 AT&T
- 13.1.4.1. Company Overview
- 13.1.4.2. Products
- 13.1.4.3. Company Financials
- 13.1.4.4. SWOT Analysis
- 13.1.5 AdColony Inc
- 13.1.5.1. Company Overview
- 13.1.5.2. Products
- 13.1.5.3. Company Financials
- 13.1.5.4. SWOT Analysis
- 13.1.6 Microsoft Corporation
- 13.1.6.1. Company Overview
- 13.1.6.2. Products
- 13.1.6.3. Company Financials
- 13.1.6.4. SWOT Analysis
- 13.1.7 InMobi
- 13.1.7.1. Company Overview
- 13.1.7.2. Products
- 13.1.7.3. Company Financials
- 13.1.7.4. SWOT Analysis
- 13.1.8 One by AOL (Millennial Media)
- 13.1.8.1. Company Overview
- 13.1.8.2. Products
- 13.1.8.3. Company Financials
- 13.1.8.4. SWOT Analysis
- 13.1.9 Facebook Inc
- 13.1.9.1. Company Overview
- 13.1.9.2. Products
- 13.1.9.3. Company Financials
- 13.1.9.4. SWOT Analysis
- 13.1.10 GroundTruth
- 13.1.10.1. Company Overview
- 13.1.10.2. Products
- 13.1.10.3. Company Financials
- 13.1.10.4. SWOT Analysis
- 13.1.11 Mobio
- 13.1.11.1. Company Overview
- 13.1.11.2. Products
- 13.1.11.3. Company Financials
- 13.1.11.4. SWOT Analysis
- 13.1.12 Google Inc
- 13.1.12.1. Company Overview
- 13.1.12.2. Products
- 13.1.12.3. Company Financials
- 13.1.12.4. SWOT Analysis
- 13.1.13 OpenMarket
- 13.1.13.1. Company Overview
- 13.1.13.2. Products
- 13.1.13.3. Company Financials
- 13.1.13.4. SWOT Analysis
- 13.1.14 Phonevalley
- 13.1.14.1. Company Overview
- 13.1.14.2. Products
- 13.1.14.3. Company Financials
- 13.1.14.4. SWOT Analysis
- 13.1.1 Twitter Inc
- 13.2. Market Entropy
- 13.2.1 Company's Key Areas Served
- 13.2.2 Recent Developments
- 13.3. Company Market Share Analysis 2025
- 13.3.1 Top 5 Companies Market Share Analysis
- 13.3.2 Top 3 Companies Market Share Analysis
- 13.4. List of Potential Customers
- 14. Research Methodology
List of Figures
- Figure 1: Global Mobile Marketing Market Revenue Breakdown (billion, %) by Region 2025 & 2033
- Figure 2: North America Mobile Marketing Market Revenue (billion), by Type 2025 & 2033
- Figure 3: North America Mobile Marketing Market Revenue Share (%), by Type 2025 & 2033
- Figure 4: North America Mobile Marketing Market Revenue (billion), by End-user Industry 2025 & 2033
- Figure 5: North America Mobile Marketing Market Revenue Share (%), by End-user Industry 2025 & 2033
- Figure 6: North America Mobile Marketing Market Revenue (billion), by Distribution Channel 2025 & 2033
- Figure 7: North America Mobile Marketing Market Revenue Share (%), by Distribution Channel 2025 & 2033
- Figure 8: North America Mobile Marketing Market Revenue (billion), by Country 2025 & 2033
- Figure 9: North America Mobile Marketing Market Revenue Share (%), by Country 2025 & 2033
- Figure 10: Europe Mobile Marketing Market Revenue (billion), by Type 2025 & 2033
- Figure 11: Europe Mobile Marketing Market Revenue Share (%), by Type 2025 & 2033
- Figure 12: Europe Mobile Marketing Market Revenue (billion), by End-user Industry 2025 & 2033
- Figure 13: Europe Mobile Marketing Market Revenue Share (%), by End-user Industry 2025 & 2033
- Figure 14: Europe Mobile Marketing Market Revenue (billion), by Distribution Channel 2025 & 2033
- Figure 15: Europe Mobile Marketing Market Revenue Share (%), by Distribution Channel 2025 & 2033
- Figure 16: Europe Mobile Marketing Market Revenue (billion), by Country 2025 & 2033
- Figure 17: Europe Mobile Marketing Market Revenue Share (%), by Country 2025 & 2033
- Figure 18: Asia Pacific Mobile Marketing Market Revenue (billion), by Type 2025 & 2033
- Figure 19: Asia Pacific Mobile Marketing Market Revenue Share (%), by Type 2025 & 2033
- Figure 20: Asia Pacific Mobile Marketing Market Revenue (billion), by End-user Industry 2025 & 2033
- Figure 21: Asia Pacific Mobile Marketing Market Revenue Share (%), by End-user Industry 2025 & 2033
- Figure 22: Asia Pacific Mobile Marketing Market Revenue (billion), by Distribution Channel 2025 & 2033
- Figure 23: Asia Pacific Mobile Marketing Market Revenue Share (%), by Distribution Channel 2025 & 2033
- Figure 24: Asia Pacific Mobile Marketing Market Revenue (billion), by Country 2025 & 2033
- Figure 25: Asia Pacific Mobile Marketing Market Revenue Share (%), by Country 2025 & 2033
- Figure 26: Latin America Mobile Marketing Market Revenue (billion), by Type 2025 & 2033
- Figure 27: Latin America Mobile Marketing Market Revenue Share (%), by Type 2025 & 2033
- Figure 28: Latin America Mobile Marketing Market Revenue (billion), by End-user Industry 2025 & 2033
- Figure 29: Latin America Mobile Marketing Market Revenue Share (%), by End-user Industry 2025 & 2033
- Figure 30: Latin America Mobile Marketing Market Revenue (billion), by Distribution Channel 2025 & 2033
- Figure 31: Latin America Mobile Marketing Market Revenue Share (%), by Distribution Channel 2025 & 2033
- Figure 32: Latin America Mobile Marketing Market Revenue (billion), by Country 2025 & 2033
- Figure 33: Latin America Mobile Marketing Market Revenue Share (%), by Country 2025 & 2033
- Figure 34: Middle East Mobile Marketing Market Revenue (billion), by Type 2025 & 2033
- Figure 35: Middle East Mobile Marketing Market Revenue Share (%), by Type 2025 & 2033
- Figure 36: Middle East Mobile Marketing Market Revenue (billion), by End-user Industry 2025 & 2033
- Figure 37: Middle East Mobile Marketing Market Revenue Share (%), by End-user Industry 2025 & 2033
- Figure 38: Middle East Mobile Marketing Market Revenue (billion), by Distribution Channel 2025 & 2033
- Figure 39: Middle East Mobile Marketing Market Revenue Share (%), by Distribution Channel 2025 & 2033
- Figure 40: Middle East Mobile Marketing Market Revenue (billion), by Country 2025 & 2033
- Figure 41: Middle East Mobile Marketing Market Revenue Share (%), by Country 2025 & 2033
- Figure 42: United Arab Emirates Mobile Marketing Market Revenue (billion), by Type 2025 & 2033
- Figure 43: United Arab Emirates Mobile Marketing Market Revenue Share (%), by Type 2025 & 2033
- Figure 44: United Arab Emirates Mobile Marketing Market Revenue (billion), by End-user Industry 2025 & 2033
- Figure 45: United Arab Emirates Mobile Marketing Market Revenue Share (%), by End-user Industry 2025 & 2033
- Figure 46: United Arab Emirates Mobile Marketing Market Revenue (billion), by Distribution Channel 2025 & 2033
- Figure 47: United Arab Emirates Mobile Marketing Market Revenue Share (%), by Distribution Channel 2025 & 2033
- Figure 48: United Arab Emirates Mobile Marketing Market Revenue (billion), by Country 2025 & 2033
- Figure 49: United Arab Emirates Mobile Marketing Market Revenue Share (%), by Country 2025 & 2033
List of Tables
- Table 1: Global Mobile Marketing Market Revenue billion Forecast, by Type 2020 & 2033
- Table 2: Global Mobile Marketing Market Revenue billion Forecast, by End-user Industry 2020 & 2033
- Table 3: Global Mobile Marketing Market Revenue billion Forecast, by Distribution Channel 2020 & 2033
- Table 4: Global Mobile Marketing Market Revenue billion Forecast, by Region 2020 & 2033
- Table 5: Global Mobile Marketing Market Revenue billion Forecast, by Type 2020 & 2033
- Table 6: Global Mobile Marketing Market Revenue billion Forecast, by End-user Industry 2020 & 2033
- Table 7: Global Mobile Marketing Market Revenue billion Forecast, by Distribution Channel 2020 & 2033
- Table 8: Global Mobile Marketing Market Revenue billion Forecast, by Country 2020 & 2033
- Table 9: United States Mobile Marketing Market Revenue (billion) Forecast, by Application 2020 & 2033
- Table 10: Canada Mobile Marketing Market Revenue (billion) Forecast, by Application 2020 & 2033
- Table 11: Global Mobile Marketing Market Revenue billion Forecast, by Type 2020 & 2033
- Table 12: Global Mobile Marketing Market Revenue billion Forecast, by End-user Industry 2020 & 2033
- Table 13: Global Mobile Marketing Market Revenue billion Forecast, by Distribution Channel 2020 & 2033
- Table 14: Global Mobile Marketing Market Revenue billion Forecast, by Country 2020 & 2033
- Table 15: United Kingdom Mobile Marketing Market Revenue (billion) Forecast, by Application 2020 & 2033
- Table 16: Germany Mobile Marketing Market Revenue (billion) Forecast, by Application 2020 & 2033
- Table 17: France Mobile Marketing Market Revenue (billion) Forecast, by Application 2020 & 2033
- Table 18: Rest of Europe Mobile Marketing Market Revenue (billion) Forecast, by Application 2020 & 2033
- Table 19: Global Mobile Marketing Market Revenue billion Forecast, by Type 2020 & 2033
- Table 20: Global Mobile Marketing Market Revenue billion Forecast, by End-user Industry 2020 & 2033
- Table 21: Global Mobile Marketing Market Revenue billion Forecast, by Distribution Channel 2020 & 2033
- Table 22: Global Mobile Marketing Market Revenue billion Forecast, by Country 2020 & 2033
- Table 23: China Mobile Marketing Market Revenue (billion) Forecast, by Application 2020 & 2033
- Table 24: Japan Mobile Marketing Market Revenue (billion) Forecast, by Application 2020 & 2033
- Table 25: Australia Mobile Marketing Market Revenue (billion) Forecast, by Application 2020 & 2033
- Table 26: Rest of Asia Pacific Mobile Marketing Market Revenue (billion) Forecast, by Application 2020 & 2033
- Table 27: Global Mobile Marketing Market Revenue billion Forecast, by Type 2020 & 2033
- Table 28: Global Mobile Marketing Market Revenue billion Forecast, by End-user Industry 2020 & 2033
- Table 29: Global Mobile Marketing Market Revenue billion Forecast, by Distribution Channel 2020 & 2033
- Table 30: Global Mobile Marketing Market Revenue billion Forecast, by Country 2020 & 2033
- Table 31: Mexico Mobile Marketing Market Revenue (billion) Forecast, by Application 2020 & 2033
- Table 32: Brazil Mobile Marketing Market Revenue (billion) Forecast, by Application 2020 & 2033
- Table 33: Rest of Latin America Mobile Marketing Market Revenue (billion) Forecast, by Application 2020 & 2033
- Table 34: Global Mobile Marketing Market Revenue billion Forecast, by Type 2020 & 2033
- Table 35: Global Mobile Marketing Market Revenue billion Forecast, by End-user Industry 2020 & 2033
- Table 36: Global Mobile Marketing Market Revenue billion Forecast, by Distribution Channel 2020 & 2033
- Table 37: Global Mobile Marketing Market Revenue billion Forecast, by Country 2020 & 2033
- Table 38: Global Mobile Marketing Market Revenue billion Forecast, by Type 2020 & 2033
- Table 39: Global Mobile Marketing Market Revenue billion Forecast, by End-user Industry 2020 & 2033
- Table 40: Global Mobile Marketing Market Revenue billion Forecast, by Distribution Channel 2020 & 2033
- Table 41: Global Mobile Marketing Market Revenue billion Forecast, by Country 2020 & 2033
- Table 42: Saudi Arabia Mobile Marketing Market Revenue (billion) Forecast, by Application 2020 & 2033
- Table 43: Rest of Middle East Mobile Marketing Market Revenue (billion) Forecast, by Application 2020 & 2033
Frequently Asked Questions
1. What is the projected Compound Annual Growth Rate (CAGR) of the Mobile Marketing Market?
The projected CAGR is approximately 23.9%.
2. Which companies are prominent players in the Mobile Marketing Market?
Key companies in the market include Twitter Inc, Pinterest, Appency, AT&T, AdColony Inc, Microsoft Corporation, InMobi, One by AOL (Millennial Media), Facebook Inc, GroundTruth, Mobio, Google Inc, OpenMarket, Phonevalley.
3. What are the main segments of the Mobile Marketing Market?
The market segments include Type, End-user Industry, Distribution Channel.
4. Can you provide details about the market size?
The market size is estimated to be USD 18.9 billion as of 2022.
5. What are some drivers contributing to market growth?
Rising Demand in the Online Retail Sector; Low Initial Investments with High Customer Involvement.
6. What are the notable trends driving market growth?
Rising Demand in the Online Retail Sector Drives the Market Growth.
7. Are there any restraints impacting market growth?
Increasing Security Vulnerability; Lack of Internet Connectivity in Rural Areas.
8. Can you provide examples of recent developments in the market?
October 2022 - Adverty AB (publ) announced a partnership with Apex Gaming Network, Apex Mobile Media's in-app mobile advertising division, and Canada's gaming network that places brands in premium game environments. The agreement allows the network to represent and sell Adverty's inventory in Canada, with the possibility of campaigns also running in the US. This collaboration will provide marketers in the region with seamless and immersive in-game advertising options.
9. What pricing options are available for accessing the report?
Pricing options include single-user, multi-user, and enterprise licenses priced at USD 4750, USD 5250, and USD 8750 respectively.
10. Is the market size provided in terms of value or volume?
The market size is provided in terms of value, measured in billion.
11. Are there any specific market keywords associated with the report?
Yes, the market keyword associated with the report is "Mobile Marketing Market," which aids in identifying and referencing the specific market segment covered.
12. How do I determine which pricing option suits my needs best?
The pricing options vary based on user requirements and access needs. Individual users may opt for single-user licenses, while businesses requiring broader access may choose multi-user or enterprise licenses for cost-effective access to the report.
13. Are there any additional resources or data provided in the Mobile Marketing Market report?
While the report offers comprehensive insights, it's advisable to review the specific contents or supplementary materials provided to ascertain if additional resources or data are available.
14. How can I stay updated on further developments or reports in the Mobile Marketing Market?
To stay informed about further developments, trends, and reports in the Mobile Marketing Market, consider subscribing to industry newsletters, following relevant companies and organizations, or regularly checking reputable industry news sources and publications.
Methodology
Step 1 - Identification of Relevant Samples Size from Population Database


Step 2 - Approaches for Defining Global Market Size (Value, Volume* & Price*)

Note*: In applicable scenarios
Step 3 - Data Sources
Primary Research
- Web Analytics
- Survey Reports
- Research Institute
- Latest Research Reports
- Opinion Leaders
Secondary Research
- Annual Reports
- White Paper
- Latest Press Release
- Industry Association
- Paid Database
- Investor Presentations

Step 4 - Data Triangulation
Involves using different sources of information in order to increase the validity of a study
These sources are likely to be stakeholders in a program - participants, other researchers, program staff, other community members, and so on.
Then we put all data in single framework & apply various statistical tools to find out the dynamic on the market.
During the analysis stage, feedback from the stakeholder groups would be compared to determine areas of agreement as well as areas of divergence