
Key Insights
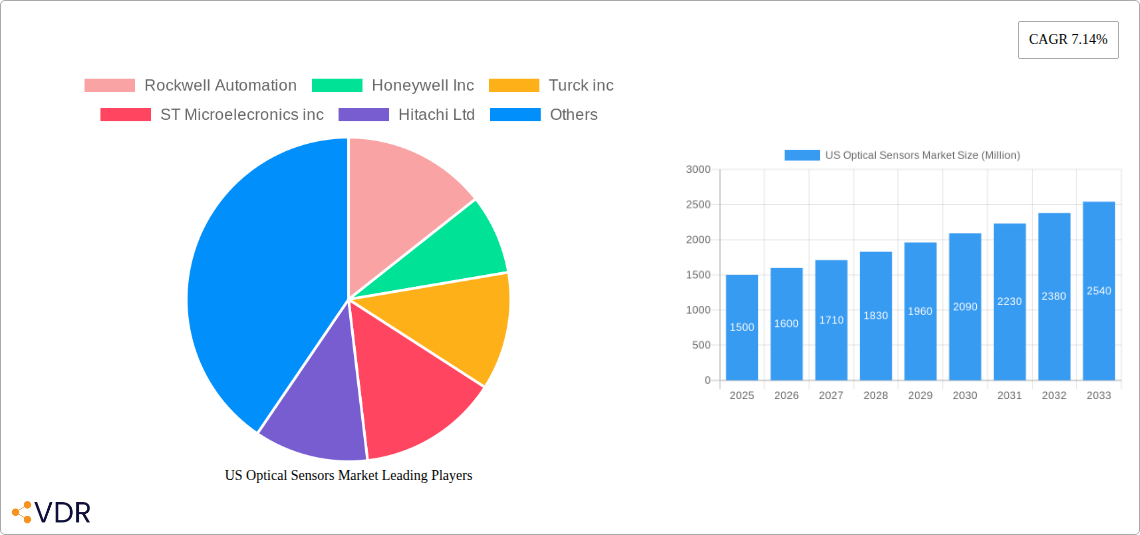
The US optical sensor market, exhibiting a robust Compound Annual Growth Rate (CAGR) of 7.14% from 2019 to 2024, is poised for continued expansion throughout the forecast period (2025-2033). Driven by increasing automation across diverse sectors like automotive, medical, and industrial applications, the demand for high-precision and advanced optical sensing technologies is surging. The integration of optical sensors into consumer electronics, particularly smartphones and wearable devices, further fuels market growth. Hyperspectral imaging, near-infrared spectroscopy, and optical coherence tomography are key technological drivers, enabling sophisticated applications in areas such as medical diagnostics and industrial process control. Fiber optic sensors, known for their durability and precision, and image sensors, catering to high-resolution imaging needs, dominate the sensor type segment. The market's growth is further fueled by advancements in extended InGaAs sensors for infrared applications, critical in sectors like aerospace and defense. While supply chain constraints and high initial investment costs could potentially restrain growth, the long-term prospects remain positive, with increasing government support for technological advancements and the development of miniaturized, cost-effective optical sensors.
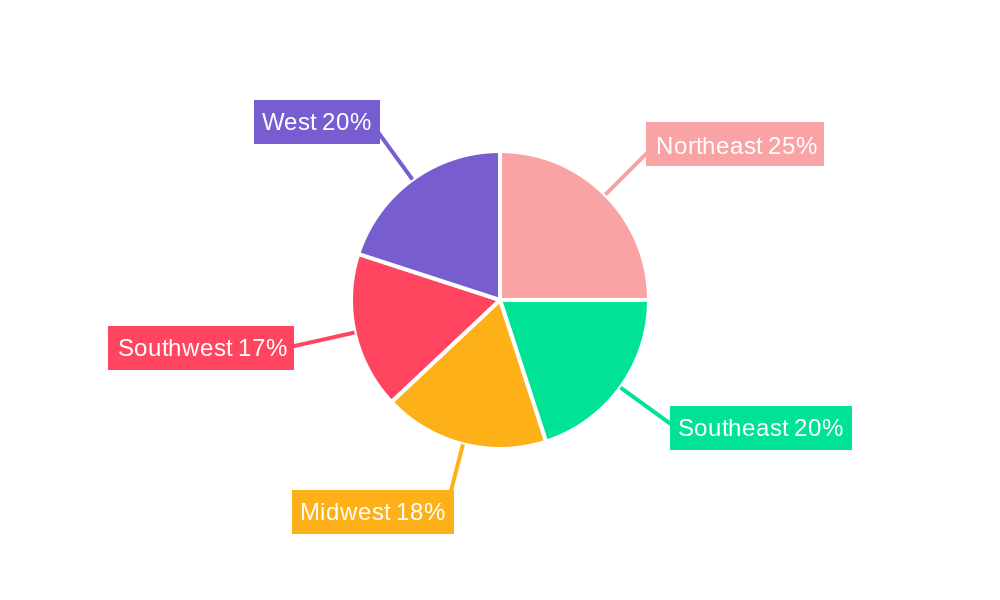
The significant market players—Rockwell Automation, Honeywell, and others—are strategically investing in research and development to enhance sensor performance and expand their application portfolio. The regional distribution of the market reveals strong growth across all US regions, with the Northeast and West potentially leading due to higher concentrations of technology hubs and manufacturing facilities. The diverse applications of optical sensors in commercial, medical, automotive, and industrial segments ensure a broad and stable market foundation. The medical segment is expected to witness significant growth due to the increased use of optical sensors in diagnostics and minimally invasive procedures. Meanwhile, the automotive sector's focus on autonomous driving and advanced driver-assistance systems (ADAS) is creating considerable demand for highly accurate optical sensing technologies. The sustained growth trajectory is likely to be influenced by continuous innovation, expanding applications, and favorable regulatory frameworks.
US Optical Sensors Market: A Comprehensive Market Report (2019-2033)
This comprehensive report provides an in-depth analysis of the US optical sensors market, encompassing market dynamics, growth trends, dominant segments, and key players. With a focus on the parent market of sensors and the child market of optical sensors, this report offers invaluable insights for industry professionals, investors, and strategists seeking to navigate this dynamic landscape. The study period covers 2019-2033, with 2025 as the base and estimated year. The forecast period spans 2025-2033, while the historical period covers 2019-2024. The market size is presented in million units.
US Optical Sensors Market Dynamics & Structure
The US optical sensor market is characterized by a moderately consolidated structure, with several major players holding significant market share. Market concentration is influenced by factors such as technological innovation, regulatory frameworks, and the presence of competitive product substitutes. The market is witnessing substantial technological advancements, particularly in hyperspectral imaging, near-IR spectroscopy, and quantum sensing, driving innovation and market expansion. Stringent regulatory frameworks governing safety and performance standards impact market dynamics, especially in sectors like automotive and medical. The presence of alternative sensing technologies, such as ultrasonic and radar sensors, presents competitive pressure. End-user demographics significantly influence market demand, with the automotive, industrial, and medical sectors being major drivers. M&A activity in the industry has been moderate, primarily focused on strategic acquisitions to enhance technological capabilities and expand market reach.
- Market Concentration: Moderately consolidated, with top 10 players holding xx% market share in 2025.
- Technological Innovation: Rapid advancements in hyperspectral imaging and quantum sensing are major drivers.
- Regulatory Framework: Stringent safety and performance standards, particularly in automotive and medical applications.
- Competitive Substitutes: Ultrasonic and radar sensors pose competitive pressure.
- End-User Demographics: Automotive, industrial, and medical sectors are key drivers.
- M&A Activity: Moderate activity, focused on technology enhancement and market expansion; xx M&A deals recorded between 2019-2024.
US Optical Sensors Market Growth Trends & Insights
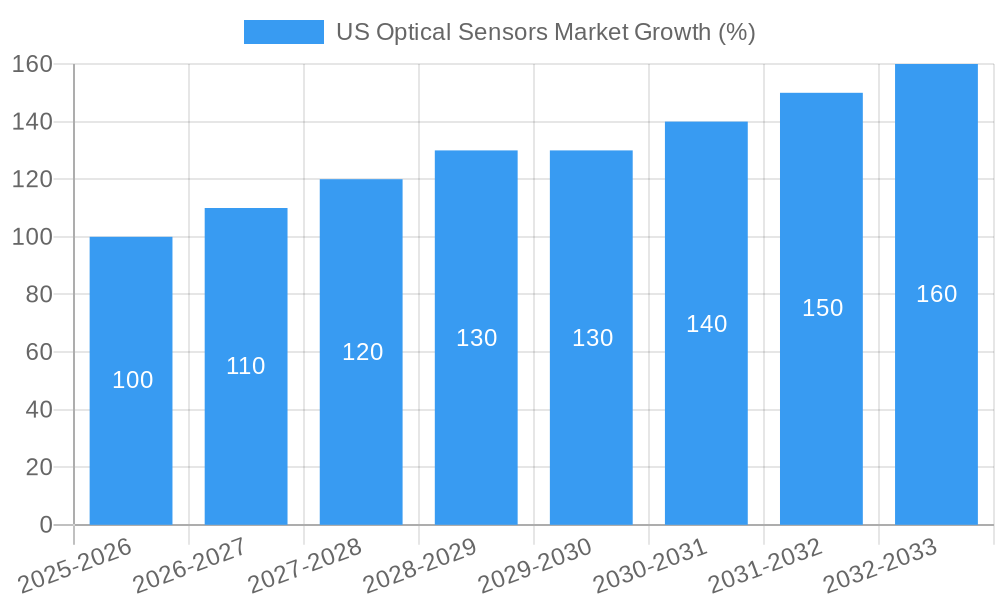
The US optical sensor market experienced robust growth during the historical period (2019-2024), driven by increasing demand across various applications. The market size reached xx million units in 2024 and is projected to reach xx million units by 2033, exhibiting a CAGR of xx% during the forecast period (2025-2033). This growth is fueled by technological advancements, rising adoption rates in diverse sectors (e.g., increased automation in industrial settings, advanced driver-assistance systems in automobiles, and minimally invasive procedures in medicine), and evolving consumer preferences. Disruptive technologies such as quantum sensors are poised to reshape the market landscape, creating opportunities for new applications and enhancing existing ones. Consumer behavior shifts, particularly towards increased automation and digitalization, are further bolstering market growth. Market penetration continues to increase, especially in the emerging applications of augmented reality and smart home technologies.
Dominant Regions, Countries, or Segments in US Optical Sensors Market
The industrial sector within the US is currently the dominant segment in the optical sensor market, driven by high adoption rates in manufacturing automation. The automotive and medical sectors are also exhibiting significant growth potential. Geographically, the Northeast and West Coast regions of the US are leading due to robust manufacturing activity and technological innovation hubs. California is a key state, especially due to the concentration of companies in Silicon Valley.
- Dominant Segment: Industrial (xx% market share in 2025)
- High-Growth Segments: Automotive and Medical
- Leading Regions: Northeast and West Coast (California being prominent)
- Key Drivers: Automation, technological advancements, government investments in infrastructure and R&D.
Technology Segment Analysis:
- Hyperspectral Imaging: High growth potential due to increasing applications in precision agriculture and medical diagnostics.
- Near-IR Spectroscopy: Steady growth driven by industrial process monitoring and quality control applications.
- Photo-Acoustic Tomography: Emerging segment with potential applications in medical imaging.
- Optical Coherence Tomography: Strong growth in medical imaging and industrial inspection.
Sensor Type Segment Analysis:
- Fiber Optic Sensors: High demand in industrial applications due to their robustness and accuracy.
- Image Sensors: Rapid growth in automotive, consumer electronics, and medical imaging.
- Position Sensors: Steady growth in industrial automation and robotics.
- Ambient Light and Proximity Sensors: High volume demand in consumer electronics.
- Extended InGaAs Sensors (Infrared Sensors): Growing demand due to applications in night vision and thermal imaging.
US Optical Sensors Market Product Landscape
The US optical sensor market showcases a diverse product landscape, featuring advancements in miniaturization, enhanced sensitivity, and wider spectral ranges. Innovations include high-resolution image sensors for advanced driver-assistance systems, compact fiber optic sensors for challenging industrial environments, and specialized sensors for emerging applications such as LiDAR and quantum sensing. These products offer unique selling propositions such as increased accuracy, improved reliability, and reduced power consumption. Technological advancements continue to drive the development of more sophisticated and specialized optical sensors tailored to specific application needs.
Key Drivers, Barriers & Challenges in US Optical Sensors Market
Key Drivers:
- Increasing automation across diverse industries
- Growing demand for advanced driver-assistance systems (ADAS)
- Advancements in medical imaging and diagnostics
- Rising adoption of smart home and IoT technologies.
Challenges and Restraints:
- High initial investment costs for advanced technologies.
- Supply chain disruptions affecting component availability.
- Stringent regulatory standards and compliance requirements.
- Intense competition from established players and new entrants. This leads to pressure on pricing and margins.
Emerging Opportunities in US Optical Sensors Market
- Expansion into untapped markets, such as agricultural technology (precision farming) and environmental monitoring.
- Development of innovative applications, particularly in augmented and virtual reality.
- Integration of optical sensors with other technologies, such as AI and machine learning, to enhance data processing and analysis.
- Focus on energy-efficient and cost-effective optical sensor designs.
Growth Accelerators in the US Optical Sensors Market Industry
The long-term growth of the US optical sensors market will be propelled by continuous technological innovation, particularly in the areas of quantum sensing and hyperspectral imaging. Strategic partnerships between sensor manufacturers and technology companies will facilitate the development of new applications and expand market reach. Government initiatives promoting automation and digitalization in various industries, especially those focused on infrastructure improvements and smart cities, are also set to boost the sector’s growth.
Key Players Shaping the US Optical Sensors Market Market
- Rockwell Automation
- Honeywell Inc
- Turck inc
- ST Microelecronics inc
- Hitachi Ltd
- Omnivision Inc
- Sick AG
- Mouser Electronics Inc
- Robert Bosch GmbH
- Atmel Corporation
- Eaton Corporation
Notable Milestones in US Optical Sensors Market Sector
- June 2021: Mouser Electronics announced a distribution agreement with Marktech Optoelectronics, expanding the availability of emitters and photodiodes for various applications, boosting market reach for both companies.
- November 2020: Trumpf and Sick partnered to develop the first industrial quantum sensor, signifying a major technological advancement with potential for new applications and market disruption.
In-Depth US Optical Sensors Market Outlook
The future of the US optical sensors market appears exceptionally promising, driven by several factors including continued technological innovation, substantial investments in automation and digitization across industries, and the emergence of novel applications in fields such as augmented reality, autonomous vehicles, and precision agriculture. Strategic partnerships and mergers and acquisitions are expected to fuel market expansion and accelerate innovation. Companies adopting aggressive R&D strategies and those focusing on creating efficient, cost-effective, and high-performance sensors will be best positioned to benefit from the considerable opportunities presented by this dynamic market. The continued penetration of optical sensors across diverse applications is poised to drive strong and consistent growth throughout the forecast period.
US Optical Sensors Market Segmentation
-
1. Technology
- 1.1. Hyperspectral imaging
- 1.2. Near IR Spectroscopy
- 1.3. Photo-Acoustic Tomography
- 1.4. Optical Coherence Tomography
-
2. Sensor Type
- 2.1. Fiber Optic Sensors
- 2.2. Image Sensors
- 2.3. Position Sensors
-
2.4. Ambient light and proximity sensors
- 2.4.1. Cadmium Sulfide
- 2.4.2. Silicon
- 2.4.3. InGaAs Sensors
- 2.4.4. Extended InGaAs Sensors
- 2.5. Infrared Sensors
- 2.6. Other Sensors
-
3. Applications
- 3.1. Commercial
- 3.2. Consumer Electronics
- 3.3. Medical
- 3.4. Automotive
- 3.5. Industrial
- 3.6. Aerospace & Defence
-
3.7. Optocouplers
- 3.7.1. 4-pin Optocouplers
- 3.7.2. 6-pin Optocouplers
- 3.7.3. High speed optocouplers
- 3.7.4. IGBT gate driver optocouplers
- 3.7.5. Isolation Amplifier Optocouplers
- 3.8. Others
US Optical Sensors Market Segmentation By Geography
-
1. North America
- 1.1. United States
- 1.2. Canada
- 1.3. Mexico
-
2. South America
- 2.1. Brazil
- 2.2. Argentina
- 2.3. Rest of South America
-
3. Europe
- 3.1. United Kingdom
- 3.2. Germany
- 3.3. France
- 3.4. Italy
- 3.5. Spain
- 3.6. Russia
- 3.7. Benelux
- 3.8. Nordics
- 3.9. Rest of Europe
-
4. Middle East & Africa
- 4.1. Turkey
- 4.2. Israel
- 4.3. GCC
- 4.4. North Africa
- 4.5. South Africa
- 4.6. Rest of Middle East & Africa
-
5. Asia Pacific
- 5.1. China
- 5.2. India
- 5.3. Japan
- 5.4. South Korea
- 5.5. ASEAN
- 5.6. Oceania
- 5.7. Rest of Asia Pacific
US Optical Sensors Market REPORT HIGHLIGHTS
| Aspects | Details |
|---|---|
| Study Period | 2019-2033 |
| Base Year | 2024 |
| Estimated Year | 2025 |
| Forecast Period | 2025-2033 |
| Historical Period | 2019-2024 |
| Growth Rate | CAGR of 7.14% from 2019-2033 |
| Segmentation |
|
Table of Contents
- 1. Introduction
- 1.1. Research Scope
- 1.2. Market Segmentation
- 1.3. Research Methodology
- 1.4. Definitions and Assumptions
- 2. Executive Summary
- 2.1. Introduction
- 3. Market Dynamics
- 3.1. Introduction
- 3.2. Market Drivers
- 3.2.1. Increasing Market Penetration of Smartphones; Increasing Demand for Power-saving Devices Across Industries; Increasing Market Penetration of Automation Techniques Across Various Industries
- 3.3. Market Restrains
- 3.3.1. Imbalance Between the Image Quality and Price
- 3.4. Market Trends
- 3.4.1. Photoelectric Sensor is Expected to Register a Significant Growth
- 4. Market Factor Analysis
- 4.1. Porters Five Forces
- 4.2. Supply/Value Chain
- 4.3. PESTEL analysis
- 4.4. Market Entropy
- 4.5. Patent/Trademark Analysis
- 5. Global US Optical Sensors Market Analysis, Insights and Forecast, 2019-2031
- 5.1. Market Analysis, Insights and Forecast - by Technology
- 5.1.1. Hyperspectral imaging
- 5.1.2. Near IR Spectroscopy
- 5.1.3. Photo-Acoustic Tomography
- 5.1.4. Optical Coherence Tomography
- 5.2. Market Analysis, Insights and Forecast - by Sensor Type
- 5.2.1. Fiber Optic Sensors
- 5.2.2. Image Sensors
- 5.2.3. Position Sensors
- 5.2.4. Ambient light and proximity sensors
- 5.2.4.1. Cadmium Sulfide
- 5.2.4.2. Silicon
- 5.2.4.3. InGaAs Sensors
- 5.2.4.4. Extended InGaAs Sensors
- 5.2.5. Infrared Sensors
- 5.2.6. Other Sensors
- 5.3. Market Analysis, Insights and Forecast - by Applications
- 5.3.1. Commercial
- 5.3.2. Consumer Electronics
- 5.3.3. Medical
- 5.3.4. Automotive
- 5.3.5. Industrial
- 5.3.6. Aerospace & Defence
- 5.3.7. Optocouplers
- 5.3.7.1. 4-pin Optocouplers
- 5.3.7.2. 6-pin Optocouplers
- 5.3.7.3. High speed optocouplers
- 5.3.7.4. IGBT gate driver optocouplers
- 5.3.7.5. Isolation Amplifier Optocouplers
- 5.3.8. Others
- 5.4. Market Analysis, Insights and Forecast - by Region
- 5.4.1. North America
- 5.4.2. South America
- 5.4.3. Europe
- 5.4.4. Middle East & Africa
- 5.4.5. Asia Pacific
- 5.1. Market Analysis, Insights and Forecast - by Technology
- 6. North America US Optical Sensors Market Analysis, Insights and Forecast, 2019-2031
- 6.1. Market Analysis, Insights and Forecast - by Technology
- 6.1.1. Hyperspectral imaging
- 6.1.2. Near IR Spectroscopy
- 6.1.3. Photo-Acoustic Tomography
- 6.1.4. Optical Coherence Tomography
- 6.2. Market Analysis, Insights and Forecast - by Sensor Type
- 6.2.1. Fiber Optic Sensors
- 6.2.2. Image Sensors
- 6.2.3. Position Sensors
- 6.2.4. Ambient light and proximity sensors
- 6.2.4.1. Cadmium Sulfide
- 6.2.4.2. Silicon
- 6.2.4.3. InGaAs Sensors
- 6.2.4.4. Extended InGaAs Sensors
- 6.2.5. Infrared Sensors
- 6.2.6. Other Sensors
- 6.3. Market Analysis, Insights and Forecast - by Applications
- 6.3.1. Commercial
- 6.3.2. Consumer Electronics
- 6.3.3. Medical
- 6.3.4. Automotive
- 6.3.5. Industrial
- 6.3.6. Aerospace & Defence
- 6.3.7. Optocouplers
- 6.3.7.1. 4-pin Optocouplers
- 6.3.7.2. 6-pin Optocouplers
- 6.3.7.3. High speed optocouplers
- 6.3.7.4. IGBT gate driver optocouplers
- 6.3.7.5. Isolation Amplifier Optocouplers
- 6.3.8. Others
- 6.1. Market Analysis, Insights and Forecast - by Technology
- 7. South America US Optical Sensors Market Analysis, Insights and Forecast, 2019-2031
- 7.1. Market Analysis, Insights and Forecast - by Technology
- 7.1.1. Hyperspectral imaging
- 7.1.2. Near IR Spectroscopy
- 7.1.3. Photo-Acoustic Tomography
- 7.1.4. Optical Coherence Tomography
- 7.2. Market Analysis, Insights and Forecast - by Sensor Type
- 7.2.1. Fiber Optic Sensors
- 7.2.2. Image Sensors
- 7.2.3. Position Sensors
- 7.2.4. Ambient light and proximity sensors
- 7.2.4.1. Cadmium Sulfide
- 7.2.4.2. Silicon
- 7.2.4.3. InGaAs Sensors
- 7.2.4.4. Extended InGaAs Sensors
- 7.2.5. Infrared Sensors
- 7.2.6. Other Sensors
- 7.3. Market Analysis, Insights and Forecast - by Applications
- 7.3.1. Commercial
- 7.3.2. Consumer Electronics
- 7.3.3. Medical
- 7.3.4. Automotive
- 7.3.5. Industrial
- 7.3.6. Aerospace & Defence
- 7.3.7. Optocouplers
- 7.3.7.1. 4-pin Optocouplers
- 7.3.7.2. 6-pin Optocouplers
- 7.3.7.3. High speed optocouplers
- 7.3.7.4. IGBT gate driver optocouplers
- 7.3.7.5. Isolation Amplifier Optocouplers
- 7.3.8. Others
- 7.1. Market Analysis, Insights and Forecast - by Technology
- 8. Europe US Optical Sensors Market Analysis, Insights and Forecast, 2019-2031
- 8.1. Market Analysis, Insights and Forecast - by Technology
- 8.1.1. Hyperspectral imaging
- 8.1.2. Near IR Spectroscopy
- 8.1.3. Photo-Acoustic Tomography
- 8.1.4. Optical Coherence Tomography
- 8.2. Market Analysis, Insights and Forecast - by Sensor Type
- 8.2.1. Fiber Optic Sensors
- 8.2.2. Image Sensors
- 8.2.3. Position Sensors
- 8.2.4. Ambient light and proximity sensors
- 8.2.4.1. Cadmium Sulfide
- 8.2.4.2. Silicon
- 8.2.4.3. InGaAs Sensors
- 8.2.4.4. Extended InGaAs Sensors
- 8.2.5. Infrared Sensors
- 8.2.6. Other Sensors
- 8.3. Market Analysis, Insights and Forecast - by Applications
- 8.3.1. Commercial
- 8.3.2. Consumer Electronics
- 8.3.3. Medical
- 8.3.4. Automotive
- 8.3.5. Industrial
- 8.3.6. Aerospace & Defence
- 8.3.7. Optocouplers
- 8.3.7.1. 4-pin Optocouplers
- 8.3.7.2. 6-pin Optocouplers
- 8.3.7.3. High speed optocouplers
- 8.3.7.4. IGBT gate driver optocouplers
- 8.3.7.5. Isolation Amplifier Optocouplers
- 8.3.8. Others
- 8.1. Market Analysis, Insights and Forecast - by Technology
- 9. Middle East & Africa US Optical Sensors Market Analysis, Insights and Forecast, 2019-2031
- 9.1. Market Analysis, Insights and Forecast - by Technology
- 9.1.1. Hyperspectral imaging
- 9.1.2. Near IR Spectroscopy
- 9.1.3. Photo-Acoustic Tomography
- 9.1.4. Optical Coherence Tomography
- 9.2. Market Analysis, Insights and Forecast - by Sensor Type
- 9.2.1. Fiber Optic Sensors
- 9.2.2. Image Sensors
- 9.2.3. Position Sensors
- 9.2.4. Ambient light and proximity sensors
- 9.2.4.1. Cadmium Sulfide
- 9.2.4.2. Silicon
- 9.2.4.3. InGaAs Sensors
- 9.2.4.4. Extended InGaAs Sensors
- 9.2.5. Infrared Sensors
- 9.2.6. Other Sensors
- 9.3. Market Analysis, Insights and Forecast - by Applications
- 9.3.1. Commercial
- 9.3.2. Consumer Electronics
- 9.3.3. Medical
- 9.3.4. Automotive
- 9.3.5. Industrial
- 9.3.6. Aerospace & Defence
- 9.3.7. Optocouplers
- 9.3.7.1. 4-pin Optocouplers
- 9.3.7.2. 6-pin Optocouplers
- 9.3.7.3. High speed optocouplers
- 9.3.7.4. IGBT gate driver optocouplers
- 9.3.7.5. Isolation Amplifier Optocouplers
- 9.3.8. Others
- 9.1. Market Analysis, Insights and Forecast - by Technology
- 10. Asia Pacific US Optical Sensors Market Analysis, Insights and Forecast, 2019-2031
- 10.1. Market Analysis, Insights and Forecast - by Technology
- 10.1.1. Hyperspectral imaging
- 10.1.2. Near IR Spectroscopy
- 10.1.3. Photo-Acoustic Tomography
- 10.1.4. Optical Coherence Tomography
- 10.2. Market Analysis, Insights and Forecast - by Sensor Type
- 10.2.1. Fiber Optic Sensors
- 10.2.2. Image Sensors
- 10.2.3. Position Sensors
- 10.2.4. Ambient light and proximity sensors
- 10.2.4.1. Cadmium Sulfide
- 10.2.4.2. Silicon
- 10.2.4.3. InGaAs Sensors
- 10.2.4.4. Extended InGaAs Sensors
- 10.2.5. Infrared Sensors
- 10.2.6. Other Sensors
- 10.3. Market Analysis, Insights and Forecast - by Applications
- 10.3.1. Commercial
- 10.3.2. Consumer Electronics
- 10.3.3. Medical
- 10.3.4. Automotive
- 10.3.5. Industrial
- 10.3.6. Aerospace & Defence
- 10.3.7. Optocouplers
- 10.3.7.1. 4-pin Optocouplers
- 10.3.7.2. 6-pin Optocouplers
- 10.3.7.3. High speed optocouplers
- 10.3.7.4. IGBT gate driver optocouplers
- 10.3.7.5. Isolation Amplifier Optocouplers
- 10.3.8. Others
- 10.1. Market Analysis, Insights and Forecast - by Technology
- 11. Northeast US Optical Sensors Market Analysis, Insights and Forecast, 2019-2031
- 12. Southeast US Optical Sensors Market Analysis, Insights and Forecast, 2019-2031
- 13. Midwest US Optical Sensors Market Analysis, Insights and Forecast, 2019-2031
- 14. Southwest US Optical Sensors Market Analysis, Insights and Forecast, 2019-2031
- 15. West US Optical Sensors Market Analysis, Insights and Forecast, 2019-2031
- 16. Competitive Analysis
- 16.1. Global Market Share Analysis 2024
- 16.2. Company Profiles
- 16.2.1 Rockwell Automation
- 16.2.1.1. Overview
- 16.2.1.2. Products
- 16.2.1.3. SWOT Analysis
- 16.2.1.4. Recent Developments
- 16.2.1.5. Financials (Based on Availability)
- 16.2.2 Honeywell Inc
- 16.2.2.1. Overview
- 16.2.2.2. Products
- 16.2.2.3. SWOT Analysis
- 16.2.2.4. Recent Developments
- 16.2.2.5. Financials (Based on Availability)
- 16.2.3 Turck inc
- 16.2.3.1. Overview
- 16.2.3.2. Products
- 16.2.3.3. SWOT Analysis
- 16.2.3.4. Recent Developments
- 16.2.3.5. Financials (Based on Availability)
- 16.2.4 ST Microelecronics inc
- 16.2.4.1. Overview
- 16.2.4.2. Products
- 16.2.4.3. SWOT Analysis
- 16.2.4.4. Recent Developments
- 16.2.4.5. Financials (Based on Availability)
- 16.2.5 Hitachi Ltd
- 16.2.5.1. Overview
- 16.2.5.2. Products
- 16.2.5.3. SWOT Analysis
- 16.2.5.4. Recent Developments
- 16.2.5.5. Financials (Based on Availability)
- 16.2.6 Omnivision Inc
- 16.2.6.1. Overview
- 16.2.6.2. Products
- 16.2.6.3. SWOT Analysis
- 16.2.6.4. Recent Developments
- 16.2.6.5. Financials (Based on Availability)
- 16.2.7 Sick AG
- 16.2.7.1. Overview
- 16.2.7.2. Products
- 16.2.7.3. SWOT Analysis
- 16.2.7.4. Recent Developments
- 16.2.7.5. Financials (Based on Availability)
- 16.2.8 Mouser Electronics Inc
- 16.2.8.1. Overview
- 16.2.8.2. Products
- 16.2.8.3. SWOT Analysis
- 16.2.8.4. Recent Developments
- 16.2.8.5. Financials (Based on Availability)
- 16.2.9 Robert Bosch GmbH
- 16.2.9.1. Overview
- 16.2.9.2. Products
- 16.2.9.3. SWOT Analysis
- 16.2.9.4. Recent Developments
- 16.2.9.5. Financials (Based on Availability)
- 16.2.10 Atmel Corporation
- 16.2.10.1. Overview
- 16.2.10.2. Products
- 16.2.10.3. SWOT Analysis
- 16.2.10.4. Recent Developments
- 16.2.10.5. Financials (Based on Availability)
- 16.2.11 Eaton Corporation
- 16.2.11.1. Overview
- 16.2.11.2. Products
- 16.2.11.3. SWOT Analysis
- 16.2.11.4. Recent Developments
- 16.2.11.5. Financials (Based on Availability)
- 16.2.1 Rockwell Automation
List of Figures
- Figure 1: Global US Optical Sensors Market Revenue Breakdown (Million, %) by Region 2024 & 2032
- Figure 2: United states US Optical Sensors Market Revenue (Million), by Country 2024 & 2032
- Figure 3: United states US Optical Sensors Market Revenue Share (%), by Country 2024 & 2032
- Figure 4: North America US Optical Sensors Market Revenue (Million), by Technology 2024 & 2032
- Figure 5: North America US Optical Sensors Market Revenue Share (%), by Technology 2024 & 2032
- Figure 6: North America US Optical Sensors Market Revenue (Million), by Sensor Type 2024 & 2032
- Figure 7: North America US Optical Sensors Market Revenue Share (%), by Sensor Type 2024 & 2032
- Figure 8: North America US Optical Sensors Market Revenue (Million), by Applications 2024 & 2032
- Figure 9: North America US Optical Sensors Market Revenue Share (%), by Applications 2024 & 2032
- Figure 10: North America US Optical Sensors Market Revenue (Million), by Country 2024 & 2032
- Figure 11: North America US Optical Sensors Market Revenue Share (%), by Country 2024 & 2032
- Figure 12: South America US Optical Sensors Market Revenue (Million), by Technology 2024 & 2032
- Figure 13: South America US Optical Sensors Market Revenue Share (%), by Technology 2024 & 2032
- Figure 14: South America US Optical Sensors Market Revenue (Million), by Sensor Type 2024 & 2032
- Figure 15: South America US Optical Sensors Market Revenue Share (%), by Sensor Type 2024 & 2032
- Figure 16: South America US Optical Sensors Market Revenue (Million), by Applications 2024 & 2032
- Figure 17: South America US Optical Sensors Market Revenue Share (%), by Applications 2024 & 2032
- Figure 18: South America US Optical Sensors Market Revenue (Million), by Country 2024 & 2032
- Figure 19: South America US Optical Sensors Market Revenue Share (%), by Country 2024 & 2032
- Figure 20: Europe US Optical Sensors Market Revenue (Million), by Technology 2024 & 2032
- Figure 21: Europe US Optical Sensors Market Revenue Share (%), by Technology 2024 & 2032
- Figure 22: Europe US Optical Sensors Market Revenue (Million), by Sensor Type 2024 & 2032
- Figure 23: Europe US Optical Sensors Market Revenue Share (%), by Sensor Type 2024 & 2032
- Figure 24: Europe US Optical Sensors Market Revenue (Million), by Applications 2024 & 2032
- Figure 25: Europe US Optical Sensors Market Revenue Share (%), by Applications 2024 & 2032
- Figure 26: Europe US Optical Sensors Market Revenue (Million), by Country 2024 & 2032
- Figure 27: Europe US Optical Sensors Market Revenue Share (%), by Country 2024 & 2032
- Figure 28: Middle East & Africa US Optical Sensors Market Revenue (Million), by Technology 2024 & 2032
- Figure 29: Middle East & Africa US Optical Sensors Market Revenue Share (%), by Technology 2024 & 2032
- Figure 30: Middle East & Africa US Optical Sensors Market Revenue (Million), by Sensor Type 2024 & 2032
- Figure 31: Middle East & Africa US Optical Sensors Market Revenue Share (%), by Sensor Type 2024 & 2032
- Figure 32: Middle East & Africa US Optical Sensors Market Revenue (Million), by Applications 2024 & 2032
- Figure 33: Middle East & Africa US Optical Sensors Market Revenue Share (%), by Applications 2024 & 2032
- Figure 34: Middle East & Africa US Optical Sensors Market Revenue (Million), by Country 2024 & 2032
- Figure 35: Middle East & Africa US Optical Sensors Market Revenue Share (%), by Country 2024 & 2032
- Figure 36: Asia Pacific US Optical Sensors Market Revenue (Million), by Technology 2024 & 2032
- Figure 37: Asia Pacific US Optical Sensors Market Revenue Share (%), by Technology 2024 & 2032
- Figure 38: Asia Pacific US Optical Sensors Market Revenue (Million), by Sensor Type 2024 & 2032
- Figure 39: Asia Pacific US Optical Sensors Market Revenue Share (%), by Sensor Type 2024 & 2032
- Figure 40: Asia Pacific US Optical Sensors Market Revenue (Million), by Applications 2024 & 2032
- Figure 41: Asia Pacific US Optical Sensors Market Revenue Share (%), by Applications 2024 & 2032
- Figure 42: Asia Pacific US Optical Sensors Market Revenue (Million), by Country 2024 & 2032
- Figure 43: Asia Pacific US Optical Sensors Market Revenue Share (%), by Country 2024 & 2032
List of Tables
- Table 1: Global US Optical Sensors Market Revenue Million Forecast, by Region 2019 & 2032
- Table 2: Global US Optical Sensors Market Revenue Million Forecast, by Technology 2019 & 2032
- Table 3: Global US Optical Sensors Market Revenue Million Forecast, by Sensor Type 2019 & 2032
- Table 4: Global US Optical Sensors Market Revenue Million Forecast, by Applications 2019 & 2032
- Table 5: Global US Optical Sensors Market Revenue Million Forecast, by Region 2019 & 2032
- Table 6: Global US Optical Sensors Market Revenue Million Forecast, by Country 2019 & 2032
- Table 7: Northeast US Optical Sensors Market Revenue (Million) Forecast, by Application 2019 & 2032
- Table 8: Southeast US Optical Sensors Market Revenue (Million) Forecast, by Application 2019 & 2032
- Table 9: Midwest US Optical Sensors Market Revenue (Million) Forecast, by Application 2019 & 2032
- Table 10: Southwest US Optical Sensors Market Revenue (Million) Forecast, by Application 2019 & 2032
- Table 11: West US Optical Sensors Market Revenue (Million) Forecast, by Application 2019 & 2032
- Table 12: Global US Optical Sensors Market Revenue Million Forecast, by Technology 2019 & 2032
- Table 13: Global US Optical Sensors Market Revenue Million Forecast, by Sensor Type 2019 & 2032
- Table 14: Global US Optical Sensors Market Revenue Million Forecast, by Applications 2019 & 2032
- Table 15: Global US Optical Sensors Market Revenue Million Forecast, by Country 2019 & 2032
- Table 16: United States US Optical Sensors Market Revenue (Million) Forecast, by Application 2019 & 2032
- Table 17: Canada US Optical Sensors Market Revenue (Million) Forecast, by Application 2019 & 2032
- Table 18: Mexico US Optical Sensors Market Revenue (Million) Forecast, by Application 2019 & 2032
- Table 19: Global US Optical Sensors Market Revenue Million Forecast, by Technology 2019 & 2032
- Table 20: Global US Optical Sensors Market Revenue Million Forecast, by Sensor Type 2019 & 2032
- Table 21: Global US Optical Sensors Market Revenue Million Forecast, by Applications 2019 & 2032
- Table 22: Global US Optical Sensors Market Revenue Million Forecast, by Country 2019 & 2032
- Table 23: Brazil US Optical Sensors Market Revenue (Million) Forecast, by Application 2019 & 2032
- Table 24: Argentina US Optical Sensors Market Revenue (Million) Forecast, by Application 2019 & 2032
- Table 25: Rest of South America US Optical Sensors Market Revenue (Million) Forecast, by Application 2019 & 2032
- Table 26: Global US Optical Sensors Market Revenue Million Forecast, by Technology 2019 & 2032
- Table 27: Global US Optical Sensors Market Revenue Million Forecast, by Sensor Type 2019 & 2032
- Table 28: Global US Optical Sensors Market Revenue Million Forecast, by Applications 2019 & 2032
- Table 29: Global US Optical Sensors Market Revenue Million Forecast, by Country 2019 & 2032
- Table 30: United Kingdom US Optical Sensors Market Revenue (Million) Forecast, by Application 2019 & 2032
- Table 31: Germany US Optical Sensors Market Revenue (Million) Forecast, by Application 2019 & 2032
- Table 32: France US Optical Sensors Market Revenue (Million) Forecast, by Application 2019 & 2032
- Table 33: Italy US Optical Sensors Market Revenue (Million) Forecast, by Application 2019 & 2032
- Table 34: Spain US Optical Sensors Market Revenue (Million) Forecast, by Application 2019 & 2032
- Table 35: Russia US Optical Sensors Market Revenue (Million) Forecast, by Application 2019 & 2032
- Table 36: Benelux US Optical Sensors Market Revenue (Million) Forecast, by Application 2019 & 2032
- Table 37: Nordics US Optical Sensors Market Revenue (Million) Forecast, by Application 2019 & 2032
- Table 38: Rest of Europe US Optical Sensors Market Revenue (Million) Forecast, by Application 2019 & 2032
- Table 39: Global US Optical Sensors Market Revenue Million Forecast, by Technology 2019 & 2032
- Table 40: Global US Optical Sensors Market Revenue Million Forecast, by Sensor Type 2019 & 2032
- Table 41: Global US Optical Sensors Market Revenue Million Forecast, by Applications 2019 & 2032
- Table 42: Global US Optical Sensors Market Revenue Million Forecast, by Country 2019 & 2032
- Table 43: Turkey US Optical Sensors Market Revenue (Million) Forecast, by Application 2019 & 2032
- Table 44: Israel US Optical Sensors Market Revenue (Million) Forecast, by Application 2019 & 2032
- Table 45: GCC US Optical Sensors Market Revenue (Million) Forecast, by Application 2019 & 2032
- Table 46: North Africa US Optical Sensors Market Revenue (Million) Forecast, by Application 2019 & 2032
- Table 47: South Africa US Optical Sensors Market Revenue (Million) Forecast, by Application 2019 & 2032
- Table 48: Rest of Middle East & Africa US Optical Sensors Market Revenue (Million) Forecast, by Application 2019 & 2032
- Table 49: Global US Optical Sensors Market Revenue Million Forecast, by Technology 2019 & 2032
- Table 50: Global US Optical Sensors Market Revenue Million Forecast, by Sensor Type 2019 & 2032
- Table 51: Global US Optical Sensors Market Revenue Million Forecast, by Applications 2019 & 2032
- Table 52: Global US Optical Sensors Market Revenue Million Forecast, by Country 2019 & 2032
- Table 53: China US Optical Sensors Market Revenue (Million) Forecast, by Application 2019 & 2032
- Table 54: India US Optical Sensors Market Revenue (Million) Forecast, by Application 2019 & 2032
- Table 55: Japan US Optical Sensors Market Revenue (Million) Forecast, by Application 2019 & 2032
- Table 56: South Korea US Optical Sensors Market Revenue (Million) Forecast, by Application 2019 & 2032
- Table 57: ASEAN US Optical Sensors Market Revenue (Million) Forecast, by Application 2019 & 2032
- Table 58: Oceania US Optical Sensors Market Revenue (Million) Forecast, by Application 2019 & 2032
- Table 59: Rest of Asia Pacific US Optical Sensors Market Revenue (Million) Forecast, by Application 2019 & 2032
Frequently Asked Questions
1. What is the projected Compound Annual Growth Rate (CAGR) of the US Optical Sensors Market?
The projected CAGR is approximately 7.14%.
2. Which companies are prominent players in the US Optical Sensors Market?
Key companies in the market include Rockwell Automation, Honeywell Inc, Turck inc, ST Microelecronics inc, Hitachi Ltd, Omnivision Inc, Sick AG, Mouser Electronics Inc, Robert Bosch GmbH, Atmel Corporation, Eaton Corporation.
3. What are the main segments of the US Optical Sensors Market?
The market segments include Technology, Sensor Type, Applications.
4. Can you provide details about the market size?
The market size is estimated to be USD XX Million as of 2022.
5. What are some drivers contributing to market growth?
Increasing Market Penetration of Smartphones; Increasing Demand for Power-saving Devices Across Industries; Increasing Market Penetration of Automation Techniques Across Various Industries.
6. What are the notable trends driving market growth?
Photoelectric Sensor is Expected to Register a Significant Growth.
7. Are there any restraints impacting market growth?
Imbalance Between the Image Quality and Price.
8. Can you provide examples of recent developments in the market?
June 2021: Mouser Electronics announced a distribution agreement with Marktech Optoelectronics to offer customers Marktech Optoelectronics' range of emitters and photodiodes for applications, including night vision, safety equipment, fiber optics, and currency validation. The near-IR emitters offer exceptional optical/mechanical axis alignment, making them a suitable choice for high-precision applications, including bar code readers, fiber optics, and optical switches, and optical sensors.
9. What pricing options are available for accessing the report?
Pricing options include single-user, multi-user, and enterprise licenses priced at USD 3800, USD 4500, and USD 5800 respectively.
10. Is the market size provided in terms of value or volume?
The market size is provided in terms of value, measured in Million.
11. Are there any specific market keywords associated with the report?
Yes, the market keyword associated with the report is "US Optical Sensors Market," which aids in identifying and referencing the specific market segment covered.
12. How do I determine which pricing option suits my needs best?
The pricing options vary based on user requirements and access needs. Individual users may opt for single-user licenses, while businesses requiring broader access may choose multi-user or enterprise licenses for cost-effective access to the report.
13. Are there any additional resources or data provided in the US Optical Sensors Market report?
While the report offers comprehensive insights, it's advisable to review the specific contents or supplementary materials provided to ascertain if additional resources or data are available.
14. How can I stay updated on further developments or reports in the US Optical Sensors Market?
To stay informed about further developments, trends, and reports in the US Optical Sensors Market, consider subscribing to industry newsletters, following relevant companies and organizations, or regularly checking reputable industry news sources and publications.
Methodology
Step 1 - Identification of Relevant Samples Size from Population Database


Step 2 - Approaches for Defining Global Market Size (Value, Volume* & Price*)

Note*: In applicable scenarios
Step 3 - Data Sources
Primary Research
- Web Analytics
- Survey Reports
- Research Institute
- Latest Research Reports
- Opinion Leaders
Secondary Research
- Annual Reports
- White Paper
- Latest Press Release
- Industry Association
- Paid Database
- Investor Presentations

Step 4 - Data Triangulation
Involves using different sources of information in order to increase the validity of a study
These sources are likely to be stakeholders in a program - participants, other researchers, program staff, other community members, and so on.
Then we put all data in single framework & apply various statistical tools to find out the dynamic on the market.
During the analysis stage, feedback from the stakeholder groups would be compared to determine areas of agreement as well as areas of divergence


