
Key Insights
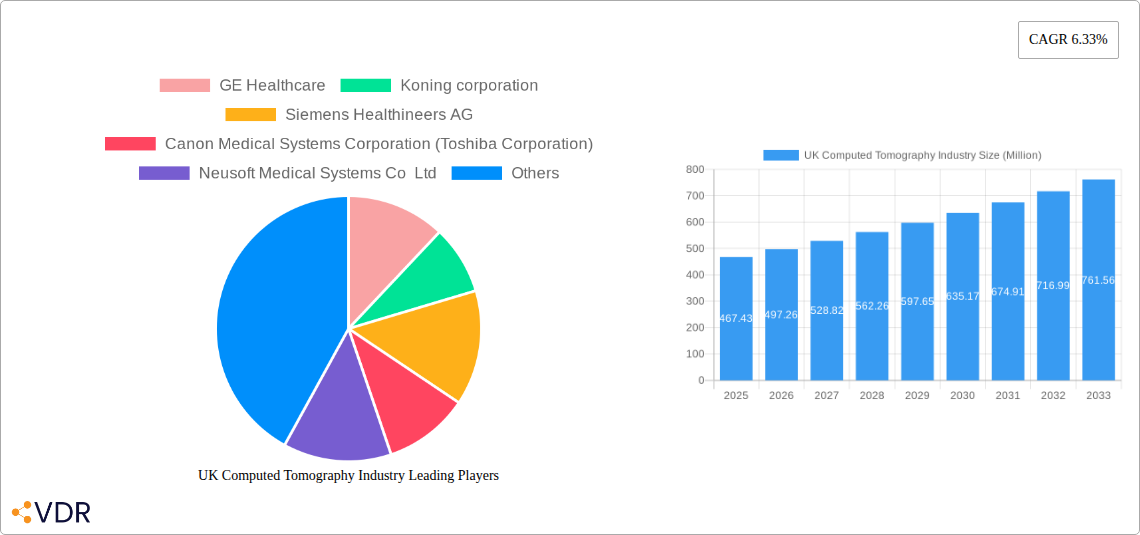
The UK computed tomography (CT) industry, valued at £467.43 million in 2025, is projected to experience robust growth, driven by several key factors. The increasing prevalence of chronic diseases like cancer and cardiovascular conditions necessitates advanced diagnostic imaging, fueling demand for CT scans. Technological advancements, such as multi-slice CT scanners offering faster scan times and improved image quality, are further boosting market expansion. Government initiatives aimed at improving healthcare infrastructure and increasing access to diagnostic services also contribute positively. The segment breakdown reveals a diverse market, with high-slice CT scanners commanding a significant share due to their superior capabilities. Oncology and cardiology applications constitute major revenue streams, reflecting the high incidence of related diseases. Hospitals remain the dominant end-users, although diagnostic centers are witnessing growing adoption. Competitive landscape analysis indicates that key players like GE Healthcare, Siemens Healthineers, and Canon Medical Systems hold substantial market share, but smaller players are also contributing to innovation and market expansion.
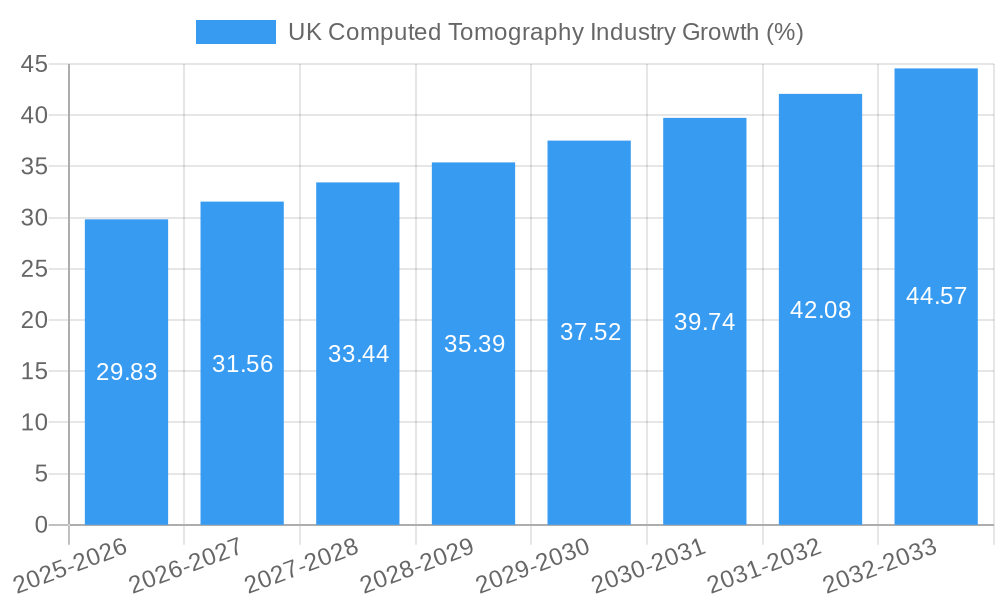
Looking forward, the 6.33% CAGR forecasts a substantial increase in market size by 2033. However, challenges remain. Cost constraints associated with advanced CT technologies and the need for skilled radiologists could hinder market growth. Strict regulatory approvals and increasing cybersecurity concerns related to medical imaging data also present hurdles. Nevertheless, the overall outlook remains positive, with the market expected to benefit from rising healthcare expenditure, an aging population requiring more frequent scans, and continuous technological innovations. The strategic focus of major players on developing AI-powered image analysis tools and improving patient experience will play a significant role in shaping the future of the UK CT market. Market segmentation strategies targeting specific needs across oncology, neurology and other applications are key for future growth.
UK Computed Tomography (CT) Industry Report: 2019-2033
This comprehensive report provides a detailed analysis of the UK Computed Tomography (CT) industry, covering market dynamics, growth trends, competitive landscape, and future outlook. It's an invaluable resource for industry professionals, investors, and strategic decision-makers seeking to understand and capitalize on opportunities within this vital sector of healthcare. The report covers the parent market of Medical Imaging and the child market of CT Scanners, providing a granular view of market segmentation and key players.
Study Period: 2019-2033; Base Year: 2025; Estimated Year: 2025; Forecast Period: 2025-2033; Historical Period: 2019-2024
UK Computed Tomography Industry Market Dynamics & Structure
This section analyzes the UK CT market's structure, focusing on market concentration, technological advancements, regulatory influences, competitive substitutions, end-user demographics, and merger & acquisition (M&A) activity. The market is characterized by a moderately concentrated landscape with key players holding significant market shares. Technological innovation, driven by improved image quality, faster scan times, and reduced radiation dose, is a key growth driver. Stringent regulatory frameworks, primarily governed by the MHRA (Medicines and Healthcare products Regulatory Agency), influence product approvals and safety standards. The presence of alternative imaging modalities (e.g., MRI, Ultrasound) creates competitive pressure. End-user demographics are evolving with an aging population increasing demand. M&A activity has been relatively moderate in recent years, with xx deals recorded between 2019 and 2024, resulting in a market consolidation of xx%.
- Market Concentration: Oligopolistic, with top 5 players holding approximately xx% market share in 2024.
- Technological Innovation: Focus on AI-powered image analysis, multi-slice technology, and dose reduction techniques.
- Regulatory Landscape: Stringent MHRA regulations impacting product approvals and market entry.
- Competitive Substitutes: MRI, Ultrasound, and X-ray imaging pose competitive challenges.
- End-User Demographics: Aging population and rising prevalence of chronic diseases drive demand.
- M&A Activity: xx deals between 2019-2024, leading to xx% market consolidation. Future M&A activity is predicted at xx deals between 2025-2033.
UK Computed Tomography Industry Growth Trends & Insights
The UK CT market exhibited robust growth during the historical period (2019-2024), with a CAGR of xx%. This growth is projected to continue during the forecast period (2025-2033), with a forecasted CAGR of xx%, reaching a market value of £xx million by 2033. The increasing prevalence of chronic diseases, technological advancements leading to improved diagnostic capabilities and patient outcomes, and rising healthcare expenditure are key growth drivers. Market penetration of CT scanners is expected to increase from xx% in 2024 to xx% in 2033. Adoption is particularly strong in Hospitals, driven by increasing demand for advanced imaging technologies.
Dominant Regions, Countries, or Segments in UK Computed Tomography Industry
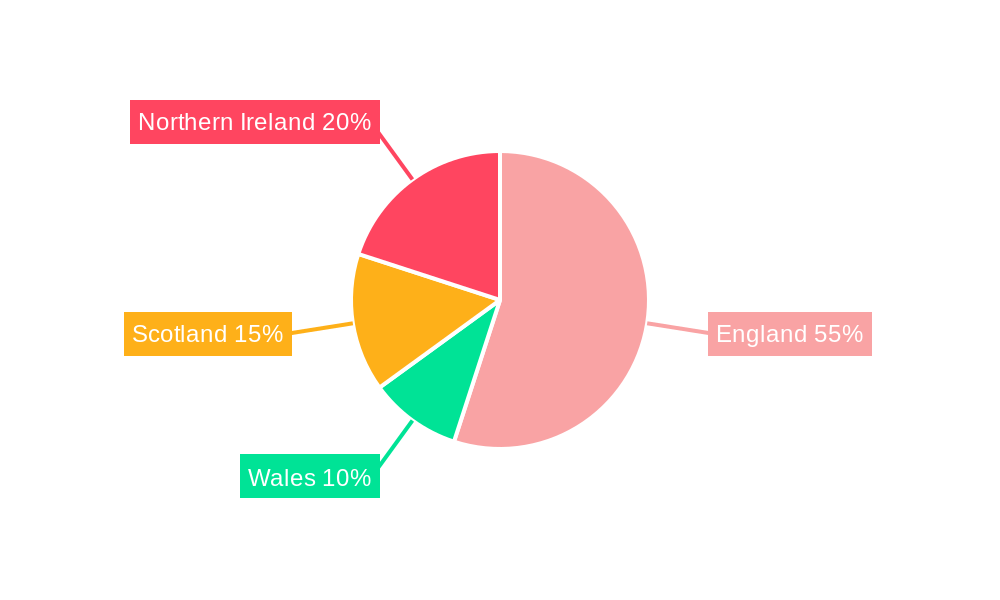
The market demonstrates regional variations in growth. London and the South East are currently the most dominant regions, accounting for xx% of the total market in 2024, driven by a high concentration of hospitals and diagnostic centers and strong economic activity. Within application segments, Oncology (xx% market share in 2024) and Cardiovascular (xx% market share in 2024) applications dominate due to high prevalence rates and improved treatment effectiveness with CT-guided procedures. High-slice CT scanners (xx% market share in 2024) represent a significant portion of the market due to their advanced imaging capabilities, though Medium-Slice scanners hold a higher volume of installations. Hospitals constitute the largest end-user segment, capturing xx% of the market in 2024.
- Regional Dominance: London and South East due to high concentration of healthcare facilities and economic activity.
- Application Dominance: Oncology and Cardiovascular due to high prevalence rates and effectiveness of CT-guided treatment.
- Type Dominance: High-Slice CT scanners due to advanced capabilities; Medium-Slice scanners hold higher installation volumes.
- End-User Dominance: Hospitals due to high volume of diagnostic needs.
UK Computed Tomography Industry Product Landscape
The UK CT scanner market showcases a diverse range of products from leading manufacturers, each offering unique features and capabilities. Recent innovations focus on improving image quality through advanced detectors and reconstruction algorithms, reducing radiation dose through iterative reconstruction techniques, and integrating AI for automated analysis and faster workflows. Key selling propositions include faster scan times, improved image clarity, and reduced radiation exposure, enhancing patient experience and diagnostic accuracy.
Key Drivers, Barriers & Challenges in UK Computed Tomography Industry
Key Drivers: Increasing prevalence of chronic diseases, technological advancements in CT scanner technology, rising healthcare expenditure, and government initiatives promoting advanced medical imaging are key drivers. The rise of AI and improved image analysis is also a significant accelerator.
Key Barriers & Challenges: High initial investment costs for CT scanners can be a barrier for smaller facilities. Stringent regulatory approvals and reimbursement policies can also pose challenges. Competition from alternative imaging modalities and maintaining a skilled workforce are additional considerations. Supply chain disruptions can impact procurement and availability. The estimated impact of supply chain issues on the market is predicted to be a reduction of xx% in growth in 2026.
Emerging Opportunities in UK Computed Tomography Industry
Growing demand for minimally invasive procedures presents significant opportunities for CT-guided interventions. The increasing adoption of AI-powered image analysis tools offers potential for improved diagnostic accuracy and efficiency. Expansion into underserved regions with limited access to advanced medical imaging presents significant potential. Growth in private healthcare facilities creates further opportunities.
Growth Accelerators in the UK Computed Tomography Industry
Technological advancements, such as AI-powered image analysis and improved detector technology, are key growth accelerators. Strategic partnerships between healthcare providers and technology companies are driving innovation and market expansion. Government initiatives to improve healthcare infrastructure and access to advanced medical imaging services further stimulate growth.
Key Players Shaping the UK Computed Tomography Industry Market
- GE Healthcare
- Koning corporation
- Siemens Healthineers AG
- Canon Medical Systems Corporation (Toshiba Corporation)
- Neusoft Medical Systems Co Ltd
- Carestream Health
- Koninklijke Philips NV
- Stryker Corporation
- Planmeca Group (Planmed OY)
- Samsung Electronics Co Ltd
- Fujifilm Holdings Corporation
Notable Milestones in UK Computed Tomography Industry Sector
- April 2022: A new EUR 1.3m CT scanner installed at North Tyneside Hospital, funded by EUR 350 million from the DHSC. This highlights significant government investment in healthcare infrastructure.
- October 2021: Two new CT scanners installed at Surrey and Sussex Healthcare NHS Trust by Canon Medical Systems UK, increasing outpatient imaging capacity by 1000 scans per month. This signifies growing demand and capacity expansion within the NHS.
In-Depth UK Computed Tomography Industry Market Outlook
The UK CT market is poised for continued growth, driven by technological advancements, increasing prevalence of chronic diseases, and rising healthcare spending. Strategic partnerships and government investments will further accelerate market expansion. Opportunities exist in AI-driven diagnostics, minimally invasive procedures, and expansion into underserved regions. The market’s future potential is substantial, presenting lucrative opportunities for both established players and new entrants.
UK Computed Tomography Industry Segmentation
-
1. Type
- 1.1. Low Slice
- 1.2. Medium Slice
- 1.3. High Slice
-
2. Application
- 2.1. Oncology
- 2.2. Neurology
- 2.3. Cardiovascular
- 2.4. Musculoskeletal
- 2.5. Other Applications
-
3. End User
- 3.1. Hospitals
- 3.2. Diagnostic Centers
- 3.3. Other End Users
UK Computed Tomography Industry Segmentation By Geography
-
1. North America
- 1.1. United States
- 1.2. Canada
- 1.3. Mexico
-
2. South America
- 2.1. Brazil
- 2.2. Argentina
- 2.3. Rest of South America
-
3. Europe
- 3.1. United Kingdom
- 3.2. Germany
- 3.3. France
- 3.4. Italy
- 3.5. Spain
- 3.6. Russia
- 3.7. Benelux
- 3.8. Nordics
- 3.9. Rest of Europe
-
4. Middle East & Africa
- 4.1. Turkey
- 4.2. Israel
- 4.3. GCC
- 4.4. North Africa
- 4.5. South Africa
- 4.6. Rest of Middle East & Africa
-
5. Asia Pacific
- 5.1. China
- 5.2. India
- 5.3. Japan
- 5.4. South Korea
- 5.5. ASEAN
- 5.6. Oceania
- 5.7. Rest of Asia Pacific
UK Computed Tomography Industry REPORT HIGHLIGHTS
| Aspects | Details |
|---|---|
| Study Period | 2019-2033 |
| Base Year | 2024 |
| Estimated Year | 2025 |
| Forecast Period | 2025-2033 |
| Historical Period | 2019-2024 |
| Growth Rate | CAGR of 6.33% from 2019-2033 |
| Segmentation |
|
Table of Contents
- 1. Introduction
- 1.1. Research Scope
- 1.2. Market Segmentation
- 1.3. Research Methodology
- 1.4. Definitions and Assumptions
- 2. Executive Summary
- 2.1. Introduction
- 3. Market Dynamics
- 3.1. Introduction
- 3.2. Market Drivers
- 3.2.1. Increasing Prevalence of Chronic Diseases; Rising Geriatric Population; Increasing Technological Advancements
- 3.3. Market Restrains
- 3.3.1. Lack Of Proper Reimbursement And Stringent Regulatory Approval Procedures; High Cost of Equipment
- 3.4. Market Trends
- 3.4.1. Oncology Segment is Expected to Hold a Significant Market Share Over the Forecast Period
- 4. Market Factor Analysis
- 4.1. Porters Five Forces
- 4.2. Supply/Value Chain
- 4.3. PESTEL analysis
- 4.4. Market Entropy
- 4.5. Patent/Trademark Analysis
- 5. Global UK Computed Tomography Industry Analysis, Insights and Forecast, 2019-2031
- 5.1. Market Analysis, Insights and Forecast - by Type
- 5.1.1. Low Slice
- 5.1.2. Medium Slice
- 5.1.3. High Slice
- 5.2. Market Analysis, Insights and Forecast - by Application
- 5.2.1. Oncology
- 5.2.2. Neurology
- 5.2.3. Cardiovascular
- 5.2.4. Musculoskeletal
- 5.2.5. Other Applications
- 5.3. Market Analysis, Insights and Forecast - by End User
- 5.3.1. Hospitals
- 5.3.2. Diagnostic Centers
- 5.3.3. Other End Users
- 5.4. Market Analysis, Insights and Forecast - by Region
- 5.4.1. North America
- 5.4.2. South America
- 5.4.3. Europe
- 5.4.4. Middle East & Africa
- 5.4.5. Asia Pacific
- 5.1. Market Analysis, Insights and Forecast - by Type
- 6. North America UK Computed Tomography Industry Analysis, Insights and Forecast, 2019-2031
- 6.1. Market Analysis, Insights and Forecast - by Type
- 6.1.1. Low Slice
- 6.1.2. Medium Slice
- 6.1.3. High Slice
- 6.2. Market Analysis, Insights and Forecast - by Application
- 6.2.1. Oncology
- 6.2.2. Neurology
- 6.2.3. Cardiovascular
- 6.2.4. Musculoskeletal
- 6.2.5. Other Applications
- 6.3. Market Analysis, Insights and Forecast - by End User
- 6.3.1. Hospitals
- 6.3.2. Diagnostic Centers
- 6.3.3. Other End Users
- 6.1. Market Analysis, Insights and Forecast - by Type
- 7. South America UK Computed Tomography Industry Analysis, Insights and Forecast, 2019-2031
- 7.1. Market Analysis, Insights and Forecast - by Type
- 7.1.1. Low Slice
- 7.1.2. Medium Slice
- 7.1.3. High Slice
- 7.2. Market Analysis, Insights and Forecast - by Application
- 7.2.1. Oncology
- 7.2.2. Neurology
- 7.2.3. Cardiovascular
- 7.2.4. Musculoskeletal
- 7.2.5. Other Applications
- 7.3. Market Analysis, Insights and Forecast - by End User
- 7.3.1. Hospitals
- 7.3.2. Diagnostic Centers
- 7.3.3. Other End Users
- 7.1. Market Analysis, Insights and Forecast - by Type
- 8. Europe UK Computed Tomography Industry Analysis, Insights and Forecast, 2019-2031
- 8.1. Market Analysis, Insights and Forecast - by Type
- 8.1.1. Low Slice
- 8.1.2. Medium Slice
- 8.1.3. High Slice
- 8.2. Market Analysis, Insights and Forecast - by Application
- 8.2.1. Oncology
- 8.2.2. Neurology
- 8.2.3. Cardiovascular
- 8.2.4. Musculoskeletal
- 8.2.5. Other Applications
- 8.3. Market Analysis, Insights and Forecast - by End User
- 8.3.1. Hospitals
- 8.3.2. Diagnostic Centers
- 8.3.3. Other End Users
- 8.1. Market Analysis, Insights and Forecast - by Type
- 9. Middle East & Africa UK Computed Tomography Industry Analysis, Insights and Forecast, 2019-2031
- 9.1. Market Analysis, Insights and Forecast - by Type
- 9.1.1. Low Slice
- 9.1.2. Medium Slice
- 9.1.3. High Slice
- 9.2. Market Analysis, Insights and Forecast - by Application
- 9.2.1. Oncology
- 9.2.2. Neurology
- 9.2.3. Cardiovascular
- 9.2.4. Musculoskeletal
- 9.2.5. Other Applications
- 9.3. Market Analysis, Insights and Forecast - by End User
- 9.3.1. Hospitals
- 9.3.2. Diagnostic Centers
- 9.3.3. Other End Users
- 9.1. Market Analysis, Insights and Forecast - by Type
- 10. Asia Pacific UK Computed Tomography Industry Analysis, Insights and Forecast, 2019-2031
- 10.1. Market Analysis, Insights and Forecast - by Type
- 10.1.1. Low Slice
- 10.1.2. Medium Slice
- 10.1.3. High Slice
- 10.2. Market Analysis, Insights and Forecast - by Application
- 10.2.1. Oncology
- 10.2.2. Neurology
- 10.2.3. Cardiovascular
- 10.2.4. Musculoskeletal
- 10.2.5. Other Applications
- 10.3. Market Analysis, Insights and Forecast - by End User
- 10.3.1. Hospitals
- 10.3.2. Diagnostic Centers
- 10.3.3. Other End Users
- 10.1. Market Analysis, Insights and Forecast - by Type
- 11. England UK Computed Tomography Industry Analysis, Insights and Forecast, 2019-2031
- 12. Wales UK Computed Tomography Industry Analysis, Insights and Forecast, 2019-2031
- 13. Scotland UK Computed Tomography Industry Analysis, Insights and Forecast, 2019-2031
- 14. Northern UK Computed Tomography Industry Analysis, Insights and Forecast, 2019-2031
- 15. Ireland UK Computed Tomography Industry Analysis, Insights and Forecast, 2019-2031
- 16. Competitive Analysis
- 16.1. Global Market Share Analysis 2024
- 16.2. Company Profiles
- 16.2.1 GE Healthcare
- 16.2.1.1. Overview
- 16.2.1.2. Products
- 16.2.1.3. SWOT Analysis
- 16.2.1.4. Recent Developments
- 16.2.1.5. Financials (Based on Availability)
- 16.2.2 Koning corporation
- 16.2.2.1. Overview
- 16.2.2.2. Products
- 16.2.2.3. SWOT Analysis
- 16.2.2.4. Recent Developments
- 16.2.2.5. Financials (Based on Availability)
- 16.2.3 Siemens Healthineers AG
- 16.2.3.1. Overview
- 16.2.3.2. Products
- 16.2.3.3. SWOT Analysis
- 16.2.3.4. Recent Developments
- 16.2.3.5. Financials (Based on Availability)
- 16.2.4 Canon Medical Systems Corporation (Toshiba Corporation)
- 16.2.4.1. Overview
- 16.2.4.2. Products
- 16.2.4.3. SWOT Analysis
- 16.2.4.4. Recent Developments
- 16.2.4.5. Financials (Based on Availability)
- 16.2.5 Neusoft Medical Systems Co Ltd
- 16.2.5.1. Overview
- 16.2.5.2. Products
- 16.2.5.3. SWOT Analysis
- 16.2.5.4. Recent Developments
- 16.2.5.5. Financials (Based on Availability)
- 16.2.6 Carestream Health
- 16.2.6.1. Overview
- 16.2.6.2. Products
- 16.2.6.3. SWOT Analysis
- 16.2.6.4. Recent Developments
- 16.2.6.5. Financials (Based on Availability)
- 16.2.7 Koninklijke Philips NV
- 16.2.7.1. Overview
- 16.2.7.2. Products
- 16.2.7.3. SWOT Analysis
- 16.2.7.4. Recent Developments
- 16.2.7.5. Financials (Based on Availability)
- 16.2.8 Stryker Corporation
- 16.2.8.1. Overview
- 16.2.8.2. Products
- 16.2.8.3. SWOT Analysis
- 16.2.8.4. Recent Developments
- 16.2.8.5. Financials (Based on Availability)
- 16.2.9 Planmeca Group (Planmed OY)
- 16.2.9.1. Overview
- 16.2.9.2. Products
- 16.2.9.3. SWOT Analysis
- 16.2.9.4. Recent Developments
- 16.2.9.5. Financials (Based on Availability)
- 16.2.10 Samsung Electronics Co Ltd
- 16.2.10.1. Overview
- 16.2.10.2. Products
- 16.2.10.3. SWOT Analysis
- 16.2.10.4. Recent Developments
- 16.2.10.5. Financials (Based on Availability)
- 16.2.11 Fujifilm Holdings Corporation
- 16.2.11.1. Overview
- 16.2.11.2. Products
- 16.2.11.3. SWOT Analysis
- 16.2.11.4. Recent Developments
- 16.2.11.5. Financials (Based on Availability)
- 16.2.1 GE Healthcare
List of Figures
- Figure 1: Global UK Computed Tomography Industry Revenue Breakdown (Million, %) by Region 2024 & 2032
- Figure 2: United kingdom Region UK Computed Tomography Industry Revenue (Million), by Country 2024 & 2032
- Figure 3: United kingdom Region UK Computed Tomography Industry Revenue Share (%), by Country 2024 & 2032
- Figure 4: North America UK Computed Tomography Industry Revenue (Million), by Type 2024 & 2032
- Figure 5: North America UK Computed Tomography Industry Revenue Share (%), by Type 2024 & 2032
- Figure 6: North America UK Computed Tomography Industry Revenue (Million), by Application 2024 & 2032
- Figure 7: North America UK Computed Tomography Industry Revenue Share (%), by Application 2024 & 2032
- Figure 8: North America UK Computed Tomography Industry Revenue (Million), by End User 2024 & 2032
- Figure 9: North America UK Computed Tomography Industry Revenue Share (%), by End User 2024 & 2032
- Figure 10: North America UK Computed Tomography Industry Revenue (Million), by Country 2024 & 2032
- Figure 11: North America UK Computed Tomography Industry Revenue Share (%), by Country 2024 & 2032
- Figure 12: South America UK Computed Tomography Industry Revenue (Million), by Type 2024 & 2032
- Figure 13: South America UK Computed Tomography Industry Revenue Share (%), by Type 2024 & 2032
- Figure 14: South America UK Computed Tomography Industry Revenue (Million), by Application 2024 & 2032
- Figure 15: South America UK Computed Tomography Industry Revenue Share (%), by Application 2024 & 2032
- Figure 16: South America UK Computed Tomography Industry Revenue (Million), by End User 2024 & 2032
- Figure 17: South America UK Computed Tomography Industry Revenue Share (%), by End User 2024 & 2032
- Figure 18: South America UK Computed Tomography Industry Revenue (Million), by Country 2024 & 2032
- Figure 19: South America UK Computed Tomography Industry Revenue Share (%), by Country 2024 & 2032
- Figure 20: Europe UK Computed Tomography Industry Revenue (Million), by Type 2024 & 2032
- Figure 21: Europe UK Computed Tomography Industry Revenue Share (%), by Type 2024 & 2032
- Figure 22: Europe UK Computed Tomography Industry Revenue (Million), by Application 2024 & 2032
- Figure 23: Europe UK Computed Tomography Industry Revenue Share (%), by Application 2024 & 2032
- Figure 24: Europe UK Computed Tomography Industry Revenue (Million), by End User 2024 & 2032
- Figure 25: Europe UK Computed Tomography Industry Revenue Share (%), by End User 2024 & 2032
- Figure 26: Europe UK Computed Tomography Industry Revenue (Million), by Country 2024 & 2032
- Figure 27: Europe UK Computed Tomography Industry Revenue Share (%), by Country 2024 & 2032
- Figure 28: Middle East & Africa UK Computed Tomography Industry Revenue (Million), by Type 2024 & 2032
- Figure 29: Middle East & Africa UK Computed Tomography Industry Revenue Share (%), by Type 2024 & 2032
- Figure 30: Middle East & Africa UK Computed Tomography Industry Revenue (Million), by Application 2024 & 2032
- Figure 31: Middle East & Africa UK Computed Tomography Industry Revenue Share (%), by Application 2024 & 2032
- Figure 32: Middle East & Africa UK Computed Tomography Industry Revenue (Million), by End User 2024 & 2032
- Figure 33: Middle East & Africa UK Computed Tomography Industry Revenue Share (%), by End User 2024 & 2032
- Figure 34: Middle East & Africa UK Computed Tomography Industry Revenue (Million), by Country 2024 & 2032
- Figure 35: Middle East & Africa UK Computed Tomography Industry Revenue Share (%), by Country 2024 & 2032
- Figure 36: Asia Pacific UK Computed Tomography Industry Revenue (Million), by Type 2024 & 2032
- Figure 37: Asia Pacific UK Computed Tomography Industry Revenue Share (%), by Type 2024 & 2032
- Figure 38: Asia Pacific UK Computed Tomography Industry Revenue (Million), by Application 2024 & 2032
- Figure 39: Asia Pacific UK Computed Tomography Industry Revenue Share (%), by Application 2024 & 2032
- Figure 40: Asia Pacific UK Computed Tomography Industry Revenue (Million), by End User 2024 & 2032
- Figure 41: Asia Pacific UK Computed Tomography Industry Revenue Share (%), by End User 2024 & 2032
- Figure 42: Asia Pacific UK Computed Tomography Industry Revenue (Million), by Country 2024 & 2032
- Figure 43: Asia Pacific UK Computed Tomography Industry Revenue Share (%), by Country 2024 & 2032
List of Tables
- Table 1: Global UK Computed Tomography Industry Revenue Million Forecast, by Region 2019 & 2032
- Table 2: Global UK Computed Tomography Industry Revenue Million Forecast, by Type 2019 & 2032
- Table 3: Global UK Computed Tomography Industry Revenue Million Forecast, by Application 2019 & 2032
- Table 4: Global UK Computed Tomography Industry Revenue Million Forecast, by End User 2019 & 2032
- Table 5: Global UK Computed Tomography Industry Revenue Million Forecast, by Region 2019 & 2032
- Table 6: Global UK Computed Tomography Industry Revenue Million Forecast, by Country 2019 & 2032
- Table 7: England UK Computed Tomography Industry Revenue (Million) Forecast, by Application 2019 & 2032
- Table 8: Wales UK Computed Tomography Industry Revenue (Million) Forecast, by Application 2019 & 2032
- Table 9: Scotland UK Computed Tomography Industry Revenue (Million) Forecast, by Application 2019 & 2032
- Table 10: Northern UK Computed Tomography Industry Revenue (Million) Forecast, by Application 2019 & 2032
- Table 11: Ireland UK Computed Tomography Industry Revenue (Million) Forecast, by Application 2019 & 2032
- Table 12: Global UK Computed Tomography Industry Revenue Million Forecast, by Type 2019 & 2032
- Table 13: Global UK Computed Tomography Industry Revenue Million Forecast, by Application 2019 & 2032
- Table 14: Global UK Computed Tomography Industry Revenue Million Forecast, by End User 2019 & 2032
- Table 15: Global UK Computed Tomography Industry Revenue Million Forecast, by Country 2019 & 2032
- Table 16: United States UK Computed Tomography Industry Revenue (Million) Forecast, by Application 2019 & 2032
- Table 17: Canada UK Computed Tomography Industry Revenue (Million) Forecast, by Application 2019 & 2032
- Table 18: Mexico UK Computed Tomography Industry Revenue (Million) Forecast, by Application 2019 & 2032
- Table 19: Global UK Computed Tomography Industry Revenue Million Forecast, by Type 2019 & 2032
- Table 20: Global UK Computed Tomography Industry Revenue Million Forecast, by Application 2019 & 2032
- Table 21: Global UK Computed Tomography Industry Revenue Million Forecast, by End User 2019 & 2032
- Table 22: Global UK Computed Tomography Industry Revenue Million Forecast, by Country 2019 & 2032
- Table 23: Brazil UK Computed Tomography Industry Revenue (Million) Forecast, by Application 2019 & 2032
- Table 24: Argentina UK Computed Tomography Industry Revenue (Million) Forecast, by Application 2019 & 2032
- Table 25: Rest of South America UK Computed Tomography Industry Revenue (Million) Forecast, by Application 2019 & 2032
- Table 26: Global UK Computed Tomography Industry Revenue Million Forecast, by Type 2019 & 2032
- Table 27: Global UK Computed Tomography Industry Revenue Million Forecast, by Application 2019 & 2032
- Table 28: Global UK Computed Tomography Industry Revenue Million Forecast, by End User 2019 & 2032
- Table 29: Global UK Computed Tomography Industry Revenue Million Forecast, by Country 2019 & 2032
- Table 30: United Kingdom UK Computed Tomography Industry Revenue (Million) Forecast, by Application 2019 & 2032
- Table 31: Germany UK Computed Tomography Industry Revenue (Million) Forecast, by Application 2019 & 2032
- Table 32: France UK Computed Tomography Industry Revenue (Million) Forecast, by Application 2019 & 2032
- Table 33: Italy UK Computed Tomography Industry Revenue (Million) Forecast, by Application 2019 & 2032
- Table 34: Spain UK Computed Tomography Industry Revenue (Million) Forecast, by Application 2019 & 2032
- Table 35: Russia UK Computed Tomography Industry Revenue (Million) Forecast, by Application 2019 & 2032
- Table 36: Benelux UK Computed Tomography Industry Revenue (Million) Forecast, by Application 2019 & 2032
- Table 37: Nordics UK Computed Tomography Industry Revenue (Million) Forecast, by Application 2019 & 2032
- Table 38: Rest of Europe UK Computed Tomography Industry Revenue (Million) Forecast, by Application 2019 & 2032
- Table 39: Global UK Computed Tomography Industry Revenue Million Forecast, by Type 2019 & 2032
- Table 40: Global UK Computed Tomography Industry Revenue Million Forecast, by Application 2019 & 2032
- Table 41: Global UK Computed Tomography Industry Revenue Million Forecast, by End User 2019 & 2032
- Table 42: Global UK Computed Tomography Industry Revenue Million Forecast, by Country 2019 & 2032
- Table 43: Turkey UK Computed Tomography Industry Revenue (Million) Forecast, by Application 2019 & 2032
- Table 44: Israel UK Computed Tomography Industry Revenue (Million) Forecast, by Application 2019 & 2032
- Table 45: GCC UK Computed Tomography Industry Revenue (Million) Forecast, by Application 2019 & 2032
- Table 46: North Africa UK Computed Tomography Industry Revenue (Million) Forecast, by Application 2019 & 2032
- Table 47: South Africa UK Computed Tomography Industry Revenue (Million) Forecast, by Application 2019 & 2032
- Table 48: Rest of Middle East & Africa UK Computed Tomography Industry Revenue (Million) Forecast, by Application 2019 & 2032
- Table 49: Global UK Computed Tomography Industry Revenue Million Forecast, by Type 2019 & 2032
- Table 50: Global UK Computed Tomography Industry Revenue Million Forecast, by Application 2019 & 2032
- Table 51: Global UK Computed Tomography Industry Revenue Million Forecast, by End User 2019 & 2032
- Table 52: Global UK Computed Tomography Industry Revenue Million Forecast, by Country 2019 & 2032
- Table 53: China UK Computed Tomography Industry Revenue (Million) Forecast, by Application 2019 & 2032
- Table 54: India UK Computed Tomography Industry Revenue (Million) Forecast, by Application 2019 & 2032
- Table 55: Japan UK Computed Tomography Industry Revenue (Million) Forecast, by Application 2019 & 2032
- Table 56: South Korea UK Computed Tomography Industry Revenue (Million) Forecast, by Application 2019 & 2032
- Table 57: ASEAN UK Computed Tomography Industry Revenue (Million) Forecast, by Application 2019 & 2032
- Table 58: Oceania UK Computed Tomography Industry Revenue (Million) Forecast, by Application 2019 & 2032
- Table 59: Rest of Asia Pacific UK Computed Tomography Industry Revenue (Million) Forecast, by Application 2019 & 2032
Frequently Asked Questions
1. What is the projected Compound Annual Growth Rate (CAGR) of the UK Computed Tomography Industry?
The projected CAGR is approximately 6.33%.
2. Which companies are prominent players in the UK Computed Tomography Industry?
Key companies in the market include GE Healthcare, Koning corporation, Siemens Healthineers AG, Canon Medical Systems Corporation (Toshiba Corporation), Neusoft Medical Systems Co Ltd, Carestream Health, Koninklijke Philips NV, Stryker Corporation, Planmeca Group (Planmed OY), Samsung Electronics Co Ltd, Fujifilm Holdings Corporation.
3. What are the main segments of the UK Computed Tomography Industry?
The market segments include Type, Application, End User.
4. Can you provide details about the market size?
The market size is estimated to be USD 467.43 Million as of 2022.
5. What are some drivers contributing to market growth?
Increasing Prevalence of Chronic Diseases; Rising Geriatric Population; Increasing Technological Advancements.
6. What are the notable trends driving market growth?
Oncology Segment is Expected to Hold a Significant Market Share Over the Forecast Period.
7. Are there any restraints impacting market growth?
Lack Of Proper Reimbursement And Stringent Regulatory Approval Procedures; High Cost of Equipment.
8. Can you provide examples of recent developments in the market?
In April 2022, a new EUR 1.3m CT scanner was installed at North Tyneside Hospital with the funding of EUR 350 million from the Department of Health and Social Care (DHSC).
9. What pricing options are available for accessing the report?
Pricing options include single-user, multi-user, and enterprise licenses priced at USD 3800, USD 4500, and USD 5800 respectively.
10. Is the market size provided in terms of value or volume?
The market size is provided in terms of value, measured in Million.
11. Are there any specific market keywords associated with the report?
Yes, the market keyword associated with the report is "UK Computed Tomography Industry," which aids in identifying and referencing the specific market segment covered.
12. How do I determine which pricing option suits my needs best?
The pricing options vary based on user requirements and access needs. Individual users may opt for single-user licenses, while businesses requiring broader access may choose multi-user or enterprise licenses for cost-effective access to the report.
13. Are there any additional resources or data provided in the UK Computed Tomography Industry report?
While the report offers comprehensive insights, it's advisable to review the specific contents or supplementary materials provided to ascertain if additional resources or data are available.
14. How can I stay updated on further developments or reports in the UK Computed Tomography Industry?
To stay informed about further developments, trends, and reports in the UK Computed Tomography Industry, consider subscribing to industry newsletters, following relevant companies and organizations, or regularly checking reputable industry news sources and publications.
Methodology
Step 1 - Identification of Relevant Samples Size from Population Database


Step 2 - Approaches for Defining Global Market Size (Value, Volume* & Price*)

Note*: In applicable scenarios
Step 3 - Data Sources
Primary Research
- Web Analytics
- Survey Reports
- Research Institute
- Latest Research Reports
- Opinion Leaders
Secondary Research
- Annual Reports
- White Paper
- Latest Press Release
- Industry Association
- Paid Database
- Investor Presentations

Step 4 - Data Triangulation
Involves using different sources of information in order to increase the validity of a study
These sources are likely to be stakeholders in a program - participants, other researchers, program staff, other community members, and so on.
Then we put all data in single framework & apply various statistical tools to find out the dynamic on the market.
During the analysis stage, feedback from the stakeholder groups would be compared to determine areas of agreement as well as areas of divergence


