
Key Insights
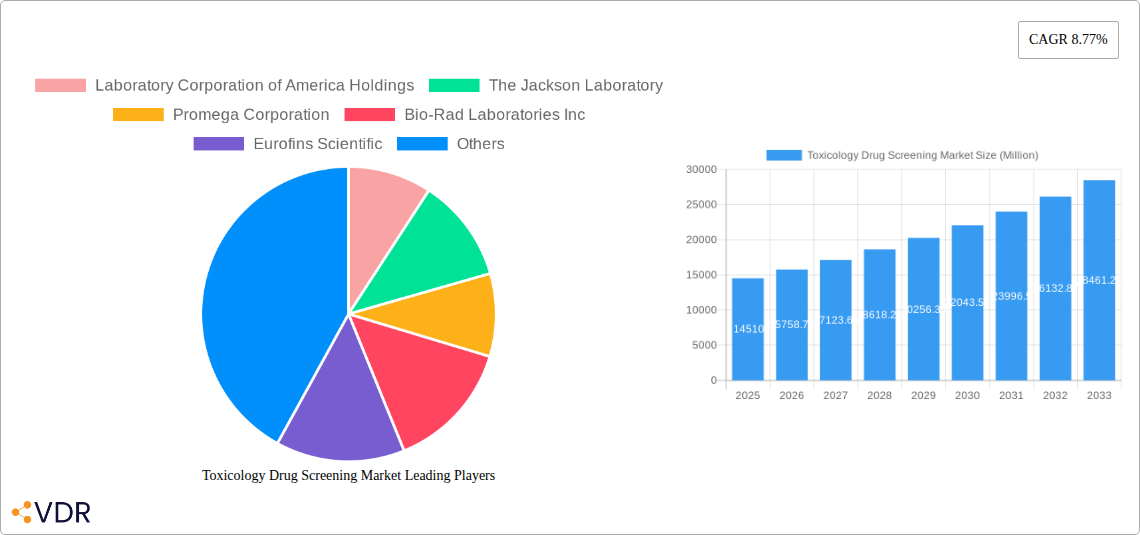
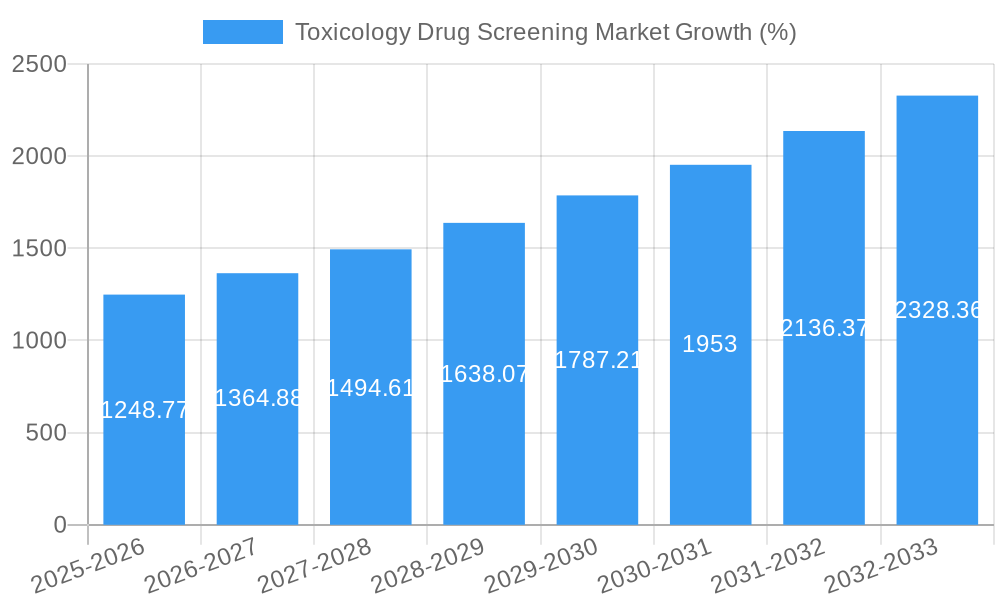
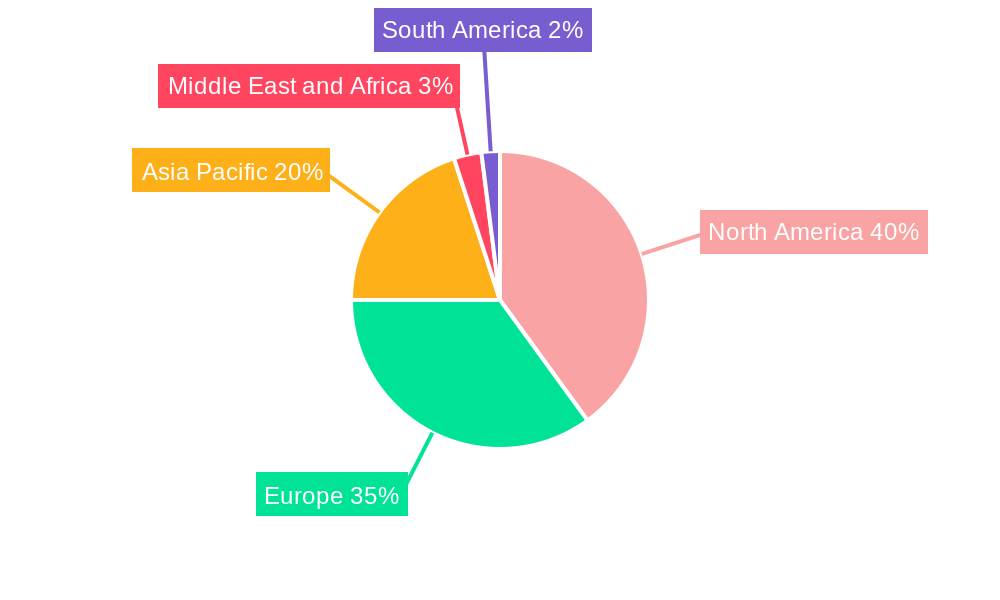
The toxicology drug screening market, valued at $14.51 billion in 2025, is projected to experience robust growth, driven by the increasing need for efficient and reliable drug safety assessment. A compound annual growth rate (CAGR) of 8.77% from 2025 to 2033 signifies a substantial expansion, fueled by several key factors. The rising prevalence of chronic diseases necessitates a surge in drug development, directly impacting the demand for comprehensive toxicology testing. Advances in technologies like in silico modeling and high-throughput screening are streamlining the drug discovery process, improving efficiency, and reducing costs, thus further stimulating market growth. Furthermore, stringent regulatory requirements regarding drug safety and efficacy worldwide are compelling pharmaceutical and biotechnology companies to invest heavily in advanced toxicology screening methods. The market segmentation reveals a significant contribution from In Vitro testing methods due to their cost-effectiveness and high throughput capabilities, while the demand for sophisticated Instruments and Reagents & Consumables is also contributing to market expansion. The dominance of North America and Europe in terms of market share reflects their advanced healthcare infrastructure and high pharmaceutical R&D spending. However, the Asia-Pacific region is expected to witness significant growth in the coming years, driven by increasing healthcare expenditure and expanding pharmaceutical industries in countries like China and India.
The competitive landscape is characterized by the presence of major players like Thermo Fisher Scientific, Charles River Laboratories, and others who are continually striving for innovation and market consolidation through acquisitions and strategic partnerships. The market is likely to see increased adoption of personalized medicine approaches requiring more specialized toxicology testing. Despite the positive outlook, challenges such as the high cost of advanced testing technologies and ethical concerns surrounding animal testing can potentially impede market growth to some extent. However, ongoing research and technological advancements are expected to mitigate these challenges and sustain the market’s upward trajectory in the long term. The market's future expansion will depend heavily on the successful integration of new technologies and the development of more efficient and ethical testing methods.
Toxicology Drug Screening Market: A Comprehensive Report (2019-2033)
This comprehensive report provides an in-depth analysis of the Toxicology Drug Screening Market, encompassing market dynamics, growth trends, regional segmentation, product landscape, key drivers and challenges, emerging opportunities, and key players. The report covers the historical period (2019-2024), base year (2025), and forecast period (2025-2033). The market is segmented by testing type (In Vitro, In Vivo, In Silico), product (Instruments, Reagents and Consumables, Animal Models, Software, Other Products), and application (Immunotoxicity, Systemic toxicity, Developmental and Reproductive Toxicity (DART), Endocrine Disruption, Other Applications). The total market size is projected to reach xx Million by 2033.
Toxicology Drug Screening Market Dynamics & Structure
The Toxicology Drug Screening Market is characterized by a moderately consolidated structure with key players holding significant market share. Technological innovation, particularly in areas like LC-MS and computational toxicology software, is a major growth driver. Stringent regulatory frameworks governing drug testing and safety assessments influence market dynamics. Competitive product substitutes, such as alternative testing methods, pose a challenge. The end-user demographic spans pharmaceutical companies, research institutions, forensic labs, and clinical diagnostic centers. M&A activity has been moderate, with a xx number of deals recorded between 2019 and 2024, primarily focused on expanding product portfolios and geographical reach.
- Market Concentration: Moderately consolidated, with top 5 players holding approximately xx% market share in 2024.
- Technological Innovation: Driving growth through advancements in LC-MS, software solutions (e.g., Instem’s Computational Toxicology Software Suite), and automation.
- Regulatory Framework: Stringent regulations (e.g., FDA, EMA) governing drug approvals and safety testing shape market dynamics.
- Competitive Substitutes: Alternative testing methods and advancements in in silico modeling pose competitive pressures.
- End-User Demographics: Pharmaceutical and biotech companies, CROs, research institutions, forensic laboratories, and clinical diagnostic centers.
- M&A Activity: Moderate activity, with xx deals observed between 2019 and 2024, focused on expansion and diversification.
Toxicology Drug Screening Market Growth Trends & Insights
The Toxicology Drug Screening Market experienced a CAGR of xx% during 2019-2024, driven by increasing drug development activity, rising prevalence of chronic diseases, and the growing demand for safety assessments. The market is expected to maintain a robust growth trajectory, with a projected CAGR of xx% from 2025 to 2033. Technological disruptions, such as the adoption of advanced analytical techniques and AI-powered predictive models, are significantly impacting market growth. Consumer behavior is shifting toward faster, more accurate, and cost-effective testing solutions. Market penetration is highest in North America and Europe, but emerging markets are showing significant growth potential.
Dominant Regions, Countries, or Segments in Toxicology Drug Screening Market
North America currently dominates the Toxicology Drug Screening Market, holding approximately xx% of the global market share in 2024, followed by Europe with xx%. This dominance is attributed to factors such as robust healthcare infrastructure, high R&D spending, stringent regulatory frameworks, and a large number of pharmaceutical and biotechnology companies. Within the segments, the In Vitro testing type holds the largest market share due to its cost-effectiveness and relatively quick turnaround time. Similarly, the Instruments segment dominates the product category due to the significant demand for sophisticated analytical equipment. Growth is further fueled by increasing applications in Immunotoxicity and DART.
- Key Drivers:
- North America: High R&D spending, stringent regulatory frameworks, and a large pharmaceutical industry.
- Europe: Well-established healthcare infrastructure and increasing demand for drug safety assessments.
- Asia Pacific: Rapid economic growth, rising healthcare expenditure, and increasing adoption of advanced technologies.
- Dominant Segments:
- Testing Type: In Vitro
- Product: Instruments
- Application: Immunotoxicity and Developmental and Reproductive Toxicity (DART)
Toxicology Drug Screening Market Product Landscape
The Toxicology Drug Screening Market offers a diverse range of products, including advanced instruments like LC-MS systems and sophisticated software solutions for data analysis and predictive modeling. Recent innovations focus on enhancing sensitivity, speed, and accuracy of testing. Unique selling propositions often center on streamlined workflows, user-friendly interfaces, and regulatory compliance. Technological advancements include miniaturization of devices, AI-powered data analysis, and the integration of diverse analytical techniques.
Key Drivers, Barriers & Challenges in Toxicology Drug Screening Market
Key Drivers: Increasing drug development activity, stringent regulatory requirements for drug safety assessments, and growing prevalence of chronic diseases are key drivers. Technological advancements in analytical techniques and data analysis also contribute significantly.
Key Challenges: High costs associated with advanced technologies, stringent regulatory compliance requirements, and the need for skilled personnel can hinder market growth. Supply chain disruptions and intense competition also pose significant challenges. The impact of these challenges is estimated to reduce the market growth by approximately xx% in the forecast period.
Emerging Opportunities in Toxicology Drug Screening Market
Emerging opportunities lie in the development of personalized toxicology testing, expansion into emerging markets, and integration of AI and machine learning for faster and more accurate predictions. The use of 3D cell cultures and other advanced in vitro models is opening up new avenues for drug testing.
Growth Accelerators in the Toxicology Drug Screening Market Industry
Strategic partnerships and collaborations between technology providers and research institutions are accelerating market growth. Technological breakthroughs in areas such as AI and big data analytics are enhancing efficiency and accuracy of testing. Expansion into new application areas, such as environmental toxicology, will further fuel market expansion.
Key Players Shaping the Toxicology Drug Screening Market Market
- Laboratory Corporation of America Holdings
- The Jackson Laboratory
- Promega Corporation
- Bio-Rad Laboratories Inc
- Eurofins Scientific
- Charles River Laboratories International Inc
- Thermo Fisher Scientific Inc
- Agilent Technologies Inc
- Enzo Life Sciences Inc
- BioReliance Inc (Merck)
- Danaher
- Wuxi AppTec
Notable Milestones in Toxicology Drug Screening Market Sector
- June 2022: Thermo Fisher Scientific unveiled a new liquid chromatography-mass spectrometry (LC-MS) system for forensic toxicology, enhancing capabilities for identifying emerging drugs.
- November 2022: Instem updated its Computational Toxicology Software Suite, providing access to a vast database of toxicology studies, accelerating drug development and regulatory approvals.
In-Depth Toxicology Drug Screening Market Market Outlook
The Toxicology Drug Screening Market is poised for continued growth, driven by technological advancements, increasing regulatory scrutiny, and the expanding need for accurate and efficient drug safety assessments. Strategic investments in R&D, partnerships, and market expansion will be crucial for companies to capitalize on emerging opportunities and maintain a competitive edge in this dynamic market. The market is expected to witness significant growth in personalized medicine and advanced in vitro modeling technologies.
Toxicology Drug Screening Market Segmentation
-
1. Testing Type
- 1.1. In Vitro
- 1.2. In Vivo
- 1.3. In Silico
-
2. Product
- 2.1. Instruments
- 2.2. Reagents and Consumables
- 2.3. Animal Models
- 2.4. Software
- 2.5. Other Products
-
3. Application
- 3.1. Immunotoxicity
- 3.2. Systemictoxicity
- 3.3. Developmental and Reproductive Toxicity (DART)
- 3.4. Endocrine Disruption
- 3.5. Other Applications
Toxicology Drug Screening Market Segmentation By Geography
-
1. North America
- 1.1. United States
- 1.2. Canada
- 1.3. Mexico
-
2. Europe
- 2.1. Germany
- 2.2. United Kingdom
- 2.3. France
- 2.4. Italy
- 2.5. Spain
- 2.6. Rest of Europe
-
3. Asia Pacific
- 3.1. China
- 3.2. Japan
- 3.3. India
- 3.4. Australia
- 3.5. South Korea
- 3.6. Rest of Asia Pacific
-
4. Middle East and Africa
- 4.1. GCC
- 4.2. South Africa
- 4.3. Rest of Middle East and Africa
-
5. South America
- 5.1. Brazil
- 5.2. Argentina
- 5.3. Rest of South America
Toxicology Drug Screening Market REPORT HIGHLIGHTS
| Aspects | Details |
|---|---|
| Study Period | 2019-2033 |
| Base Year | 2024 |
| Estimated Year | 2025 |
| Forecast Period | 2025-2033 |
| Historical Period | 2019-2024 |
| Growth Rate | CAGR of 8.77% from 2019-2033 |
| Segmentation |
|
Table of Contents
- 1. Introduction
- 1.1. Research Scope
- 1.2. Market Segmentation
- 1.3. Research Methodology
- 1.4. Definitions and Assumptions
- 2. Executive Summary
- 2.1. Introduction
- 3. Market Dynamics
- 3.1. Introduction
- 3.2. Market Drivers
- 3.2.1. Increasing R&D Activities; Technological Advancements in Toxicology Drug Screening; Rise in Demand for Toxicology Drug Screening in Pharmaceuticals and Biotechnology
- 3.3. Market Restrains
- 3.3.1. Longer Time for Sample Testing; Regulatory Issues Regarding Approval of Healthcare Molecule
- 3.4. Market Trends
- 3.4.1. In Silico Segment is Expected to Witness Significant Growth Over the Forecast Period
- 4. Market Factor Analysis
- 4.1. Porters Five Forces
- 4.2. Supply/Value Chain
- 4.3. PESTEL analysis
- 4.4. Market Entropy
- 4.5. Patent/Trademark Analysis
- 5. Global Toxicology Drug Screening Market Analysis, Insights and Forecast, 2019-2031
- 5.1. Market Analysis, Insights and Forecast - by Testing Type
- 5.1.1. In Vitro
- 5.1.2. In Vivo
- 5.1.3. In Silico
- 5.2. Market Analysis, Insights and Forecast - by Product
- 5.2.1. Instruments
- 5.2.2. Reagents and Consumables
- 5.2.3. Animal Models
- 5.2.4. Software
- 5.2.5. Other Products
- 5.3. Market Analysis, Insights and Forecast - by Application
- 5.3.1. Immunotoxicity
- 5.3.2. Systemictoxicity
- 5.3.3. Developmental and Reproductive Toxicity (DART)
- 5.3.4. Endocrine Disruption
- 5.3.5. Other Applications
- 5.4. Market Analysis, Insights and Forecast - by Region
- 5.4.1. North America
- 5.4.2. Europe
- 5.4.3. Asia Pacific
- 5.4.4. Middle East and Africa
- 5.4.5. South America
- 5.1. Market Analysis, Insights and Forecast - by Testing Type
- 6. North America Toxicology Drug Screening Market Analysis, Insights and Forecast, 2019-2031
- 6.1. Market Analysis, Insights and Forecast - by Testing Type
- 6.1.1. In Vitro
- 6.1.2. In Vivo
- 6.1.3. In Silico
- 6.2. Market Analysis, Insights and Forecast - by Product
- 6.2.1. Instruments
- 6.2.2. Reagents and Consumables
- 6.2.3. Animal Models
- 6.2.4. Software
- 6.2.5. Other Products
- 6.3. Market Analysis, Insights and Forecast - by Application
- 6.3.1. Immunotoxicity
- 6.3.2. Systemictoxicity
- 6.3.3. Developmental and Reproductive Toxicity (DART)
- 6.3.4. Endocrine Disruption
- 6.3.5. Other Applications
- 6.1. Market Analysis, Insights and Forecast - by Testing Type
- 7. Europe Toxicology Drug Screening Market Analysis, Insights and Forecast, 2019-2031
- 7.1. Market Analysis, Insights and Forecast - by Testing Type
- 7.1.1. In Vitro
- 7.1.2. In Vivo
- 7.1.3. In Silico
- 7.2. Market Analysis, Insights and Forecast - by Product
- 7.2.1. Instruments
- 7.2.2. Reagents and Consumables
- 7.2.3. Animal Models
- 7.2.4. Software
- 7.2.5. Other Products
- 7.3. Market Analysis, Insights and Forecast - by Application
- 7.3.1. Immunotoxicity
- 7.3.2. Systemictoxicity
- 7.3.3. Developmental and Reproductive Toxicity (DART)
- 7.3.4. Endocrine Disruption
- 7.3.5. Other Applications
- 7.1. Market Analysis, Insights and Forecast - by Testing Type
- 8. Asia Pacific Toxicology Drug Screening Market Analysis, Insights and Forecast, 2019-2031
- 8.1. Market Analysis, Insights and Forecast - by Testing Type
- 8.1.1. In Vitro
- 8.1.2. In Vivo
- 8.1.3. In Silico
- 8.2. Market Analysis, Insights and Forecast - by Product
- 8.2.1. Instruments
- 8.2.2. Reagents and Consumables
- 8.2.3. Animal Models
- 8.2.4. Software
- 8.2.5. Other Products
- 8.3. Market Analysis, Insights and Forecast - by Application
- 8.3.1. Immunotoxicity
- 8.3.2. Systemictoxicity
- 8.3.3. Developmental and Reproductive Toxicity (DART)
- 8.3.4. Endocrine Disruption
- 8.3.5. Other Applications
- 8.1. Market Analysis, Insights and Forecast - by Testing Type
- 9. Middle East and Africa Toxicology Drug Screening Market Analysis, Insights and Forecast, 2019-2031
- 9.1. Market Analysis, Insights and Forecast - by Testing Type
- 9.1.1. In Vitro
- 9.1.2. In Vivo
- 9.1.3. In Silico
- 9.2. Market Analysis, Insights and Forecast - by Product
- 9.2.1. Instruments
- 9.2.2. Reagents and Consumables
- 9.2.3. Animal Models
- 9.2.4. Software
- 9.2.5. Other Products
- 9.3. Market Analysis, Insights and Forecast - by Application
- 9.3.1. Immunotoxicity
- 9.3.2. Systemictoxicity
- 9.3.3. Developmental and Reproductive Toxicity (DART)
- 9.3.4. Endocrine Disruption
- 9.3.5. Other Applications
- 9.1. Market Analysis, Insights and Forecast - by Testing Type
- 10. South America Toxicology Drug Screening Market Analysis, Insights and Forecast, 2019-2031
- 10.1. Market Analysis, Insights and Forecast - by Testing Type
- 10.1.1. In Vitro
- 10.1.2. In Vivo
- 10.1.3. In Silico
- 10.2. Market Analysis, Insights and Forecast - by Product
- 10.2.1. Instruments
- 10.2.2. Reagents and Consumables
- 10.2.3. Animal Models
- 10.2.4. Software
- 10.2.5. Other Products
- 10.3. Market Analysis, Insights and Forecast - by Application
- 10.3.1. Immunotoxicity
- 10.3.2. Systemictoxicity
- 10.3.3. Developmental and Reproductive Toxicity (DART)
- 10.3.4. Endocrine Disruption
- 10.3.5. Other Applications
- 10.1. Market Analysis, Insights and Forecast - by Testing Type
- 11. North America Toxicology Drug Screening Market Analysis, Insights and Forecast, 2019-2031
- 11.1. Market Analysis, Insights and Forecast - By Country/Sub-region
- 11.1.1 United States
- 11.1.2 Canada
- 11.1.3 Mexico
- 12. Europe Toxicology Drug Screening Market Analysis, Insights and Forecast, 2019-2031
- 12.1. Market Analysis, Insights and Forecast - By Country/Sub-region
- 12.1.1 Germany
- 12.1.2 United Kingdom
- 12.1.3 France
- 12.1.4 Italy
- 12.1.5 Spain
- 12.1.6 Rest of Europe
- 13. Asia Pacific Toxicology Drug Screening Market Analysis, Insights and Forecast, 2019-2031
- 13.1. Market Analysis, Insights and Forecast - By Country/Sub-region
- 13.1.1 China
- 13.1.2 Japan
- 13.1.3 India
- 13.1.4 Australia
- 13.1.5 South Korea
- 13.1.6 Rest of Asia Pacific
- 14. Middle East and Africa Toxicology Drug Screening Market Analysis, Insights and Forecast, 2019-2031
- 14.1. Market Analysis, Insights and Forecast - By Country/Sub-region
- 14.1.1 GCC
- 14.1.2 South Africa
- 14.1.3 Rest of Middle East and Africa
- 15. South America Toxicology Drug Screening Market Analysis, Insights and Forecast, 2019-2031
- 15.1. Market Analysis, Insights and Forecast - By Country/Sub-region
- 15.1.1 Brazil
- 15.1.2 Argentina
- 15.1.3 Rest of South America
- 16. Competitive Analysis
- 16.1. Global Market Share Analysis 2024
- 16.2. Company Profiles
- 16.2.1 Laboratory Corporation of America Holdings
- 16.2.1.1. Overview
- 16.2.1.2. Products
- 16.2.1.3. SWOT Analysis
- 16.2.1.4. Recent Developments
- 16.2.1.5. Financials (Based on Availability)
- 16.2.2 The Jackson Laboratory
- 16.2.2.1. Overview
- 16.2.2.2. Products
- 16.2.2.3. SWOT Analysis
- 16.2.2.4. Recent Developments
- 16.2.2.5. Financials (Based on Availability)
- 16.2.3 Promega Corporation
- 16.2.3.1. Overview
- 16.2.3.2. Products
- 16.2.3.3. SWOT Analysis
- 16.2.3.4. Recent Developments
- 16.2.3.5. Financials (Based on Availability)
- 16.2.4 Bio-Rad Laboratories Inc
- 16.2.4.1. Overview
- 16.2.4.2. Products
- 16.2.4.3. SWOT Analysis
- 16.2.4.4. Recent Developments
- 16.2.4.5. Financials (Based on Availability)
- 16.2.5 Eurofins Scientific
- 16.2.5.1. Overview
- 16.2.5.2. Products
- 16.2.5.3. SWOT Analysis
- 16.2.5.4. Recent Developments
- 16.2.5.5. Financials (Based on Availability)
- 16.2.6 Charles River Laboratories International Inc
- 16.2.6.1. Overview
- 16.2.6.2. Products
- 16.2.6.3. SWOT Analysis
- 16.2.6.4. Recent Developments
- 16.2.6.5. Financials (Based on Availability)
- 16.2.7 Thermo Fisher Scientific Inc
- 16.2.7.1. Overview
- 16.2.7.2. Products
- 16.2.7.3. SWOT Analysis
- 16.2.7.4. Recent Developments
- 16.2.7.5. Financials (Based on Availability)
- 16.2.8 Agilent Technologies Inc
- 16.2.8.1. Overview
- 16.2.8.2. Products
- 16.2.8.3. SWOT Analysis
- 16.2.8.4. Recent Developments
- 16.2.8.5. Financials (Based on Availability)
- 16.2.9 Enzo Life Sciences Inc
- 16.2.9.1. Overview
- 16.2.9.2. Products
- 16.2.9.3. SWOT Analysis
- 16.2.9.4. Recent Developments
- 16.2.9.5. Financials (Based on Availability)
- 16.2.10 BioReliance Inc (Merck)
- 16.2.10.1. Overview
- 16.2.10.2. Products
- 16.2.10.3. SWOT Analysis
- 16.2.10.4. Recent Developments
- 16.2.10.5. Financials (Based on Availability)
- 16.2.11 Danaher
- 16.2.11.1. Overview
- 16.2.11.2. Products
- 16.2.11.3. SWOT Analysis
- 16.2.11.4. Recent Developments
- 16.2.11.5. Financials (Based on Availability)
- 16.2.12 Wuxi AppTec
- 16.2.12.1. Overview
- 16.2.12.2. Products
- 16.2.12.3. SWOT Analysis
- 16.2.12.4. Recent Developments
- 16.2.12.5. Financials (Based on Availability)
- 16.2.1 Laboratory Corporation of America Holdings
List of Figures
- Figure 1: Global Toxicology Drug Screening Market Revenue Breakdown (Million, %) by Region 2024 & 2032
- Figure 2: Global Toxicology Drug Screening Market Volume Breakdown (K Unit, %) by Region 2024 & 2032
- Figure 3: North America Toxicology Drug Screening Market Revenue (Million), by Country 2024 & 2032
- Figure 4: North America Toxicology Drug Screening Market Volume (K Unit), by Country 2024 & 2032
- Figure 5: North America Toxicology Drug Screening Market Revenue Share (%), by Country 2024 & 2032
- Figure 6: North America Toxicology Drug Screening Market Volume Share (%), by Country 2024 & 2032
- Figure 7: Europe Toxicology Drug Screening Market Revenue (Million), by Country 2024 & 2032
- Figure 8: Europe Toxicology Drug Screening Market Volume (K Unit), by Country 2024 & 2032
- Figure 9: Europe Toxicology Drug Screening Market Revenue Share (%), by Country 2024 & 2032
- Figure 10: Europe Toxicology Drug Screening Market Volume Share (%), by Country 2024 & 2032
- Figure 11: Asia Pacific Toxicology Drug Screening Market Revenue (Million), by Country 2024 & 2032
- Figure 12: Asia Pacific Toxicology Drug Screening Market Volume (K Unit), by Country 2024 & 2032
- Figure 13: Asia Pacific Toxicology Drug Screening Market Revenue Share (%), by Country 2024 & 2032
- Figure 14: Asia Pacific Toxicology Drug Screening Market Volume Share (%), by Country 2024 & 2032
- Figure 15: Middle East and Africa Toxicology Drug Screening Market Revenue (Million), by Country 2024 & 2032
- Figure 16: Middle East and Africa Toxicology Drug Screening Market Volume (K Unit), by Country 2024 & 2032
- Figure 17: Middle East and Africa Toxicology Drug Screening Market Revenue Share (%), by Country 2024 & 2032
- Figure 18: Middle East and Africa Toxicology Drug Screening Market Volume Share (%), by Country 2024 & 2032
- Figure 19: South America Toxicology Drug Screening Market Revenue (Million), by Country 2024 & 2032
- Figure 20: South America Toxicology Drug Screening Market Volume (K Unit), by Country 2024 & 2032
- Figure 21: South America Toxicology Drug Screening Market Revenue Share (%), by Country 2024 & 2032
- Figure 22: South America Toxicology Drug Screening Market Volume Share (%), by Country 2024 & 2032
- Figure 23: North America Toxicology Drug Screening Market Revenue (Million), by Testing Type 2024 & 2032
- Figure 24: North America Toxicology Drug Screening Market Volume (K Unit), by Testing Type 2024 & 2032
- Figure 25: North America Toxicology Drug Screening Market Revenue Share (%), by Testing Type 2024 & 2032
- Figure 26: North America Toxicology Drug Screening Market Volume Share (%), by Testing Type 2024 & 2032
- Figure 27: North America Toxicology Drug Screening Market Revenue (Million), by Product 2024 & 2032
- Figure 28: North America Toxicology Drug Screening Market Volume (K Unit), by Product 2024 & 2032
- Figure 29: North America Toxicology Drug Screening Market Revenue Share (%), by Product 2024 & 2032
- Figure 30: North America Toxicology Drug Screening Market Volume Share (%), by Product 2024 & 2032
- Figure 31: North America Toxicology Drug Screening Market Revenue (Million), by Application 2024 & 2032
- Figure 32: North America Toxicology Drug Screening Market Volume (K Unit), by Application 2024 & 2032
- Figure 33: North America Toxicology Drug Screening Market Revenue Share (%), by Application 2024 & 2032
- Figure 34: North America Toxicology Drug Screening Market Volume Share (%), by Application 2024 & 2032
- Figure 35: North America Toxicology Drug Screening Market Revenue (Million), by Country 2024 & 2032
- Figure 36: North America Toxicology Drug Screening Market Volume (K Unit), by Country 2024 & 2032
- Figure 37: North America Toxicology Drug Screening Market Revenue Share (%), by Country 2024 & 2032
- Figure 38: North America Toxicology Drug Screening Market Volume Share (%), by Country 2024 & 2032
- Figure 39: Europe Toxicology Drug Screening Market Revenue (Million), by Testing Type 2024 & 2032
- Figure 40: Europe Toxicology Drug Screening Market Volume (K Unit), by Testing Type 2024 & 2032
- Figure 41: Europe Toxicology Drug Screening Market Revenue Share (%), by Testing Type 2024 & 2032
- Figure 42: Europe Toxicology Drug Screening Market Volume Share (%), by Testing Type 2024 & 2032
- Figure 43: Europe Toxicology Drug Screening Market Revenue (Million), by Product 2024 & 2032
- Figure 44: Europe Toxicology Drug Screening Market Volume (K Unit), by Product 2024 & 2032
- Figure 45: Europe Toxicology Drug Screening Market Revenue Share (%), by Product 2024 & 2032
- Figure 46: Europe Toxicology Drug Screening Market Volume Share (%), by Product 2024 & 2032
- Figure 47: Europe Toxicology Drug Screening Market Revenue (Million), by Application 2024 & 2032
- Figure 48: Europe Toxicology Drug Screening Market Volume (K Unit), by Application 2024 & 2032
- Figure 49: Europe Toxicology Drug Screening Market Revenue Share (%), by Application 2024 & 2032
- Figure 50: Europe Toxicology Drug Screening Market Volume Share (%), by Application 2024 & 2032
- Figure 51: Europe Toxicology Drug Screening Market Revenue (Million), by Country 2024 & 2032
- Figure 52: Europe Toxicology Drug Screening Market Volume (K Unit), by Country 2024 & 2032
- Figure 53: Europe Toxicology Drug Screening Market Revenue Share (%), by Country 2024 & 2032
- Figure 54: Europe Toxicology Drug Screening Market Volume Share (%), by Country 2024 & 2032
- Figure 55: Asia Pacific Toxicology Drug Screening Market Revenue (Million), by Testing Type 2024 & 2032
- Figure 56: Asia Pacific Toxicology Drug Screening Market Volume (K Unit), by Testing Type 2024 & 2032
- Figure 57: Asia Pacific Toxicology Drug Screening Market Revenue Share (%), by Testing Type 2024 & 2032
- Figure 58: Asia Pacific Toxicology Drug Screening Market Volume Share (%), by Testing Type 2024 & 2032
- Figure 59: Asia Pacific Toxicology Drug Screening Market Revenue (Million), by Product 2024 & 2032
- Figure 60: Asia Pacific Toxicology Drug Screening Market Volume (K Unit), by Product 2024 & 2032
- Figure 61: Asia Pacific Toxicology Drug Screening Market Revenue Share (%), by Product 2024 & 2032
- Figure 62: Asia Pacific Toxicology Drug Screening Market Volume Share (%), by Product 2024 & 2032
- Figure 63: Asia Pacific Toxicology Drug Screening Market Revenue (Million), by Application 2024 & 2032
- Figure 64: Asia Pacific Toxicology Drug Screening Market Volume (K Unit), by Application 2024 & 2032
- Figure 65: Asia Pacific Toxicology Drug Screening Market Revenue Share (%), by Application 2024 & 2032
- Figure 66: Asia Pacific Toxicology Drug Screening Market Volume Share (%), by Application 2024 & 2032
- Figure 67: Asia Pacific Toxicology Drug Screening Market Revenue (Million), by Country 2024 & 2032
- Figure 68: Asia Pacific Toxicology Drug Screening Market Volume (K Unit), by Country 2024 & 2032
- Figure 69: Asia Pacific Toxicology Drug Screening Market Revenue Share (%), by Country 2024 & 2032
- Figure 70: Asia Pacific Toxicology Drug Screening Market Volume Share (%), by Country 2024 & 2032
- Figure 71: Middle East and Africa Toxicology Drug Screening Market Revenue (Million), by Testing Type 2024 & 2032
- Figure 72: Middle East and Africa Toxicology Drug Screening Market Volume (K Unit), by Testing Type 2024 & 2032
- Figure 73: Middle East and Africa Toxicology Drug Screening Market Revenue Share (%), by Testing Type 2024 & 2032
- Figure 74: Middle East and Africa Toxicology Drug Screening Market Volume Share (%), by Testing Type 2024 & 2032
- Figure 75: Middle East and Africa Toxicology Drug Screening Market Revenue (Million), by Product 2024 & 2032
- Figure 76: Middle East and Africa Toxicology Drug Screening Market Volume (K Unit), by Product 2024 & 2032
- Figure 77: Middle East and Africa Toxicology Drug Screening Market Revenue Share (%), by Product 2024 & 2032
- Figure 78: Middle East and Africa Toxicology Drug Screening Market Volume Share (%), by Product 2024 & 2032
- Figure 79: Middle East and Africa Toxicology Drug Screening Market Revenue (Million), by Application 2024 & 2032
- Figure 80: Middle East and Africa Toxicology Drug Screening Market Volume (K Unit), by Application 2024 & 2032
- Figure 81: Middle East and Africa Toxicology Drug Screening Market Revenue Share (%), by Application 2024 & 2032
- Figure 82: Middle East and Africa Toxicology Drug Screening Market Volume Share (%), by Application 2024 & 2032
- Figure 83: Middle East and Africa Toxicology Drug Screening Market Revenue (Million), by Country 2024 & 2032
- Figure 84: Middle East and Africa Toxicology Drug Screening Market Volume (K Unit), by Country 2024 & 2032
- Figure 85: Middle East and Africa Toxicology Drug Screening Market Revenue Share (%), by Country 2024 & 2032
- Figure 86: Middle East and Africa Toxicology Drug Screening Market Volume Share (%), by Country 2024 & 2032
- Figure 87: South America Toxicology Drug Screening Market Revenue (Million), by Testing Type 2024 & 2032
- Figure 88: South America Toxicology Drug Screening Market Volume (K Unit), by Testing Type 2024 & 2032
- Figure 89: South America Toxicology Drug Screening Market Revenue Share (%), by Testing Type 2024 & 2032
- Figure 90: South America Toxicology Drug Screening Market Volume Share (%), by Testing Type 2024 & 2032
- Figure 91: South America Toxicology Drug Screening Market Revenue (Million), by Product 2024 & 2032
- Figure 92: South America Toxicology Drug Screening Market Volume (K Unit), by Product 2024 & 2032
- Figure 93: South America Toxicology Drug Screening Market Revenue Share (%), by Product 2024 & 2032
- Figure 94: South America Toxicology Drug Screening Market Volume Share (%), by Product 2024 & 2032
- Figure 95: South America Toxicology Drug Screening Market Revenue (Million), by Application 2024 & 2032
- Figure 96: South America Toxicology Drug Screening Market Volume (K Unit), by Application 2024 & 2032
- Figure 97: South America Toxicology Drug Screening Market Revenue Share (%), by Application 2024 & 2032
- Figure 98: South America Toxicology Drug Screening Market Volume Share (%), by Application 2024 & 2032
- Figure 99: South America Toxicology Drug Screening Market Revenue (Million), by Country 2024 & 2032
- Figure 100: South America Toxicology Drug Screening Market Volume (K Unit), by Country 2024 & 2032
- Figure 101: South America Toxicology Drug Screening Market Revenue Share (%), by Country 2024 & 2032
- Figure 102: South America Toxicology Drug Screening Market Volume Share (%), by Country 2024 & 2032
List of Tables
- Table 1: Global Toxicology Drug Screening Market Revenue Million Forecast, by Region 2019 & 2032
- Table 2: Global Toxicology Drug Screening Market Volume K Unit Forecast, by Region 2019 & 2032
- Table 3: Global Toxicology Drug Screening Market Revenue Million Forecast, by Testing Type 2019 & 2032
- Table 4: Global Toxicology Drug Screening Market Volume K Unit Forecast, by Testing Type 2019 & 2032
- Table 5: Global Toxicology Drug Screening Market Revenue Million Forecast, by Product 2019 & 2032
- Table 6: Global Toxicology Drug Screening Market Volume K Unit Forecast, by Product 2019 & 2032
- Table 7: Global Toxicology Drug Screening Market Revenue Million Forecast, by Application 2019 & 2032
- Table 8: Global Toxicology Drug Screening Market Volume K Unit Forecast, by Application 2019 & 2032
- Table 9: Global Toxicology Drug Screening Market Revenue Million Forecast, by Region 2019 & 2032
- Table 10: Global Toxicology Drug Screening Market Volume K Unit Forecast, by Region 2019 & 2032
- Table 11: Global Toxicology Drug Screening Market Revenue Million Forecast, by Country 2019 & 2032
- Table 12: Global Toxicology Drug Screening Market Volume K Unit Forecast, by Country 2019 & 2032
- Table 13: United States Toxicology Drug Screening Market Revenue (Million) Forecast, by Application 2019 & 2032
- Table 14: United States Toxicology Drug Screening Market Volume (K Unit) Forecast, by Application 2019 & 2032
- Table 15: Canada Toxicology Drug Screening Market Revenue (Million) Forecast, by Application 2019 & 2032
- Table 16: Canada Toxicology Drug Screening Market Volume (K Unit) Forecast, by Application 2019 & 2032
- Table 17: Mexico Toxicology Drug Screening Market Revenue (Million) Forecast, by Application 2019 & 2032
- Table 18: Mexico Toxicology Drug Screening Market Volume (K Unit) Forecast, by Application 2019 & 2032
- Table 19: Global Toxicology Drug Screening Market Revenue Million Forecast, by Country 2019 & 2032
- Table 20: Global Toxicology Drug Screening Market Volume K Unit Forecast, by Country 2019 & 2032
- Table 21: Germany Toxicology Drug Screening Market Revenue (Million) Forecast, by Application 2019 & 2032
- Table 22: Germany Toxicology Drug Screening Market Volume (K Unit) Forecast, by Application 2019 & 2032
- Table 23: United Kingdom Toxicology Drug Screening Market Revenue (Million) Forecast, by Application 2019 & 2032
- Table 24: United Kingdom Toxicology Drug Screening Market Volume (K Unit) Forecast, by Application 2019 & 2032
- Table 25: France Toxicology Drug Screening Market Revenue (Million) Forecast, by Application 2019 & 2032
- Table 26: France Toxicology Drug Screening Market Volume (K Unit) Forecast, by Application 2019 & 2032
- Table 27: Italy Toxicology Drug Screening Market Revenue (Million) Forecast, by Application 2019 & 2032
- Table 28: Italy Toxicology Drug Screening Market Volume (K Unit) Forecast, by Application 2019 & 2032
- Table 29: Spain Toxicology Drug Screening Market Revenue (Million) Forecast, by Application 2019 & 2032
- Table 30: Spain Toxicology Drug Screening Market Volume (K Unit) Forecast, by Application 2019 & 2032
- Table 31: Rest of Europe Toxicology Drug Screening Market Revenue (Million) Forecast, by Application 2019 & 2032
- Table 32: Rest of Europe Toxicology Drug Screening Market Volume (K Unit) Forecast, by Application 2019 & 2032
- Table 33: Global Toxicology Drug Screening Market Revenue Million Forecast, by Country 2019 & 2032
- Table 34: Global Toxicology Drug Screening Market Volume K Unit Forecast, by Country 2019 & 2032
- Table 35: China Toxicology Drug Screening Market Revenue (Million) Forecast, by Application 2019 & 2032
- Table 36: China Toxicology Drug Screening Market Volume (K Unit) Forecast, by Application 2019 & 2032
- Table 37: Japan Toxicology Drug Screening Market Revenue (Million) Forecast, by Application 2019 & 2032
- Table 38: Japan Toxicology Drug Screening Market Volume (K Unit) Forecast, by Application 2019 & 2032
- Table 39: India Toxicology Drug Screening Market Revenue (Million) Forecast, by Application 2019 & 2032
- Table 40: India Toxicology Drug Screening Market Volume (K Unit) Forecast, by Application 2019 & 2032
- Table 41: Australia Toxicology Drug Screening Market Revenue (Million) Forecast, by Application 2019 & 2032
- Table 42: Australia Toxicology Drug Screening Market Volume (K Unit) Forecast, by Application 2019 & 2032
- Table 43: South Korea Toxicology Drug Screening Market Revenue (Million) Forecast, by Application 2019 & 2032
- Table 44: South Korea Toxicology Drug Screening Market Volume (K Unit) Forecast, by Application 2019 & 2032
- Table 45: Rest of Asia Pacific Toxicology Drug Screening Market Revenue (Million) Forecast, by Application 2019 & 2032
- Table 46: Rest of Asia Pacific Toxicology Drug Screening Market Volume (K Unit) Forecast, by Application 2019 & 2032
- Table 47: Global Toxicology Drug Screening Market Revenue Million Forecast, by Country 2019 & 2032
- Table 48: Global Toxicology Drug Screening Market Volume K Unit Forecast, by Country 2019 & 2032
- Table 49: GCC Toxicology Drug Screening Market Revenue (Million) Forecast, by Application 2019 & 2032
- Table 50: GCC Toxicology Drug Screening Market Volume (K Unit) Forecast, by Application 2019 & 2032
- Table 51: South Africa Toxicology Drug Screening Market Revenue (Million) Forecast, by Application 2019 & 2032
- Table 52: South Africa Toxicology Drug Screening Market Volume (K Unit) Forecast, by Application 2019 & 2032
- Table 53: Rest of Middle East and Africa Toxicology Drug Screening Market Revenue (Million) Forecast, by Application 2019 & 2032
- Table 54: Rest of Middle East and Africa Toxicology Drug Screening Market Volume (K Unit) Forecast, by Application 2019 & 2032
- Table 55: Global Toxicology Drug Screening Market Revenue Million Forecast, by Country 2019 & 2032
- Table 56: Global Toxicology Drug Screening Market Volume K Unit Forecast, by Country 2019 & 2032
- Table 57: Brazil Toxicology Drug Screening Market Revenue (Million) Forecast, by Application 2019 & 2032
- Table 58: Brazil Toxicology Drug Screening Market Volume (K Unit) Forecast, by Application 2019 & 2032
- Table 59: Argentina Toxicology Drug Screening Market Revenue (Million) Forecast, by Application 2019 & 2032
- Table 60: Argentina Toxicology Drug Screening Market Volume (K Unit) Forecast, by Application 2019 & 2032
- Table 61: Rest of South America Toxicology Drug Screening Market Revenue (Million) Forecast, by Application 2019 & 2032
- Table 62: Rest of South America Toxicology Drug Screening Market Volume (K Unit) Forecast, by Application 2019 & 2032
- Table 63: Global Toxicology Drug Screening Market Revenue Million Forecast, by Testing Type 2019 & 2032
- Table 64: Global Toxicology Drug Screening Market Volume K Unit Forecast, by Testing Type 2019 & 2032
- Table 65: Global Toxicology Drug Screening Market Revenue Million Forecast, by Product 2019 & 2032
- Table 66: Global Toxicology Drug Screening Market Volume K Unit Forecast, by Product 2019 & 2032
- Table 67: Global Toxicology Drug Screening Market Revenue Million Forecast, by Application 2019 & 2032
- Table 68: Global Toxicology Drug Screening Market Volume K Unit Forecast, by Application 2019 & 2032
- Table 69: Global Toxicology Drug Screening Market Revenue Million Forecast, by Country 2019 & 2032
- Table 70: Global Toxicology Drug Screening Market Volume K Unit Forecast, by Country 2019 & 2032
- Table 71: United States Toxicology Drug Screening Market Revenue (Million) Forecast, by Application 2019 & 2032
- Table 72: United States Toxicology Drug Screening Market Volume (K Unit) Forecast, by Application 2019 & 2032
- Table 73: Canada Toxicology Drug Screening Market Revenue (Million) Forecast, by Application 2019 & 2032
- Table 74: Canada Toxicology Drug Screening Market Volume (K Unit) Forecast, by Application 2019 & 2032
- Table 75: Mexico Toxicology Drug Screening Market Revenue (Million) Forecast, by Application 2019 & 2032
- Table 76: Mexico Toxicology Drug Screening Market Volume (K Unit) Forecast, by Application 2019 & 2032
- Table 77: Global Toxicology Drug Screening Market Revenue Million Forecast, by Testing Type 2019 & 2032
- Table 78: Global Toxicology Drug Screening Market Volume K Unit Forecast, by Testing Type 2019 & 2032
- Table 79: Global Toxicology Drug Screening Market Revenue Million Forecast, by Product 2019 & 2032
- Table 80: Global Toxicology Drug Screening Market Volume K Unit Forecast, by Product 2019 & 2032
- Table 81: Global Toxicology Drug Screening Market Revenue Million Forecast, by Application 2019 & 2032
- Table 82: Global Toxicology Drug Screening Market Volume K Unit Forecast, by Application 2019 & 2032
- Table 83: Global Toxicology Drug Screening Market Revenue Million Forecast, by Country 2019 & 2032
- Table 84: Global Toxicology Drug Screening Market Volume K Unit Forecast, by Country 2019 & 2032
- Table 85: Germany Toxicology Drug Screening Market Revenue (Million) Forecast, by Application 2019 & 2032
- Table 86: Germany Toxicology Drug Screening Market Volume (K Unit) Forecast, by Application 2019 & 2032
- Table 87: United Kingdom Toxicology Drug Screening Market Revenue (Million) Forecast, by Application 2019 & 2032
- Table 88: United Kingdom Toxicology Drug Screening Market Volume (K Unit) Forecast, by Application 2019 & 2032
- Table 89: France Toxicology Drug Screening Market Revenue (Million) Forecast, by Application 2019 & 2032
- Table 90: France Toxicology Drug Screening Market Volume (K Unit) Forecast, by Application 2019 & 2032
- Table 91: Italy Toxicology Drug Screening Market Revenue (Million) Forecast, by Application 2019 & 2032
- Table 92: Italy Toxicology Drug Screening Market Volume (K Unit) Forecast, by Application 2019 & 2032
- Table 93: Spain Toxicology Drug Screening Market Revenue (Million) Forecast, by Application 2019 & 2032
- Table 94: Spain Toxicology Drug Screening Market Volume (K Unit) Forecast, by Application 2019 & 2032
- Table 95: Rest of Europe Toxicology Drug Screening Market Revenue (Million) Forecast, by Application 2019 & 2032
- Table 96: Rest of Europe Toxicology Drug Screening Market Volume (K Unit) Forecast, by Application 2019 & 2032
- Table 97: Global Toxicology Drug Screening Market Revenue Million Forecast, by Testing Type 2019 & 2032
- Table 98: Global Toxicology Drug Screening Market Volume K Unit Forecast, by Testing Type 2019 & 2032
- Table 99: Global Toxicology Drug Screening Market Revenue Million Forecast, by Product 2019 & 2032
- Table 100: Global Toxicology Drug Screening Market Volume K Unit Forecast, by Product 2019 & 2032
- Table 101: Global Toxicology Drug Screening Market Revenue Million Forecast, by Application 2019 & 2032
- Table 102: Global Toxicology Drug Screening Market Volume K Unit Forecast, by Application 2019 & 2032
- Table 103: Global Toxicology Drug Screening Market Revenue Million Forecast, by Country 2019 & 2032
- Table 104: Global Toxicology Drug Screening Market Volume K Unit Forecast, by Country 2019 & 2032
- Table 105: China Toxicology Drug Screening Market Revenue (Million) Forecast, by Application 2019 & 2032
- Table 106: China Toxicology Drug Screening Market Volume (K Unit) Forecast, by Application 2019 & 2032
- Table 107: Japan Toxicology Drug Screening Market Revenue (Million) Forecast, by Application 2019 & 2032
- Table 108: Japan Toxicology Drug Screening Market Volume (K Unit) Forecast, by Application 2019 & 2032
- Table 109: India Toxicology Drug Screening Market Revenue (Million) Forecast, by Application 2019 & 2032
- Table 110: India Toxicology Drug Screening Market Volume (K Unit) Forecast, by Application 2019 & 2032
- Table 111: Australia Toxicology Drug Screening Market Revenue (Million) Forecast, by Application 2019 & 2032
- Table 112: Australia Toxicology Drug Screening Market Volume (K Unit) Forecast, by Application 2019 & 2032
- Table 113: South Korea Toxicology Drug Screening Market Revenue (Million) Forecast, by Application 2019 & 2032
- Table 114: South Korea Toxicology Drug Screening Market Volume (K Unit) Forecast, by Application 2019 & 2032
- Table 115: Rest of Asia Pacific Toxicology Drug Screening Market Revenue (Million) Forecast, by Application 2019 & 2032
- Table 116: Rest of Asia Pacific Toxicology Drug Screening Market Volume (K Unit) Forecast, by Application 2019 & 2032
- Table 117: Global Toxicology Drug Screening Market Revenue Million Forecast, by Testing Type 2019 & 2032
- Table 118: Global Toxicology Drug Screening Market Volume K Unit Forecast, by Testing Type 2019 & 2032
- Table 119: Global Toxicology Drug Screening Market Revenue Million Forecast, by Product 2019 & 2032
- Table 120: Global Toxicology Drug Screening Market Volume K Unit Forecast, by Product 2019 & 2032
- Table 121: Global Toxicology Drug Screening Market Revenue Million Forecast, by Application 2019 & 2032
- Table 122: Global Toxicology Drug Screening Market Volume K Unit Forecast, by Application 2019 & 2032
- Table 123: Global Toxicology Drug Screening Market Revenue Million Forecast, by Country 2019 & 2032
- Table 124: Global Toxicology Drug Screening Market Volume K Unit Forecast, by Country 2019 & 2032
- Table 125: GCC Toxicology Drug Screening Market Revenue (Million) Forecast, by Application 2019 & 2032
- Table 126: GCC Toxicology Drug Screening Market Volume (K Unit) Forecast, by Application 2019 & 2032
- Table 127: South Africa Toxicology Drug Screening Market Revenue (Million) Forecast, by Application 2019 & 2032
- Table 128: South Africa Toxicology Drug Screening Market Volume (K Unit) Forecast, by Application 2019 & 2032
- Table 129: Rest of Middle East and Africa Toxicology Drug Screening Market Revenue (Million) Forecast, by Application 2019 & 2032
- Table 130: Rest of Middle East and Africa Toxicology Drug Screening Market Volume (K Unit) Forecast, by Application 2019 & 2032
- Table 131: Global Toxicology Drug Screening Market Revenue Million Forecast, by Testing Type 2019 & 2032
- Table 132: Global Toxicology Drug Screening Market Volume K Unit Forecast, by Testing Type 2019 & 2032
- Table 133: Global Toxicology Drug Screening Market Revenue Million Forecast, by Product 2019 & 2032
- Table 134: Global Toxicology Drug Screening Market Volume K Unit Forecast, by Product 2019 & 2032
- Table 135: Global Toxicology Drug Screening Market Revenue Million Forecast, by Application 2019 & 2032
- Table 136: Global Toxicology Drug Screening Market Volume K Unit Forecast, by Application 2019 & 2032
- Table 137: Global Toxicology Drug Screening Market Revenue Million Forecast, by Country 2019 & 2032
- Table 138: Global Toxicology Drug Screening Market Volume K Unit Forecast, by Country 2019 & 2032
- Table 139: Brazil Toxicology Drug Screening Market Revenue (Million) Forecast, by Application 2019 & 2032
- Table 140: Brazil Toxicology Drug Screening Market Volume (K Unit) Forecast, by Application 2019 & 2032
- Table 141: Argentina Toxicology Drug Screening Market Revenue (Million) Forecast, by Application 2019 & 2032
- Table 142: Argentina Toxicology Drug Screening Market Volume (K Unit) Forecast, by Application 2019 & 2032
- Table 143: Rest of South America Toxicology Drug Screening Market Revenue (Million) Forecast, by Application 2019 & 2032
- Table 144: Rest of South America Toxicology Drug Screening Market Volume (K Unit) Forecast, by Application 2019 & 2032
Frequently Asked Questions
1. What is the projected Compound Annual Growth Rate (CAGR) of the Toxicology Drug Screening Market?
The projected CAGR is approximately 8.77%.
2. Which companies are prominent players in the Toxicology Drug Screening Market?
Key companies in the market include Laboratory Corporation of America Holdings, The Jackson Laboratory, Promega Corporation, Bio-Rad Laboratories Inc, Eurofins Scientific, Charles River Laboratories International Inc, Thermo Fisher Scientific Inc, Agilent Technologies Inc, Enzo Life Sciences Inc, BioReliance Inc (Merck), Danaher, Wuxi AppTec.
3. What are the main segments of the Toxicology Drug Screening Market?
The market segments include Testing Type, Product, Application.
4. Can you provide details about the market size?
The market size is estimated to be USD 14.51 Million as of 2022.
5. What are some drivers contributing to market growth?
Increasing R&D Activities; Technological Advancements in Toxicology Drug Screening; Rise in Demand for Toxicology Drug Screening in Pharmaceuticals and Biotechnology.
6. What are the notable trends driving market growth?
In Silico Segment is Expected to Witness Significant Growth Over the Forecast Period.
7. Are there any restraints impacting market growth?
Longer Time for Sample Testing; Regulatory Issues Regarding Approval of Healthcare Molecule.
8. Can you provide examples of recent developments in the market?
November 2022: Instem, a provider of information and technology (IT) solutions and services to the global life sciences market, updated its Computational Toxicology Software Suite solution. The 2022 software update allows its clients to access more than 600,000 toxicology studies for more than 200,000 chemicals, enabling fast, accurate, defendable, and regulatory-accepted predictions.
9. What pricing options are available for accessing the report?
Pricing options include single-user, multi-user, and enterprise licenses priced at USD 4750, USD 5250, and USD 8750 respectively.
10. Is the market size provided in terms of value or volume?
The market size is provided in terms of value, measured in Million and volume, measured in K Unit.
11. Are there any specific market keywords associated with the report?
Yes, the market keyword associated with the report is "Toxicology Drug Screening Market," which aids in identifying and referencing the specific market segment covered.
12. How do I determine which pricing option suits my needs best?
The pricing options vary based on user requirements and access needs. Individual users may opt for single-user licenses, while businesses requiring broader access may choose multi-user or enterprise licenses for cost-effective access to the report.
13. Are there any additional resources or data provided in the Toxicology Drug Screening Market report?
While the report offers comprehensive insights, it's advisable to review the specific contents or supplementary materials provided to ascertain if additional resources or data are available.
14. How can I stay updated on further developments or reports in the Toxicology Drug Screening Market?
To stay informed about further developments, trends, and reports in the Toxicology Drug Screening Market, consider subscribing to industry newsletters, following relevant companies and organizations, or regularly checking reputable industry news sources and publications.
Methodology
Step 1 - Identification of Relevant Samples Size from Population Database


Step 2 - Approaches for Defining Global Market Size (Value, Volume* & Price*)

Note*: In applicable scenarios
Step 3 - Data Sources
Primary Research
- Web Analytics
- Survey Reports
- Research Institute
- Latest Research Reports
- Opinion Leaders
Secondary Research
- Annual Reports
- White Paper
- Latest Press Release
- Industry Association
- Paid Database
- Investor Presentations

Step 4 - Data Triangulation
Involves using different sources of information in order to increase the validity of a study
These sources are likely to be stakeholders in a program - participants, other researchers, program staff, other community members, and so on.
Then we put all data in single framework & apply various statistical tools to find out the dynamic on the market.
During the analysis stage, feedback from the stakeholder groups would be compared to determine areas of agreement as well as areas of divergence


