
Key Insights
The Asia-Pacific (APAC) sports drink market is experiencing robust growth, driven by increasing health consciousness, rising disposable incomes, and a burgeoning fitness culture across the region. The market's diverse product portfolio, encompassing electrolyte-enhanced water, isotonic, hypotonic, and hypertonic drinks, along with protein-based options, caters to a wide range of consumer needs and preferences. The significant market penetration of convenient packaging formats like PET bottles and aseptic packages further fuels market expansion. Key growth drivers include the rising popularity of various sports and fitness activities, coupled with increased awareness of hydration and electrolyte replenishment. While the market exhibits strong potential, challenges such as fluctuating raw material prices and stringent regulations surrounding food and beverage safety could impact growth trajectory. China, India, and other rapidly developing economies within APAC represent significant untapped markets, offering immense growth opportunities for both established players and emerging brands. The competitive landscape is dynamic, with both international giants and regional players vying for market share. Strategic partnerships, product innovation, and targeted marketing campaigns are crucial for success in this increasingly competitive environment.
The forecast period of 2025-2033 is projected to witness considerable expansion, fuelled by increasing consumer preference for healthier and functional beverages. Countries like Australia, Japan, and South Korea showcase mature markets with high per capita consumption, while emerging markets like Vietnam and Indonesia offer considerable growth potential. The shift towards premium and functional sports drinks, incorporating natural ingredients and enhanced nutritional value, is expected to gain traction. Moreover, the rise of e-commerce platforms is creating new avenues for distribution and reaching wider consumer segments. Sustained growth will likely depend on adapting to evolving consumer preferences, maintaining product quality and safety standards, and successfully navigating the complex regulatory landscape across diverse APAC markets. A strategic focus on sustainable practices and environmentally friendly packaging is also becoming increasingly important for consumer acceptance and brand loyalty.
Sports Drink Market in APAC: A Comprehensive Market Report (2019-2033)
This in-depth report provides a comprehensive analysis of the Sports Drink Market in the Asia-Pacific (APAC) region, covering the period 2019-2033. It delves into market dynamics, growth trends, dominant segments, key players, and emerging opportunities, offering valuable insights for industry professionals, investors, and strategists. The report uses 2025 as the base year and forecasts market trends until 2033. Market values are presented in million units.
Sports Drink Market in APAC Market Dynamics & Structure
The APAC sports drink market is characterized by high growth potential, driven by increasing health consciousness, rising disposable incomes, and a burgeoning fitness culture. However, intense competition, diverse consumer preferences, and regulatory changes shape the market structure. Market concentration is moderate, with a mix of multinational giants and regional players. Technological innovation, particularly in product formulations and packaging, is a key driver, while stringent regulations concerning sugar content and labeling influence product development. The market witnesses significant M&A activity, with larger companies acquiring smaller brands to expand their market share.
- Market Concentration: Moderate, with both global and regional players vying for market share. The top 5 players hold approximately xx% of the market share (2024).
- Technological Innovation: Focus on functional ingredients (e.g., electrolytes, vitamins), sustainable packaging (e.g., recycled PET bottles), and innovative flavors.
- Regulatory Framework: Varying regulations across countries on sugar content, labeling, and marketing impact product formulation and pricing strategies.
- Competitive Product Substitutes: Bottled water, fruit juices, and energy drinks pose competitive challenges.
- End-User Demographics: Growing youth population and rising middle class are key drivers of market growth. Increasing participation in sports and fitness activities fuels demand.
- M&A Trends: Consolidation is observed, with larger companies strategically acquiring smaller, specialized brands to broaden their product portfolios and expand their reach. The number of M&A deals in the last 5 years was approximately xx.
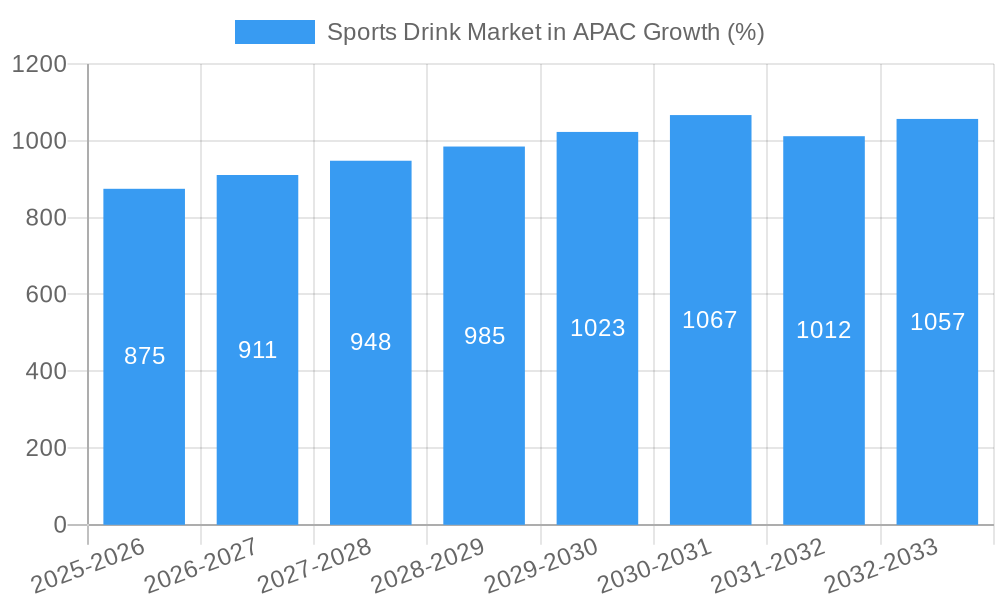
Sports Drink Market in APAC Growth Trends & Insights
The APAC sports drink market experienced robust growth during the historical period (2019-2024), with a CAGR of xx%. This growth is attributed to multiple factors, including rising health awareness, increasing participation in sports and fitness activities, and the expanding middle class with higher disposable incomes. Technological advancements, such as the development of functional sports drinks with enhanced electrolyte formulations and innovative packaging, further fueled market expansion. Consumer preferences are shifting toward healthier, low-sugar, and functional options. The market is expected to continue its growth trajectory during the forecast period (2025-2033), driven by evolving consumer needs and further product innovation. Market penetration is currently at xx% and is projected to reach xx% by 2033.
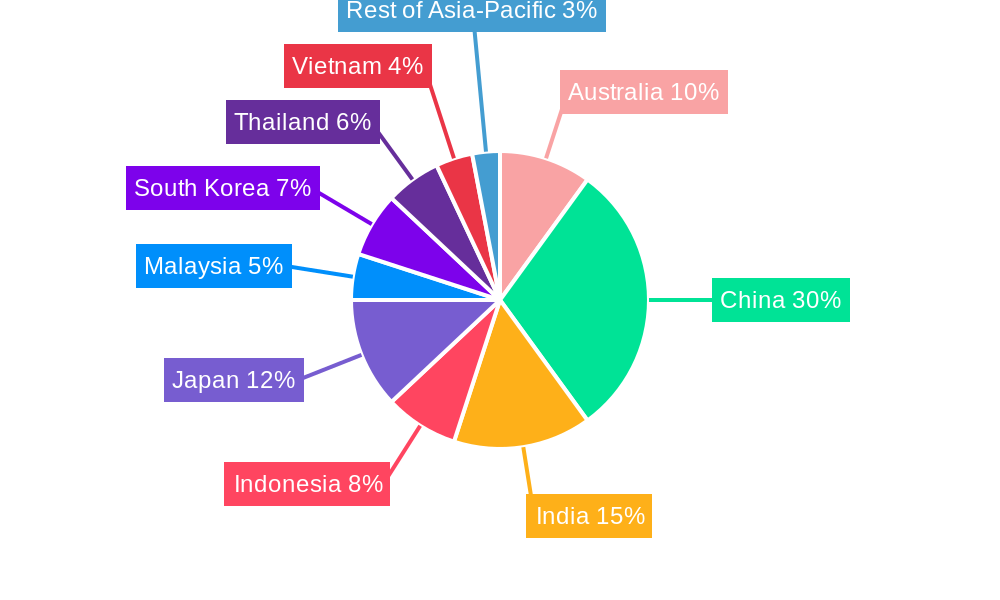
Dominant Regions, Countries, or Segments in Sports Drink Market in APAC
China and India are the dominant countries in the APAC sports drink market, contributing to the majority of the total market value. Within product segments, Isotonic drinks hold the largest market share due to their widespread appeal and suitability for a broad range of consumers. PET bottles dominate the packaging segment due to convenience, cost-effectiveness, and recyclability. Supermarket/hypermarkets are the leading distribution channel, followed by convenience stores.
- Key Drivers for China and India:
- Rising Disposable Incomes: Increased purchasing power enables consumers to afford premium sports drinks.
- Growing Health Consciousness: Growing awareness of the importance of hydration and electrolyte replenishment drives demand.
- Expanding Fitness Culture: Increased participation in sports and fitness activities fuels consumption.
- Favorable Government Policies: Supportive government initiatives promoting healthy lifestyles positively impact market growth.
- Market Share & Growth Potential: China holds approximately xx% market share, while India holds approximately xx%. Both countries exhibit significant growth potential driven by factors mentioned above.
Sports Drink Market in APAC Product Landscape
The APAC sports drink market showcases a diverse range of products, categorized by type (electrolyte-enhanced water, hypertonic, hypotonic, isotonic, protein-based) and packaging (aseptic packages, metal cans, PET bottles). Recent innovations focus on natural flavors, functional ingredients (e.g., added vitamins and minerals), and sustainable packaging. Unique selling propositions include improved hydration, enhanced performance benefits, and tailored formulations for specific sports or activities. Technological advancements focus on optimizing electrolyte balance, improving taste profiles, and enhancing shelf life.
Key Drivers, Barriers & Challenges in Sports Drink Market in APAC
Key Drivers:
- Increasing health awareness and fitness trends.
- Growing disposable incomes in emerging economies.
- Product innovation and diversification.
- Rising popularity of e-commerce channels.
Challenges:
- Intense competition from established and emerging brands.
- Stringent regulations regarding sugar content and labeling.
- Fluctuations in raw material costs.
- Potential supply chain disruptions.
Emerging Opportunities in Sports Drink Market in APAC
- Expanding into untapped markets within APAC (e.g., rural areas).
- Developing niche products targeting specific sports or activities.
- Focus on functional sports drinks with added health benefits.
- Leveraging e-commerce channels and digital marketing.
Growth Accelerators in the Sports Drink Market in APAC Industry
Strategic partnerships, technological advancements, and expansions into new geographical regions are key accelerators driving long-term growth. Developments in functional ingredients, sustainable packaging solutions, and targeted marketing campaigns are further fueling market expansion. The increasing penetration of e-commerce and growing consumer demand for convenient and healthy options are expected to contribute significantly to future market growth.
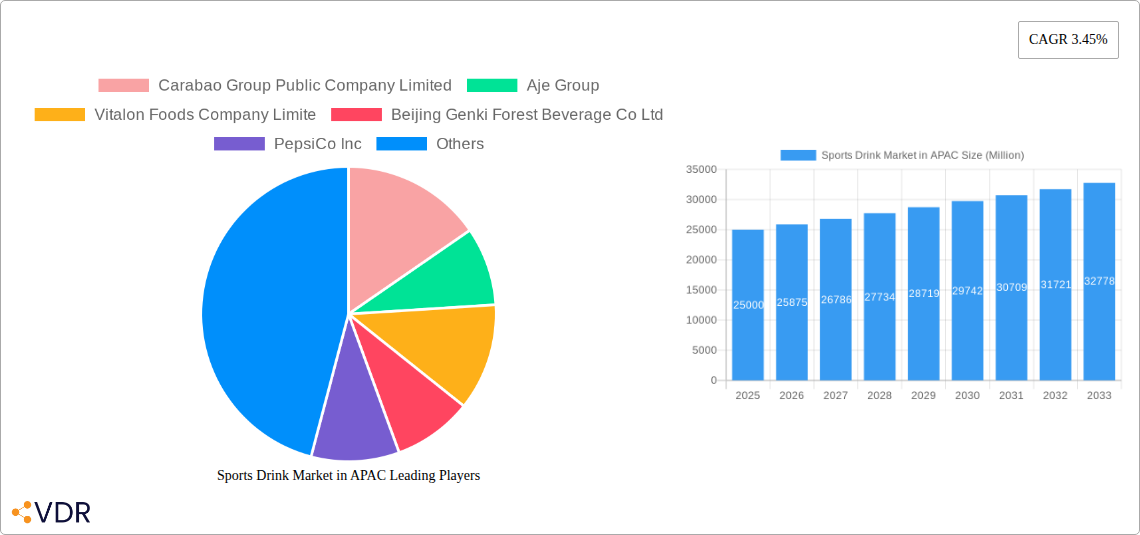
Key Players Shaping the Sports Drink Market in APAC Market
- Carabao Group Public Company Limited
- Aje Group
- Vitalon Foods Company Limite
- Beijing Genki Forest Beverage Co Ltd
- PepsiCo Inc
- Nongfu Spring Co Ltd
- Suntory Holdings Limited
- Steric Pty Ltd
- Danone S A
- The Coca-Cola Company
- Guangdong Jianlibao Group
- Thai Beverages PCL
- Otsuka Holdings Co Ltd
- Sapporo Holdings Limited
Notable Milestones in Sports Drink Market in APAC Sector
- September 2023: Launch of Limca Sportz ION4 in India by Coca-Cola India.
- June 2023: Danone China launches a grapefruit-flavored electrolyte drink.
- August 2022: Coca-Cola India launches Limca Sportz, its first sports drink.
In-Depth Sports Drink Market in APAC Market Outlook
The APAC sports drink market is poised for sustained growth, driven by the converging forces of rising health consciousness, increasing disposable incomes, and continuous product innovation. Strategic partnerships, targeted marketing campaigns, and expansion into new markets present lucrative opportunities for both established and emerging players. The focus on healthy, functional, and sustainably packaged products will be a critical factor in shaping the market's future trajectory.
Sports Drink Market in APAC Segmentation
-
1. Soft Drink Type
- 1.1. Electrolyte-Enhanced Water
- 1.2. Hypertonic
- 1.3. Hypotonic
- 1.4. Isotonic
- 1.5. Protein-based Sport Drinks
-
2. Packaging Type
- 2.1. Aseptic packages
- 2.2. Metal Can
- 2.3. PET Bottles
-
3. Sub Distribution Channel
- 3.1. Convenience Stores
- 3.2. Online Retail
- 3.3. Specialty Stores
- 3.4. Supermarket/Hypermarket
- 3.5. Others
Sports Drink Market in APAC Segmentation By Geography
-
1. North America
- 1.1. United States
- 1.2. Canada
- 1.3. Mexico
-
2. South America
- 2.1. Brazil
- 2.2. Argentina
- 2.3. Rest of South America
-
3. Europe
- 3.1. United Kingdom
- 3.2. Germany
- 3.3. France
- 3.4. Italy
- 3.5. Spain
- 3.6. Russia
- 3.7. Benelux
- 3.8. Nordics
- 3.9. Rest of Europe
-
4. Middle East & Africa
- 4.1. Turkey
- 4.2. Israel
- 4.3. GCC
- 4.4. North Africa
- 4.5. South Africa
- 4.6. Rest of Middle East & Africa
-
5. Asia Pacific
- 5.1. China
- 5.2. India
- 5.3. Japan
- 5.4. South Korea
- 5.5. ASEAN
- 5.6. Oceania
- 5.7. Rest of Asia Pacific
Sports Drink Market in APAC REPORT HIGHLIGHTS
| Aspects | Details |
|---|---|
| Study Period | 2019-2033 |
| Base Year | 2024 |
| Estimated Year | 2025 |
| Forecast Period | 2025-2033 |
| Historical Period | 2019-2024 |
| Growth Rate | CAGR of 3.45% from 2019-2033 |
| Segmentation |
|
Table of Contents
- 1. Introduction
- 1.1. Research Scope
- 1.2. Market Segmentation
- 1.3. Research Methodology
- 1.4. Definitions and Assumptions
- 2. Executive Summary
- 2.1. Introduction
- 3. Market Dynamics
- 3.1. Introduction
- 3.2. Market Drivers
- 3.2.1. Rising Trend of Ingestible Beauty Products; Growing demand for Nutrient-Enriched Cosmetic Products
- 3.3. Market Restrains
- 3.3.1. Availability of Counterfeit Beauty Supplements Products
- 3.4. Market Trends
- 3.4.1. OTHER KEY INDUSTRY TRENDS COVERED IN THE REPORT
- 4. Market Factor Analysis
- 4.1. Porters Five Forces
- 4.2. Supply/Value Chain
- 4.3. PESTEL analysis
- 4.4. Market Entropy
- 4.5. Patent/Trademark Analysis
- 5. Global Sports Drink Market in APAC Analysis, Insights and Forecast, 2019-2031
- 5.1. Market Analysis, Insights and Forecast - by Soft Drink Type
- 5.1.1. Electrolyte-Enhanced Water
- 5.1.2. Hypertonic
- 5.1.3. Hypotonic
- 5.1.4. Isotonic
- 5.1.5. Protein-based Sport Drinks
- 5.2. Market Analysis, Insights and Forecast - by Packaging Type
- 5.2.1. Aseptic packages
- 5.2.2. Metal Can
- 5.2.3. PET Bottles
- 5.3. Market Analysis, Insights and Forecast - by Sub Distribution Channel
- 5.3.1. Convenience Stores
- 5.3.2. Online Retail
- 5.3.3. Specialty Stores
- 5.3.4. Supermarket/Hypermarket
- 5.3.5. Others
- 5.4. Market Analysis, Insights and Forecast - by Region
- 5.4.1. North America
- 5.4.2. South America
- 5.4.3. Europe
- 5.4.4. Middle East & Africa
- 5.4.5. Asia Pacific
- 5.1. Market Analysis, Insights and Forecast - by Soft Drink Type
- 6. North America Sports Drink Market in APAC Analysis, Insights and Forecast, 2019-2031
- 6.1. Market Analysis, Insights and Forecast - by Soft Drink Type
- 6.1.1. Electrolyte-Enhanced Water
- 6.1.2. Hypertonic
- 6.1.3. Hypotonic
- 6.1.4. Isotonic
- 6.1.5. Protein-based Sport Drinks
- 6.2. Market Analysis, Insights and Forecast - by Packaging Type
- 6.2.1. Aseptic packages
- 6.2.2. Metal Can
- 6.2.3. PET Bottles
- 6.3. Market Analysis, Insights and Forecast - by Sub Distribution Channel
- 6.3.1. Convenience Stores
- 6.3.2. Online Retail
- 6.3.3. Specialty Stores
- 6.3.4. Supermarket/Hypermarket
- 6.3.5. Others
- 6.1. Market Analysis, Insights and Forecast - by Soft Drink Type
- 7. South America Sports Drink Market in APAC Analysis, Insights and Forecast, 2019-2031
- 7.1. Market Analysis, Insights and Forecast - by Soft Drink Type
- 7.1.1. Electrolyte-Enhanced Water
- 7.1.2. Hypertonic
- 7.1.3. Hypotonic
- 7.1.4. Isotonic
- 7.1.5. Protein-based Sport Drinks
- 7.2. Market Analysis, Insights and Forecast - by Packaging Type
- 7.2.1. Aseptic packages
- 7.2.2. Metal Can
- 7.2.3. PET Bottles
- 7.3. Market Analysis, Insights and Forecast - by Sub Distribution Channel
- 7.3.1. Convenience Stores
- 7.3.2. Online Retail
- 7.3.3. Specialty Stores
- 7.3.4. Supermarket/Hypermarket
- 7.3.5. Others
- 7.1. Market Analysis, Insights and Forecast - by Soft Drink Type
- 8. Europe Sports Drink Market in APAC Analysis, Insights and Forecast, 2019-2031
- 8.1. Market Analysis, Insights and Forecast - by Soft Drink Type
- 8.1.1. Electrolyte-Enhanced Water
- 8.1.2. Hypertonic
- 8.1.3. Hypotonic
- 8.1.4. Isotonic
- 8.1.5. Protein-based Sport Drinks
- 8.2. Market Analysis, Insights and Forecast - by Packaging Type
- 8.2.1. Aseptic packages
- 8.2.2. Metal Can
- 8.2.3. PET Bottles
- 8.3. Market Analysis, Insights and Forecast - by Sub Distribution Channel
- 8.3.1. Convenience Stores
- 8.3.2. Online Retail
- 8.3.3. Specialty Stores
- 8.3.4. Supermarket/Hypermarket
- 8.3.5. Others
- 8.1. Market Analysis, Insights and Forecast - by Soft Drink Type
- 9. Middle East & Africa Sports Drink Market in APAC Analysis, Insights and Forecast, 2019-2031
- 9.1. Market Analysis, Insights and Forecast - by Soft Drink Type
- 9.1.1. Electrolyte-Enhanced Water
- 9.1.2. Hypertonic
- 9.1.3. Hypotonic
- 9.1.4. Isotonic
- 9.1.5. Protein-based Sport Drinks
- 9.2. Market Analysis, Insights and Forecast - by Packaging Type
- 9.2.1. Aseptic packages
- 9.2.2. Metal Can
- 9.2.3. PET Bottles
- 9.3. Market Analysis, Insights and Forecast - by Sub Distribution Channel
- 9.3.1. Convenience Stores
- 9.3.2. Online Retail
- 9.3.3. Specialty Stores
- 9.3.4. Supermarket/Hypermarket
- 9.3.5. Others
- 9.1. Market Analysis, Insights and Forecast - by Soft Drink Type
- 10. Asia Pacific Sports Drink Market in APAC Analysis, Insights and Forecast, 2019-2031
- 10.1. Market Analysis, Insights and Forecast - by Soft Drink Type
- 10.1.1. Electrolyte-Enhanced Water
- 10.1.2. Hypertonic
- 10.1.3. Hypotonic
- 10.1.4. Isotonic
- 10.1.5. Protein-based Sport Drinks
- 10.2. Market Analysis, Insights and Forecast - by Packaging Type
- 10.2.1. Aseptic packages
- 10.2.2. Metal Can
- 10.2.3. PET Bottles
- 10.3. Market Analysis, Insights and Forecast - by Sub Distribution Channel
- 10.3.1. Convenience Stores
- 10.3.2. Online Retail
- 10.3.3. Specialty Stores
- 10.3.4. Supermarket/Hypermarket
- 10.3.5. Others
- 10.1. Market Analysis, Insights and Forecast - by Soft Drink Type
- 11. United States Sports Drink Market in APAC Analysis, Insights and Forecast, 2019-2031
- 11.1. Market Analysis, Insights and Forecast - By Country/Sub-region
- 11.1.1.
- 12. Canada Sports Drink Market in APAC Analysis, Insights and Forecast, 2019-2031
- 12.1. Market Analysis, Insights and Forecast - By Country/Sub-region
- 12.1.1.
- 13. Mexico Sports Drink Market in APAC Analysis, Insights and Forecast, 2019-2031
- 13.1. Market Analysis, Insights and Forecast - By Country/Sub-region
- 13.1.1.
- 14. Rest of North America Sports Drink Market in APAC Analysis, Insights and Forecast, 2019-2031
- 14.1. Market Analysis, Insights and Forecast - By Country/Sub-region
- 14.1.1.
- 15. Competitive Analysis
- 15.1. Global Market Share Analysis 2024
- 15.2. Company Profiles
- 15.2.1 Carabao Group Public Company Limited
- 15.2.1.1. Overview
- 15.2.1.2. Products
- 15.2.1.3. SWOT Analysis
- 15.2.1.4. Recent Developments
- 15.2.1.5. Financials (Based on Availability)
- 15.2.2 Aje Group
- 15.2.2.1. Overview
- 15.2.2.2. Products
- 15.2.2.3. SWOT Analysis
- 15.2.2.4. Recent Developments
- 15.2.2.5. Financials (Based on Availability)
- 15.2.3 Vitalon Foods Company Limite
- 15.2.3.1. Overview
- 15.2.3.2. Products
- 15.2.3.3. SWOT Analysis
- 15.2.3.4. Recent Developments
- 15.2.3.5. Financials (Based on Availability)
- 15.2.4 Beijing Genki Forest Beverage Co Ltd
- 15.2.4.1. Overview
- 15.2.4.2. Products
- 15.2.4.3. SWOT Analysis
- 15.2.4.4. Recent Developments
- 15.2.4.5. Financials (Based on Availability)
- 15.2.5 PepsiCo Inc
- 15.2.5.1. Overview
- 15.2.5.2. Products
- 15.2.5.3. SWOT Analysis
- 15.2.5.4. Recent Developments
- 15.2.5.5. Financials (Based on Availability)
- 15.2.6 Nongfu Spring Co Ltd
- 15.2.6.1. Overview
- 15.2.6.2. Products
- 15.2.6.3. SWOT Analysis
- 15.2.6.4. Recent Developments
- 15.2.6.5. Financials (Based on Availability)
- 15.2.7 Suntory Holdings Limited
- 15.2.7.1. Overview
- 15.2.7.2. Products
- 15.2.7.3. SWOT Analysis
- 15.2.7.4. Recent Developments
- 15.2.7.5. Financials (Based on Availability)
- 15.2.8 Steric Pty Ltd
- 15.2.8.1. Overview
- 15.2.8.2. Products
- 15.2.8.3. SWOT Analysis
- 15.2.8.4. Recent Developments
- 15.2.8.5. Financials (Based on Availability)
- 15.2.9 Danone S A
- 15.2.9.1. Overview
- 15.2.9.2. Products
- 15.2.9.3. SWOT Analysis
- 15.2.9.4. Recent Developments
- 15.2.9.5. Financials (Based on Availability)
- 15.2.10 The Coca-Cola Company
- 15.2.10.1. Overview
- 15.2.10.2. Products
- 15.2.10.3. SWOT Analysis
- 15.2.10.4. Recent Developments
- 15.2.10.5. Financials (Based on Availability)
- 15.2.11 Guangdong Jianlibao Group
- 15.2.11.1. Overview
- 15.2.11.2. Products
- 15.2.11.3. SWOT Analysis
- 15.2.11.4. Recent Developments
- 15.2.11.5. Financials (Based on Availability)
- 15.2.12 Thai Beverages PCL
- 15.2.12.1. Overview
- 15.2.12.2. Products
- 15.2.12.3. SWOT Analysis
- 15.2.12.4. Recent Developments
- 15.2.12.5. Financials (Based on Availability)
- 15.2.13 Otsuka Holdings Co Ltd
- 15.2.13.1. Overview
- 15.2.13.2. Products
- 15.2.13.3. SWOT Analysis
- 15.2.13.4. Recent Developments
- 15.2.13.5. Financials (Based on Availability)
- 15.2.14 Sapporo Holdings Limited
- 15.2.14.1. Overview
- 15.2.14.2. Products
- 15.2.14.3. SWOT Analysis
- 15.2.14.4. Recent Developments
- 15.2.14.5. Financials (Based on Availability)
- 15.2.1 Carabao Group Public Company Limited
List of Figures
- Figure 1: Global Sports Drink Market in APAC Revenue Breakdown (Million, %) by Region 2024 & 2032
- Figure 2: United States Sports Drink Market in APAC Revenue (Million), by Country 2024 & 2032
- Figure 3: United States Sports Drink Market in APAC Revenue Share (%), by Country 2024 & 2032
- Figure 4: Canada Sports Drink Market in APAC Revenue (Million), by Country 2024 & 2032
- Figure 5: Canada Sports Drink Market in APAC Revenue Share (%), by Country 2024 & 2032
- Figure 6: Mexico Sports Drink Market in APAC Revenue (Million), by Country 2024 & 2032
- Figure 7: Mexico Sports Drink Market in APAC Revenue Share (%), by Country 2024 & 2032
- Figure 8: Rest of North America Sports Drink Market in APAC Revenue (Million), by Country 2024 & 2032
- Figure 9: Rest of North America Sports Drink Market in APAC Revenue Share (%), by Country 2024 & 2032
- Figure 10: North America Sports Drink Market in APAC Revenue (Million), by Soft Drink Type 2024 & 2032
- Figure 11: North America Sports Drink Market in APAC Revenue Share (%), by Soft Drink Type 2024 & 2032
- Figure 12: North America Sports Drink Market in APAC Revenue (Million), by Packaging Type 2024 & 2032
- Figure 13: North America Sports Drink Market in APAC Revenue Share (%), by Packaging Type 2024 & 2032
- Figure 14: North America Sports Drink Market in APAC Revenue (Million), by Sub Distribution Channel 2024 & 2032
- Figure 15: North America Sports Drink Market in APAC Revenue Share (%), by Sub Distribution Channel 2024 & 2032
- Figure 16: North America Sports Drink Market in APAC Revenue (Million), by Country 2024 & 2032
- Figure 17: North America Sports Drink Market in APAC Revenue Share (%), by Country 2024 & 2032
- Figure 18: South America Sports Drink Market in APAC Revenue (Million), by Soft Drink Type 2024 & 2032
- Figure 19: South America Sports Drink Market in APAC Revenue Share (%), by Soft Drink Type 2024 & 2032
- Figure 20: South America Sports Drink Market in APAC Revenue (Million), by Packaging Type 2024 & 2032
- Figure 21: South America Sports Drink Market in APAC Revenue Share (%), by Packaging Type 2024 & 2032
- Figure 22: South America Sports Drink Market in APAC Revenue (Million), by Sub Distribution Channel 2024 & 2032
- Figure 23: South America Sports Drink Market in APAC Revenue Share (%), by Sub Distribution Channel 2024 & 2032
- Figure 24: South America Sports Drink Market in APAC Revenue (Million), by Country 2024 & 2032
- Figure 25: South America Sports Drink Market in APAC Revenue Share (%), by Country 2024 & 2032
- Figure 26: Europe Sports Drink Market in APAC Revenue (Million), by Soft Drink Type 2024 & 2032
- Figure 27: Europe Sports Drink Market in APAC Revenue Share (%), by Soft Drink Type 2024 & 2032
- Figure 28: Europe Sports Drink Market in APAC Revenue (Million), by Packaging Type 2024 & 2032
- Figure 29: Europe Sports Drink Market in APAC Revenue Share (%), by Packaging Type 2024 & 2032
- Figure 30: Europe Sports Drink Market in APAC Revenue (Million), by Sub Distribution Channel 2024 & 2032
- Figure 31: Europe Sports Drink Market in APAC Revenue Share (%), by Sub Distribution Channel 2024 & 2032
- Figure 32: Europe Sports Drink Market in APAC Revenue (Million), by Country 2024 & 2032
- Figure 33: Europe Sports Drink Market in APAC Revenue Share (%), by Country 2024 & 2032
- Figure 34: Middle East & Africa Sports Drink Market in APAC Revenue (Million), by Soft Drink Type 2024 & 2032
- Figure 35: Middle East & Africa Sports Drink Market in APAC Revenue Share (%), by Soft Drink Type 2024 & 2032
- Figure 36: Middle East & Africa Sports Drink Market in APAC Revenue (Million), by Packaging Type 2024 & 2032
- Figure 37: Middle East & Africa Sports Drink Market in APAC Revenue Share (%), by Packaging Type 2024 & 2032
- Figure 38: Middle East & Africa Sports Drink Market in APAC Revenue (Million), by Sub Distribution Channel 2024 & 2032
- Figure 39: Middle East & Africa Sports Drink Market in APAC Revenue Share (%), by Sub Distribution Channel 2024 & 2032
- Figure 40: Middle East & Africa Sports Drink Market in APAC Revenue (Million), by Country 2024 & 2032
- Figure 41: Middle East & Africa Sports Drink Market in APAC Revenue Share (%), by Country 2024 & 2032
- Figure 42: Asia Pacific Sports Drink Market in APAC Revenue (Million), by Soft Drink Type 2024 & 2032
- Figure 43: Asia Pacific Sports Drink Market in APAC Revenue Share (%), by Soft Drink Type 2024 & 2032
- Figure 44: Asia Pacific Sports Drink Market in APAC Revenue (Million), by Packaging Type 2024 & 2032
- Figure 45: Asia Pacific Sports Drink Market in APAC Revenue Share (%), by Packaging Type 2024 & 2032
- Figure 46: Asia Pacific Sports Drink Market in APAC Revenue (Million), by Sub Distribution Channel 2024 & 2032
- Figure 47: Asia Pacific Sports Drink Market in APAC Revenue Share (%), by Sub Distribution Channel 2024 & 2032
- Figure 48: Asia Pacific Sports Drink Market in APAC Revenue (Million), by Country 2024 & 2032
- Figure 49: Asia Pacific Sports Drink Market in APAC Revenue Share (%), by Country 2024 & 2032
List of Tables
- Table 1: Global Sports Drink Market in APAC Revenue Million Forecast, by Region 2019 & 2032
- Table 2: Global Sports Drink Market in APAC Revenue Million Forecast, by Soft Drink Type 2019 & 2032
- Table 3: Global Sports Drink Market in APAC Revenue Million Forecast, by Packaging Type 2019 & 2032
- Table 4: Global Sports Drink Market in APAC Revenue Million Forecast, by Sub Distribution Channel 2019 & 2032
- Table 5: Global Sports Drink Market in APAC Revenue Million Forecast, by Region 2019 & 2032
- Table 6: Global Sports Drink Market in APAC Revenue Million Forecast, by Country 2019 & 2032
- Table 7: Sports Drink Market in APAC Revenue (Million) Forecast, by Application 2019 & 2032
- Table 8: Global Sports Drink Market in APAC Revenue Million Forecast, by Country 2019 & 2032
- Table 9: Sports Drink Market in APAC Revenue (Million) Forecast, by Application 2019 & 2032
- Table 10: Global Sports Drink Market in APAC Revenue Million Forecast, by Country 2019 & 2032
- Table 11: Sports Drink Market in APAC Revenue (Million) Forecast, by Application 2019 & 2032
- Table 12: Global Sports Drink Market in APAC Revenue Million Forecast, by Country 2019 & 2032
- Table 13: Sports Drink Market in APAC Revenue (Million) Forecast, by Application 2019 & 2032
- Table 14: Global Sports Drink Market in APAC Revenue Million Forecast, by Soft Drink Type 2019 & 2032
- Table 15: Global Sports Drink Market in APAC Revenue Million Forecast, by Packaging Type 2019 & 2032
- Table 16: Global Sports Drink Market in APAC Revenue Million Forecast, by Sub Distribution Channel 2019 & 2032
- Table 17: Global Sports Drink Market in APAC Revenue Million Forecast, by Country 2019 & 2032
- Table 18: United States Sports Drink Market in APAC Revenue (Million) Forecast, by Application 2019 & 2032
- Table 19: Canada Sports Drink Market in APAC Revenue (Million) Forecast, by Application 2019 & 2032
- Table 20: Mexico Sports Drink Market in APAC Revenue (Million) Forecast, by Application 2019 & 2032
- Table 21: Global Sports Drink Market in APAC Revenue Million Forecast, by Soft Drink Type 2019 & 2032
- Table 22: Global Sports Drink Market in APAC Revenue Million Forecast, by Packaging Type 2019 & 2032
- Table 23: Global Sports Drink Market in APAC Revenue Million Forecast, by Sub Distribution Channel 2019 & 2032
- Table 24: Global Sports Drink Market in APAC Revenue Million Forecast, by Country 2019 & 2032
- Table 25: Brazil Sports Drink Market in APAC Revenue (Million) Forecast, by Application 2019 & 2032
- Table 26: Argentina Sports Drink Market in APAC Revenue (Million) Forecast, by Application 2019 & 2032
- Table 27: Rest of South America Sports Drink Market in APAC Revenue (Million) Forecast, by Application 2019 & 2032
- Table 28: Global Sports Drink Market in APAC Revenue Million Forecast, by Soft Drink Type 2019 & 2032
- Table 29: Global Sports Drink Market in APAC Revenue Million Forecast, by Packaging Type 2019 & 2032
- Table 30: Global Sports Drink Market in APAC Revenue Million Forecast, by Sub Distribution Channel 2019 & 2032
- Table 31: Global Sports Drink Market in APAC Revenue Million Forecast, by Country 2019 & 2032
- Table 32: United Kingdom Sports Drink Market in APAC Revenue (Million) Forecast, by Application 2019 & 2032
- Table 33: Germany Sports Drink Market in APAC Revenue (Million) Forecast, by Application 2019 & 2032
- Table 34: France Sports Drink Market in APAC Revenue (Million) Forecast, by Application 2019 & 2032
- Table 35: Italy Sports Drink Market in APAC Revenue (Million) Forecast, by Application 2019 & 2032
- Table 36: Spain Sports Drink Market in APAC Revenue (Million) Forecast, by Application 2019 & 2032
- Table 37: Russia Sports Drink Market in APAC Revenue (Million) Forecast, by Application 2019 & 2032
- Table 38: Benelux Sports Drink Market in APAC Revenue (Million) Forecast, by Application 2019 & 2032
- Table 39: Nordics Sports Drink Market in APAC Revenue (Million) Forecast, by Application 2019 & 2032
- Table 40: Rest of Europe Sports Drink Market in APAC Revenue (Million) Forecast, by Application 2019 & 2032
- Table 41: Global Sports Drink Market in APAC Revenue Million Forecast, by Soft Drink Type 2019 & 2032
- Table 42: Global Sports Drink Market in APAC Revenue Million Forecast, by Packaging Type 2019 & 2032
- Table 43: Global Sports Drink Market in APAC Revenue Million Forecast, by Sub Distribution Channel 2019 & 2032
- Table 44: Global Sports Drink Market in APAC Revenue Million Forecast, by Country 2019 & 2032
- Table 45: Turkey Sports Drink Market in APAC Revenue (Million) Forecast, by Application 2019 & 2032
- Table 46: Israel Sports Drink Market in APAC Revenue (Million) Forecast, by Application 2019 & 2032
- Table 47: GCC Sports Drink Market in APAC Revenue (Million) Forecast, by Application 2019 & 2032
- Table 48: North Africa Sports Drink Market in APAC Revenue (Million) Forecast, by Application 2019 & 2032
- Table 49: South Africa Sports Drink Market in APAC Revenue (Million) Forecast, by Application 2019 & 2032
- Table 50: Rest of Middle East & Africa Sports Drink Market in APAC Revenue (Million) Forecast, by Application 2019 & 2032
- Table 51: Global Sports Drink Market in APAC Revenue Million Forecast, by Soft Drink Type 2019 & 2032
- Table 52: Global Sports Drink Market in APAC Revenue Million Forecast, by Packaging Type 2019 & 2032
- Table 53: Global Sports Drink Market in APAC Revenue Million Forecast, by Sub Distribution Channel 2019 & 2032
- Table 54: Global Sports Drink Market in APAC Revenue Million Forecast, by Country 2019 & 2032
- Table 55: China Sports Drink Market in APAC Revenue (Million) Forecast, by Application 2019 & 2032
- Table 56: India Sports Drink Market in APAC Revenue (Million) Forecast, by Application 2019 & 2032
- Table 57: Japan Sports Drink Market in APAC Revenue (Million) Forecast, by Application 2019 & 2032
- Table 58: South Korea Sports Drink Market in APAC Revenue (Million) Forecast, by Application 2019 & 2032
- Table 59: ASEAN Sports Drink Market in APAC Revenue (Million) Forecast, by Application 2019 & 2032
- Table 60: Oceania Sports Drink Market in APAC Revenue (Million) Forecast, by Application 2019 & 2032
- Table 61: Rest of Asia Pacific Sports Drink Market in APAC Revenue (Million) Forecast, by Application 2019 & 2032
Frequently Asked Questions
1. What is the projected Compound Annual Growth Rate (CAGR) of the Sports Drink Market in APAC?
The projected CAGR is approximately 3.45%.
2. Which companies are prominent players in the Sports Drink Market in APAC?
Key companies in the market include Carabao Group Public Company Limited, Aje Group, Vitalon Foods Company Limite, Beijing Genki Forest Beverage Co Ltd, PepsiCo Inc, Nongfu Spring Co Ltd, Suntory Holdings Limited, Steric Pty Ltd, Danone S A, The Coca-Cola Company, Guangdong Jianlibao Group, Thai Beverages PCL, Otsuka Holdings Co Ltd, Sapporo Holdings Limited.
3. What are the main segments of the Sports Drink Market in APAC?
The market segments include Soft Drink Type, Packaging Type, Sub Distribution Channel.
4. Can you provide details about the market size?
The market size is estimated to be USD XX Million as of 2022.
5. What are some drivers contributing to market growth?
Rising Trend of Ingestible Beauty Products; Growing demand for Nutrient-Enriched Cosmetic Products.
6. What are the notable trends driving market growth?
OTHER KEY INDUSTRY TRENDS COVERED IN THE REPORT.
7. Are there any restraints impacting market growth?
Availability of Counterfeit Beauty Supplements Products.
8. Can you provide examples of recent developments in the market?
September 2023: Limca Sportz, the sports drink from Coca-Cola India's home-grown brand Limca, is thrilled to announce the launch of its new variant Limca Sportz ION4 in India.June 2023: Danone China has launched a grapefruit-flavored electrolyte drink in the Chinese market. Each bottle contains 455g of five essential electrolytes (potassium, calcium, magnesium, sodium, and chloride.August 2022: Coca‑Cola India has announced the first-ever brand extension for its homegrown brand Limca into the hydrating sports drinks category with ‘Limca Sportz’. The brand’s new offering ‘Limca Sportz’ is a Glucose + Electrolyte-based beverage containing essential minerals for rapid fluid intake.
9. What pricing options are available for accessing the report?
Pricing options include single-user, multi-user, and enterprise licenses priced at USD 3800, USD 4500, and USD 5800 respectively.
10. Is the market size provided in terms of value or volume?
The market size is provided in terms of value, measured in Million.
11. Are there any specific market keywords associated with the report?
Yes, the market keyword associated with the report is "Sports Drink Market in APAC," which aids in identifying and referencing the specific market segment covered.
12. How do I determine which pricing option suits my needs best?
The pricing options vary based on user requirements and access needs. Individual users may opt for single-user licenses, while businesses requiring broader access may choose multi-user or enterprise licenses for cost-effective access to the report.
13. Are there any additional resources or data provided in the Sports Drink Market in APAC report?
While the report offers comprehensive insights, it's advisable to review the specific contents or supplementary materials provided to ascertain if additional resources or data are available.
14. How can I stay updated on further developments or reports in the Sports Drink Market in APAC?
To stay informed about further developments, trends, and reports in the Sports Drink Market in APAC, consider subscribing to industry newsletters, following relevant companies and organizations, or regularly checking reputable industry news sources and publications.
Methodology
Step 1 - Identification of Relevant Samples Size from Population Database


Step 2 - Approaches for Defining Global Market Size (Value, Volume* & Price*)

Note*: In applicable scenarios
Step 3 - Data Sources
Primary Research
- Web Analytics
- Survey Reports
- Research Institute
- Latest Research Reports
- Opinion Leaders
Secondary Research
- Annual Reports
- White Paper
- Latest Press Release
- Industry Association
- Paid Database
- Investor Presentations

Step 4 - Data Triangulation
Involves using different sources of information in order to increase the validity of a study
These sources are likely to be stakeholders in a program - participants, other researchers, program staff, other community members, and so on.
Then we put all data in single framework & apply various statistical tools to find out the dynamic on the market.
During the analysis stage, feedback from the stakeholder groups would be compared to determine areas of agreement as well as areas of divergence


