
Key Insights
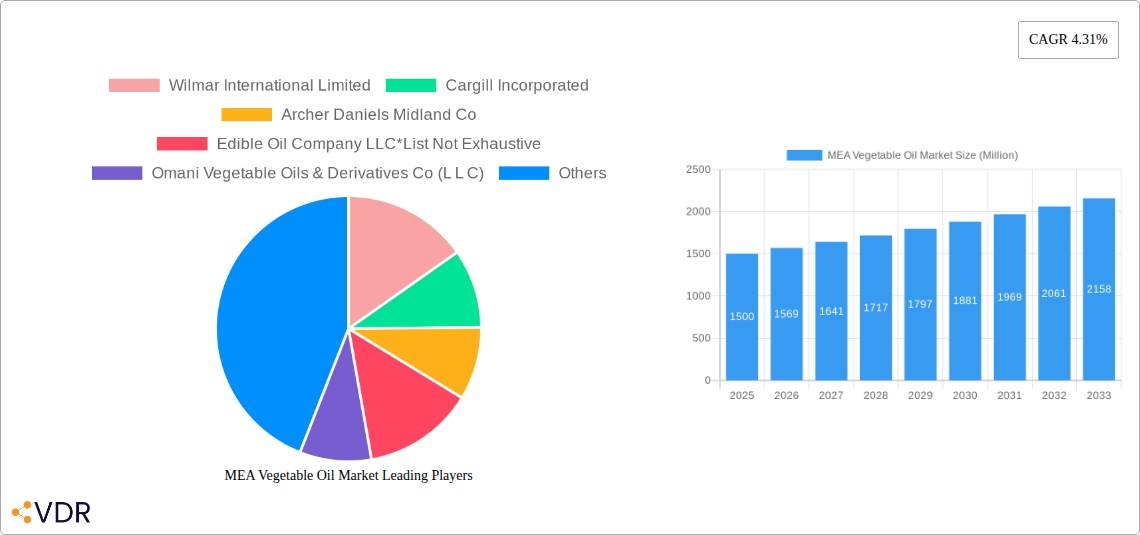
The Middle East and Africa (MEA) vegetable oil market, while exhibiting a robust growth trajectory, faces unique challenges and opportunities. Driven by increasing populations, rising disposable incomes, and shifting dietary habits towards processed foods, the market is experiencing steady expansion. A projected Compound Annual Growth Rate (CAGR) of 4.31% from 2025 to 2033 indicates sustained market growth. Key drivers include the increasing demand for vegetable oils in the food industry, particularly in processed foods and snacks, and a growing feed industry relying on vegetable oils for livestock. The region's reliance on imports, however, poses a vulnerability to global price fluctuations and supply chain disruptions. Furthermore, health consciousness and the increasing preference for healthier alternatives like olive oil are creating segment-specific growth and influencing consumer choices. Local production efforts are attempting to mitigate import reliance, but challenges remain in terms of technological advancements and sustainable agricultural practices. The market is segmented by product type (palm, soybean, rapeseed, sunflower, olive, and others) and application (food, feed, industrial), with food applications currently dominating. Major players like Wilmar International Limited and Cargill Incorporated are strategically positioning themselves within this dynamic market, focusing on supply chain optimization and product diversification to meet evolving consumer preferences.
While the overall MEA market shows promise, individual country performance varies. For instance, countries like the UAE and Saudi Arabia, with higher per capita incomes and robust food processing sectors, are expected to lead regional growth. South Africa, representing a significant portion of the African market, offers growth potential but requires overcoming infrastructure challenges and promoting local production. The market faces constraints such as fluctuating crude oil prices (indirectly impacting production costs), stringent government regulations on food safety and labeling, and potential climate change effects on crop yields. Successful market players will need to navigate these challenges effectively, focusing on sustainable sourcing, efficient supply chain management, and innovative product offerings tailored to specific regional needs and consumer preferences. Further research is required to provide precise market size data for the MEA region, but based on global trends and regional economic indicators, a significant market expansion is anticipated over the forecast period.
MEA Vegetable Oil Market: A Comprehensive Report (2019-2033)
This comprehensive report provides a detailed analysis of the Middle East and Africa (MEA) vegetable oil market, encompassing market dynamics, growth trends, regional insights, product landscapes, and key player strategies. The study period covers 2019-2033, with 2025 as the base and estimated year. This report is invaluable for industry professionals, investors, and strategic decision-makers seeking a deep understanding of this dynamic market. The market is segmented by product type (Palm Oil, Soybean Oil, Rapeseed Oil, Sunflower Oil, Olive Oil, Other Product Types) and application (Food, Feed, Industrial). The total market size is projected to reach xx Million by 2033.
MEA Vegetable Oil Market Dynamics & Structure
The MEA vegetable oil market exhibits a moderately concentrated structure, with several large multinational corporations and regional players vying for market share. Technological innovations, particularly in oil extraction and processing, are crucial drivers. Stringent regulatory frameworks concerning food safety and labeling influence market practices. Competitive pressures from substitute products, such as animal fats, are present but are being mitigated by growing awareness of health and sustainability issues. End-user demographics, with a rising population and changing dietary habits, are key factors shaping demand. M&A activity remains significant, as evidenced by recent deals such as Al Ghurair’s acquisition of Edible Oil Company LLC.
- Market Concentration: Moderately concentrated, with a top 5 market share of approximately xx%.
- Technological Innovation: Focus on sustainable production, efficient extraction methods, and improved refining processes.
- Regulatory Framework: Stringent food safety standards, labeling regulations, and import/export policies.
- Competitive Substitutes: Animal fats and other cooking oils present competition.
- M&A Activity: High level of mergers and acquisitions aimed at expanding market reach and product portfolios. The number of deals closed between 2019-2024 totaled approximately xx.
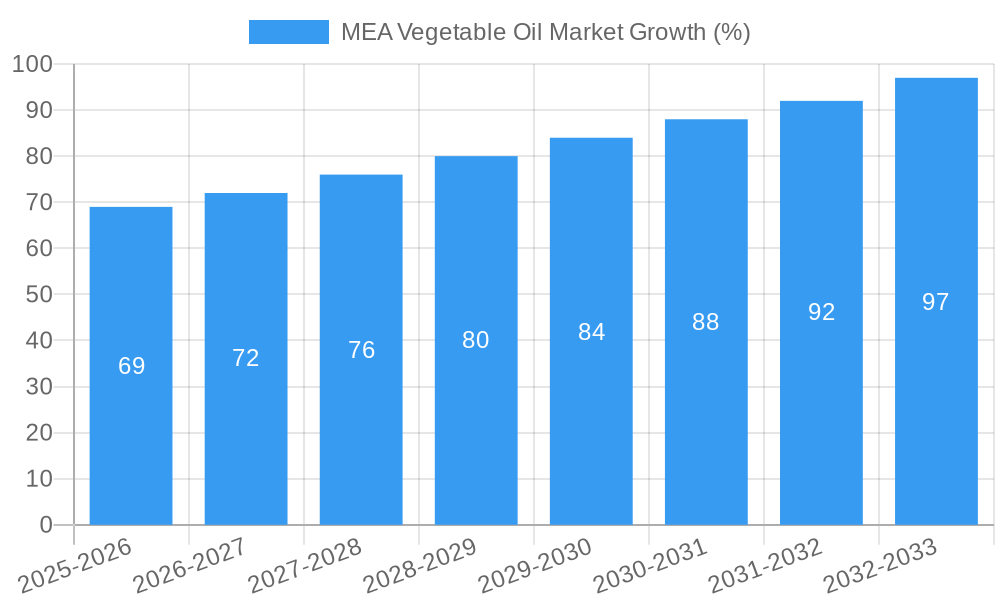
MEA Vegetable Oil Market Growth Trends & Insights
The MEA vegetable oil market has experienced substantial growth over the historical period (2019-2024), driven by factors such as population growth, rising disposable incomes, and changing consumption patterns. The market size is estimated at xx Million in 2025, showcasing a CAGR of xx% during the historical period. Technological advancements like improved oil extraction techniques and the increasing popularity of value-added products are shaping growth trajectory. Consumer preferences are shifting towards healthier oils, driving demand for specific types of vegetable oils. The forecast period (2025-2033) projects continued growth, with the market size expected to reach xx Million. Market penetration of specific vegetable oils varies across the region, reflecting diverse culinary traditions and dietary habits. Disruptions caused by geopolitical events and supply chain challenges are closely monitored for potential impact.
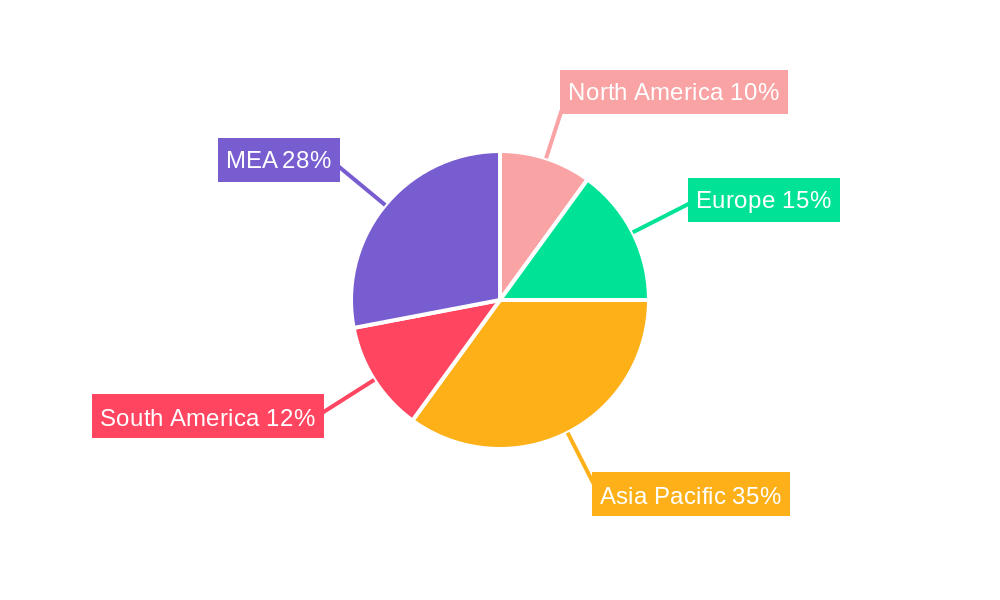
Dominant Regions, Countries, or Segments in MEA Vegetable Oil Market
The dominant segment within the MEA vegetable oil market varies by criteria. By product type, Palm oil holds a significant market share, fueled by its widespread usage and lower cost. However, growth in the soybean oil and sunflower oil segments is driven by rising demand for healthier alternatives. In terms of application, the food segment remains the largest consumer, driven by increased food processing and consumption. The industrial sector also represents a sizable market segment with growing demand for biofuels and industrial applications. Regional dominance is geographically diverse, with several countries exhibiting substantial growth, influenced by factors like local production capacity, import/export regulations, economic conditions, and infrastructural developments.
- Leading Region/Country: xx (Market share: xx%) due to factors such as:
- Strong local production capabilities.
- Favorable government policies.
- Growing population and rising disposable incomes.
- Leading Product Type: Palm Oil (Market share: xx%), driven by:
- Cost-effectiveness.
- Versatile applications in the food industry.
- Leading Application: Food (Market share: xx%), due to:
- Increased food consumption.
- Growth in the food processing sector.
MEA Vegetable Oil Market Product Landscape
The MEA vegetable oil market showcases a diverse product landscape, encompassing a range of refined and unrefined oils, each catering to specific needs and preferences. Innovations are focused on enhancing product quality, shelf life, and health benefits. The market is witnessing a rise in value-added products, including specialty oils and functional oils enriched with vitamins and antioxidants. Technological advancements in oil extraction and refining processes have improved efficiency and reduced environmental impacts. The focus on sustainable sourcing and ethical production is also gaining momentum, influencing consumer purchasing decisions.
Key Drivers, Barriers & Challenges in MEA Vegetable Oil Market
Key Drivers:
- Rising population and urbanization.
- Growing demand for processed foods.
- Increasing awareness of health benefits of vegetable oils.
- Expansion of the food processing industry.
Challenges & Restraints:
- Fluctuations in global crude oil prices.
- Supply chain disruptions and logistical challenges.
- Competition from other cooking oils.
- Regulatory hurdles and trade restrictions. The impact of these challenges on the market is estimated to be xx% reduction in growth in 2024.
Emerging Opportunities in MEA Vegetable Oil Market
- Growing demand for healthy and functional oils.
- Expansion of the biofuel industry.
- Increased adoption of sustainable and ethical sourcing practices.
- Untapped potential in emerging markets within MEA.
- Rise of online retail channels for vegetable oil.
Growth Accelerators in the MEA Vegetable Oil Market Industry
The long-term growth of the MEA vegetable oil market is being fueled by several key factors. Strategic partnerships between international and local companies are fostering market expansion and technology transfer. Government initiatives promoting sustainable agriculture and local production are creating a favorable environment for growth. Technological innovations are improving efficiency and lowering production costs, making vegetable oils more accessible to consumers. The continuous development of new and improved product offerings, catering to diverse consumer needs and preferences is playing a vital role.
Key Players Shaping the MEA Vegetable Oil Market Market
- Wilmar International Limited
- Cargill Incorporated
- Archer Daniels Midland Co
- Edible Oil Company LLC
- Omani Vegetable Oils & Derivatives Co (L L C)
- Amira Nature Foods Ltd
- Al Ghurair
- Sime Darby Plantation Berhad
- ADVOC (ABU DHABI VEGETABLE OIL COMPANY)
- AJWA Group
Notable Milestones in MEA Vegetable Oil Market Sector
- 2019 (Oct): Sime Darby Oils and Abu Dhabi Vegetable Oil Company formed a strategic partnership for marketing oils and fats products in the MENA region.
- 2021 (Q3): Al Ghurair acquired Edible Oil Company LLC, expanding its footprint in the Middle East.
- 2021 (Q4): Archer Daniels Midland Co. and Marathon Petroleum Corp. announced a joint venture to manufacture soybean oil for renewable diesel fuel, catering to the Middle East's growing demand.
In-Depth MEA Vegetable Oil Market Market Outlook
The MEA vegetable oil market is poised for continued growth over the forecast period, driven by several factors. The increasing adoption of healthy eating habits, expanding food processing sector, and growing demand for biofuels will significantly contribute to market expansion. Strategic partnerships and technological advancements will play a pivotal role in shaping future market dynamics. Opportunities for market players lie in developing innovative products, enhancing supply chain efficiency, and focusing on sustainable and ethical production practices. The market’s long-term potential is significant, presenting lucrative opportunities for companies to capture market share and drive sustainable growth.
MEA Vegetable Oil Market Segmentation
-
1. Product Type
- 1.1. Palm Oil
- 1.2. Soybean Oil
- 1.3. Rapeseed Oil
- 1.4. Sunflower Oil
- 1.5. Olive Oil
- 1.6. Other Product Types
-
2. Application
- 2.1. Food
- 2.2. Feed
- 2.3. Industrial
-
3. Geography
- 3.1. South Africa
- 3.2. United Arab Emirates
- 3.3. Rest of Middle-East and Africa
MEA Vegetable Oil Market Segmentation By Geography
- 1. South Africa
- 2. United Arab Emirates
- 3. Rest of Middle East and Africa
MEA Vegetable Oil Market REPORT HIGHLIGHTS
| Aspects | Details |
|---|---|
| Study Period | 2019-2033 |
| Base Year | 2024 |
| Estimated Year | 2025 |
| Forecast Period | 2025-2033 |
| Historical Period | 2019-2024 |
| Growth Rate | CAGR of 4.31% from 2019-2033 |
| Segmentation |
|
Table of Contents
- 1. Introduction
- 1.1. Research Scope
- 1.2. Market Segmentation
- 1.3. Research Methodology
- 1.4. Definitions and Assumptions
- 2. Executive Summary
- 2.1. Introduction
- 3. Market Dynamics
- 3.1. Introduction
- 3.2. Market Drivers
- 3.2.1. Growing Demand for Plant Based Alternatives; Expanding Application of Pea Protein Toward Food Fortification
- 3.3. Market Restrains
- 3.3.1. Low Awareness and Application of the Additive
- 3.4. Market Trends
- 3.4.1. Increasing Demand for Fortified Edible Oil
- 4. Market Factor Analysis
- 4.1. Porters Five Forces
- 4.2. Supply/Value Chain
- 4.3. PESTEL analysis
- 4.4. Market Entropy
- 4.5. Patent/Trademark Analysis
- 5. Global MEA Vegetable Oil Market Analysis, Insights and Forecast, 2019-2031
- 5.1. Market Analysis, Insights and Forecast - by Product Type
- 5.1.1. Palm Oil
- 5.1.2. Soybean Oil
- 5.1.3. Rapeseed Oil
- 5.1.4. Sunflower Oil
- 5.1.5. Olive Oil
- 5.1.6. Other Product Types
- 5.2. Market Analysis, Insights and Forecast - by Application
- 5.2.1. Food
- 5.2.2. Feed
- 5.2.3. Industrial
- 5.3. Market Analysis, Insights and Forecast - by Geography
- 5.3.1. South Africa
- 5.3.2. United Arab Emirates
- 5.3.3. Rest of Middle-East and Africa
- 5.4. Market Analysis, Insights and Forecast - by Region
- 5.4.1. South Africa
- 5.4.2. United Arab Emirates
- 5.4.3. Rest of Middle East and Africa
- 5.1. Market Analysis, Insights and Forecast - by Product Type
- 6. South Africa MEA Vegetable Oil Market Analysis, Insights and Forecast, 2019-2031
- 6.1. Market Analysis, Insights and Forecast - by Product Type
- 6.1.1. Palm Oil
- 6.1.2. Soybean Oil
- 6.1.3. Rapeseed Oil
- 6.1.4. Sunflower Oil
- 6.1.5. Olive Oil
- 6.1.6. Other Product Types
- 6.2. Market Analysis, Insights and Forecast - by Application
- 6.2.1. Food
- 6.2.2. Feed
- 6.2.3. Industrial
- 6.3. Market Analysis, Insights and Forecast - by Geography
- 6.3.1. South Africa
- 6.3.2. United Arab Emirates
- 6.3.3. Rest of Middle-East and Africa
- 6.1. Market Analysis, Insights and Forecast - by Product Type
- 7. United Arab Emirates MEA Vegetable Oil Market Analysis, Insights and Forecast, 2019-2031
- 7.1. Market Analysis, Insights and Forecast - by Product Type
- 7.1.1. Palm Oil
- 7.1.2. Soybean Oil
- 7.1.3. Rapeseed Oil
- 7.1.4. Sunflower Oil
- 7.1.5. Olive Oil
- 7.1.6. Other Product Types
- 7.2. Market Analysis, Insights and Forecast - by Application
- 7.2.1. Food
- 7.2.2. Feed
- 7.2.3. Industrial
- 7.3. Market Analysis, Insights and Forecast - by Geography
- 7.3.1. South Africa
- 7.3.2. United Arab Emirates
- 7.3.3. Rest of Middle-East and Africa
- 7.1. Market Analysis, Insights and Forecast - by Product Type
- 8. Rest of Middle East and Africa MEA Vegetable Oil Market Analysis, Insights and Forecast, 2019-2031
- 8.1. Market Analysis, Insights and Forecast - by Product Type
- 8.1.1. Palm Oil
- 8.1.2. Soybean Oil
- 8.1.3. Rapeseed Oil
- 8.1.4. Sunflower Oil
- 8.1.5. Olive Oil
- 8.1.6. Other Product Types
- 8.2. Market Analysis, Insights and Forecast - by Application
- 8.2.1. Food
- 8.2.2. Feed
- 8.2.3. Industrial
- 8.3. Market Analysis, Insights and Forecast - by Geography
- 8.3.1. South Africa
- 8.3.2. United Arab Emirates
- 8.3.3. Rest of Middle-East and Africa
- 8.1. Market Analysis, Insights and Forecast - by Product Type
- 9. North America MEA Vegetable Oil Market Analysis, Insights and Forecast, 2019-2031
- 9.1. Market Analysis, Insights and Forecast - By Country/Sub-region
- 9.1.1 United States
- 9.1.2 Canada
- 9.1.3 Mexico
- 10. Europe MEA Vegetable Oil Market Analysis, Insights and Forecast, 2019-2031
- 10.1. Market Analysis, Insights and Forecast - By Country/Sub-region
- 10.1.1 Germany
- 10.1.2 United Kingdom
- 10.1.3 France
- 10.1.4 Spain
- 10.1.5 Italy
- 10.1.6 Spain
- 10.1.7 Belgium
- 10.1.8 Netherland
- 10.1.9 Nordics
- 10.1.10 Rest of Europe
- 11. Asia Pacific MEA Vegetable Oil Market Analysis, Insights and Forecast, 2019-2031
- 11.1. Market Analysis, Insights and Forecast - By Country/Sub-region
- 11.1.1 China
- 11.1.2 Japan
- 11.1.3 India
- 11.1.4 South Korea
- 11.1.5 Southeast Asia
- 11.1.6 Australia
- 11.1.7 Indonesia
- 11.1.8 Phillipes
- 11.1.9 Singapore
- 11.1.10 Thailandc
- 11.1.11 Rest of Asia Pacific
- 12. South America MEA Vegetable Oil Market Analysis, Insights and Forecast, 2019-2031
- 12.1. Market Analysis, Insights and Forecast - By Country/Sub-region
- 12.1.1 Brazil
- 12.1.2 Argentina
- 12.1.3 Peru
- 12.1.4 Chile
- 12.1.5 Colombia
- 12.1.6 Ecuador
- 12.1.7 Venezuela
- 12.1.8 Rest of South America
- 13. North America MEA Vegetable Oil Market Analysis, Insights and Forecast, 2019-2031
- 13.1. Market Analysis, Insights and Forecast - By Country/Sub-region
- 13.1.1 United States
- 13.1.2 Canada
- 13.1.3 Mexico
- 14. MEA MEA Vegetable Oil Market Analysis, Insights and Forecast, 2019-2031
- 14.1. Market Analysis, Insights and Forecast - By Country/Sub-region
- 14.1.1 United Arab Emirates
- 14.1.2 Saudi Arabia
- 14.1.3 South Africa
- 14.1.4 Rest of Middle East and Africa
- 15. Competitive Analysis
- 15.1. Global Market Share Analysis 2024
- 15.2. Company Profiles
- 15.2.1 Wilmar International Limited
- 15.2.1.1. Overview
- 15.2.1.2. Products
- 15.2.1.3. SWOT Analysis
- 15.2.1.4. Recent Developments
- 15.2.1.5. Financials (Based on Availability)
- 15.2.2 Cargill Incorporated
- 15.2.2.1. Overview
- 15.2.2.2. Products
- 15.2.2.3. SWOT Analysis
- 15.2.2.4. Recent Developments
- 15.2.2.5. Financials (Based on Availability)
- 15.2.3 Archer Daniels Midland Co
- 15.2.3.1. Overview
- 15.2.3.2. Products
- 15.2.3.3. SWOT Analysis
- 15.2.3.4. Recent Developments
- 15.2.3.5. Financials (Based on Availability)
- 15.2.4 Edible Oil Company LLC*List Not Exhaustive
- 15.2.4.1. Overview
- 15.2.4.2. Products
- 15.2.4.3. SWOT Analysis
- 15.2.4.4. Recent Developments
- 15.2.4.5. Financials (Based on Availability)
- 15.2.5 Omani Vegetable Oils & Derivatives Co (L L C)
- 15.2.5.1. Overview
- 15.2.5.2. Products
- 15.2.5.3. SWOT Analysis
- 15.2.5.4. Recent Developments
- 15.2.5.5. Financials (Based on Availability)
- 15.2.6 Amira Nature Foods Ltd
- 15.2.6.1. Overview
- 15.2.6.2. Products
- 15.2.6.3. SWOT Analysis
- 15.2.6.4. Recent Developments
- 15.2.6.5. Financials (Based on Availability)
- 15.2.7 Al Ghurair
- 15.2.7.1. Overview
- 15.2.7.2. Products
- 15.2.7.3. SWOT Analysis
- 15.2.7.4. Recent Developments
- 15.2.7.5. Financials (Based on Availability)
- 15.2.8 Sime Darby Plantation Berhad
- 15.2.8.1. Overview
- 15.2.8.2. Products
- 15.2.8.3. SWOT Analysis
- 15.2.8.4. Recent Developments
- 15.2.8.5. Financials (Based on Availability)
- 15.2.9 ADVOC (ABU DHABI VEGETABLE OIL COMPANY)
- 15.2.9.1. Overview
- 15.2.9.2. Products
- 15.2.9.3. SWOT Analysis
- 15.2.9.4. Recent Developments
- 15.2.9.5. Financials (Based on Availability)
- 15.2.10 AJWA Group
- 15.2.10.1. Overview
- 15.2.10.2. Products
- 15.2.10.3. SWOT Analysis
- 15.2.10.4. Recent Developments
- 15.2.10.5. Financials (Based on Availability)
- 15.2.1 Wilmar International Limited
List of Figures
- Figure 1: Global MEA Vegetable Oil Market Revenue Breakdown (Million, %) by Region 2024 & 2032
- Figure 2: North America MEA Vegetable Oil Market Revenue (Million), by Country 2024 & 2032
- Figure 3: North America MEA Vegetable Oil Market Revenue Share (%), by Country 2024 & 2032
- Figure 4: Europe MEA Vegetable Oil Market Revenue (Million), by Country 2024 & 2032
- Figure 5: Europe MEA Vegetable Oil Market Revenue Share (%), by Country 2024 & 2032
- Figure 6: Asia Pacific MEA Vegetable Oil Market Revenue (Million), by Country 2024 & 2032
- Figure 7: Asia Pacific MEA Vegetable Oil Market Revenue Share (%), by Country 2024 & 2032
- Figure 8: South America MEA Vegetable Oil Market Revenue (Million), by Country 2024 & 2032
- Figure 9: South America MEA Vegetable Oil Market Revenue Share (%), by Country 2024 & 2032
- Figure 10: North America MEA Vegetable Oil Market Revenue (Million), by Country 2024 & 2032
- Figure 11: North America MEA Vegetable Oil Market Revenue Share (%), by Country 2024 & 2032
- Figure 12: MEA MEA Vegetable Oil Market Revenue (Million), by Country 2024 & 2032
- Figure 13: MEA MEA Vegetable Oil Market Revenue Share (%), by Country 2024 & 2032
- Figure 14: South Africa MEA Vegetable Oil Market Revenue (Million), by Product Type 2024 & 2032
- Figure 15: South Africa MEA Vegetable Oil Market Revenue Share (%), by Product Type 2024 & 2032
- Figure 16: South Africa MEA Vegetable Oil Market Revenue (Million), by Application 2024 & 2032
- Figure 17: South Africa MEA Vegetable Oil Market Revenue Share (%), by Application 2024 & 2032
- Figure 18: South Africa MEA Vegetable Oil Market Revenue (Million), by Geography 2024 & 2032
- Figure 19: South Africa MEA Vegetable Oil Market Revenue Share (%), by Geography 2024 & 2032
- Figure 20: South Africa MEA Vegetable Oil Market Revenue (Million), by Country 2024 & 2032
- Figure 21: South Africa MEA Vegetable Oil Market Revenue Share (%), by Country 2024 & 2032
- Figure 22: United Arab Emirates MEA Vegetable Oil Market Revenue (Million), by Product Type 2024 & 2032
- Figure 23: United Arab Emirates MEA Vegetable Oil Market Revenue Share (%), by Product Type 2024 & 2032
- Figure 24: United Arab Emirates MEA Vegetable Oil Market Revenue (Million), by Application 2024 & 2032
- Figure 25: United Arab Emirates MEA Vegetable Oil Market Revenue Share (%), by Application 2024 & 2032
- Figure 26: United Arab Emirates MEA Vegetable Oil Market Revenue (Million), by Geography 2024 & 2032
- Figure 27: United Arab Emirates MEA Vegetable Oil Market Revenue Share (%), by Geography 2024 & 2032
- Figure 28: United Arab Emirates MEA Vegetable Oil Market Revenue (Million), by Country 2024 & 2032
- Figure 29: United Arab Emirates MEA Vegetable Oil Market Revenue Share (%), by Country 2024 & 2032
- Figure 30: Rest of Middle East and Africa MEA Vegetable Oil Market Revenue (Million), by Product Type 2024 & 2032
- Figure 31: Rest of Middle East and Africa MEA Vegetable Oil Market Revenue Share (%), by Product Type 2024 & 2032
- Figure 32: Rest of Middle East and Africa MEA Vegetable Oil Market Revenue (Million), by Application 2024 & 2032
- Figure 33: Rest of Middle East and Africa MEA Vegetable Oil Market Revenue Share (%), by Application 2024 & 2032
- Figure 34: Rest of Middle East and Africa MEA Vegetable Oil Market Revenue (Million), by Geography 2024 & 2032
- Figure 35: Rest of Middle East and Africa MEA Vegetable Oil Market Revenue Share (%), by Geography 2024 & 2032
- Figure 36: Rest of Middle East and Africa MEA Vegetable Oil Market Revenue (Million), by Country 2024 & 2032
- Figure 37: Rest of Middle East and Africa MEA Vegetable Oil Market Revenue Share (%), by Country 2024 & 2032
List of Tables
- Table 1: Global MEA Vegetable Oil Market Revenue Million Forecast, by Region 2019 & 2032
- Table 2: Global MEA Vegetable Oil Market Revenue Million Forecast, by Product Type 2019 & 2032
- Table 3: Global MEA Vegetable Oil Market Revenue Million Forecast, by Application 2019 & 2032
- Table 4: Global MEA Vegetable Oil Market Revenue Million Forecast, by Geography 2019 & 2032
- Table 5: Global MEA Vegetable Oil Market Revenue Million Forecast, by Region 2019 & 2032
- Table 6: Global MEA Vegetable Oil Market Revenue Million Forecast, by Country 2019 & 2032
- Table 7: United States MEA Vegetable Oil Market Revenue (Million) Forecast, by Application 2019 & 2032
- Table 8: Canada MEA Vegetable Oil Market Revenue (Million) Forecast, by Application 2019 & 2032
- Table 9: Mexico MEA Vegetable Oil Market Revenue (Million) Forecast, by Application 2019 & 2032
- Table 10: Global MEA Vegetable Oil Market Revenue Million Forecast, by Country 2019 & 2032
- Table 11: Germany MEA Vegetable Oil Market Revenue (Million) Forecast, by Application 2019 & 2032
- Table 12: United Kingdom MEA Vegetable Oil Market Revenue (Million) Forecast, by Application 2019 & 2032
- Table 13: France MEA Vegetable Oil Market Revenue (Million) Forecast, by Application 2019 & 2032
- Table 14: Spain MEA Vegetable Oil Market Revenue (Million) Forecast, by Application 2019 & 2032
- Table 15: Italy MEA Vegetable Oil Market Revenue (Million) Forecast, by Application 2019 & 2032
- Table 16: Spain MEA Vegetable Oil Market Revenue (Million) Forecast, by Application 2019 & 2032
- Table 17: Belgium MEA Vegetable Oil Market Revenue (Million) Forecast, by Application 2019 & 2032
- Table 18: Netherland MEA Vegetable Oil Market Revenue (Million) Forecast, by Application 2019 & 2032
- Table 19: Nordics MEA Vegetable Oil Market Revenue (Million) Forecast, by Application 2019 & 2032
- Table 20: Rest of Europe MEA Vegetable Oil Market Revenue (Million) Forecast, by Application 2019 & 2032
- Table 21: Global MEA Vegetable Oil Market Revenue Million Forecast, by Country 2019 & 2032
- Table 22: China MEA Vegetable Oil Market Revenue (Million) Forecast, by Application 2019 & 2032
- Table 23: Japan MEA Vegetable Oil Market Revenue (Million) Forecast, by Application 2019 & 2032
- Table 24: India MEA Vegetable Oil Market Revenue (Million) Forecast, by Application 2019 & 2032
- Table 25: South Korea MEA Vegetable Oil Market Revenue (Million) Forecast, by Application 2019 & 2032
- Table 26: Southeast Asia MEA Vegetable Oil Market Revenue (Million) Forecast, by Application 2019 & 2032
- Table 27: Australia MEA Vegetable Oil Market Revenue (Million) Forecast, by Application 2019 & 2032
- Table 28: Indonesia MEA Vegetable Oil Market Revenue (Million) Forecast, by Application 2019 & 2032
- Table 29: Phillipes MEA Vegetable Oil Market Revenue (Million) Forecast, by Application 2019 & 2032
- Table 30: Singapore MEA Vegetable Oil Market Revenue (Million) Forecast, by Application 2019 & 2032
- Table 31: Thailandc MEA Vegetable Oil Market Revenue (Million) Forecast, by Application 2019 & 2032
- Table 32: Rest of Asia Pacific MEA Vegetable Oil Market Revenue (Million) Forecast, by Application 2019 & 2032
- Table 33: Global MEA Vegetable Oil Market Revenue Million Forecast, by Country 2019 & 2032
- Table 34: Brazil MEA Vegetable Oil Market Revenue (Million) Forecast, by Application 2019 & 2032
- Table 35: Argentina MEA Vegetable Oil Market Revenue (Million) Forecast, by Application 2019 & 2032
- Table 36: Peru MEA Vegetable Oil Market Revenue (Million) Forecast, by Application 2019 & 2032
- Table 37: Chile MEA Vegetable Oil Market Revenue (Million) Forecast, by Application 2019 & 2032
- Table 38: Colombia MEA Vegetable Oil Market Revenue (Million) Forecast, by Application 2019 & 2032
- Table 39: Ecuador MEA Vegetable Oil Market Revenue (Million) Forecast, by Application 2019 & 2032
- Table 40: Venezuela MEA Vegetable Oil Market Revenue (Million) Forecast, by Application 2019 & 2032
- Table 41: Rest of South America MEA Vegetable Oil Market Revenue (Million) Forecast, by Application 2019 & 2032
- Table 42: Global MEA Vegetable Oil Market Revenue Million Forecast, by Country 2019 & 2032
- Table 43: United States MEA Vegetable Oil Market Revenue (Million) Forecast, by Application 2019 & 2032
- Table 44: Canada MEA Vegetable Oil Market Revenue (Million) Forecast, by Application 2019 & 2032
- Table 45: Mexico MEA Vegetable Oil Market Revenue (Million) Forecast, by Application 2019 & 2032
- Table 46: Global MEA Vegetable Oil Market Revenue Million Forecast, by Country 2019 & 2032
- Table 47: United Arab Emirates MEA Vegetable Oil Market Revenue (Million) Forecast, by Application 2019 & 2032
- Table 48: Saudi Arabia MEA Vegetable Oil Market Revenue (Million) Forecast, by Application 2019 & 2032
- Table 49: South Africa MEA Vegetable Oil Market Revenue (Million) Forecast, by Application 2019 & 2032
- Table 50: Rest of Middle East and Africa MEA Vegetable Oil Market Revenue (Million) Forecast, by Application 2019 & 2032
- Table 51: Global MEA Vegetable Oil Market Revenue Million Forecast, by Product Type 2019 & 2032
- Table 52: Global MEA Vegetable Oil Market Revenue Million Forecast, by Application 2019 & 2032
- Table 53: Global MEA Vegetable Oil Market Revenue Million Forecast, by Geography 2019 & 2032
- Table 54: Global MEA Vegetable Oil Market Revenue Million Forecast, by Country 2019 & 2032
- Table 55: Global MEA Vegetable Oil Market Revenue Million Forecast, by Product Type 2019 & 2032
- Table 56: Global MEA Vegetable Oil Market Revenue Million Forecast, by Application 2019 & 2032
- Table 57: Global MEA Vegetable Oil Market Revenue Million Forecast, by Geography 2019 & 2032
- Table 58: Global MEA Vegetable Oil Market Revenue Million Forecast, by Country 2019 & 2032
- Table 59: Global MEA Vegetable Oil Market Revenue Million Forecast, by Product Type 2019 & 2032
- Table 60: Global MEA Vegetable Oil Market Revenue Million Forecast, by Application 2019 & 2032
- Table 61: Global MEA Vegetable Oil Market Revenue Million Forecast, by Geography 2019 & 2032
- Table 62: Global MEA Vegetable Oil Market Revenue Million Forecast, by Country 2019 & 2032
Frequently Asked Questions
1. What is the projected Compound Annual Growth Rate (CAGR) of the MEA Vegetable Oil Market?
The projected CAGR is approximately 4.31%.
2. Which companies are prominent players in the MEA Vegetable Oil Market?
Key companies in the market include Wilmar International Limited, Cargill Incorporated, Archer Daniels Midland Co, Edible Oil Company LLC*List Not Exhaustive, Omani Vegetable Oils & Derivatives Co (L L C), Amira Nature Foods Ltd, Al Ghurair, Sime Darby Plantation Berhad, ADVOC (ABU DHABI VEGETABLE OIL COMPANY), AJWA Group.
3. What are the main segments of the MEA Vegetable Oil Market?
The market segments include Product Type, Application, Geography.
4. Can you provide details about the market size?
The market size is estimated to be USD XX Million as of 2022.
5. What are some drivers contributing to market growth?
Growing Demand for Plant Based Alternatives; Expanding Application of Pea Protein Toward Food Fortification.
6. What are the notable trends driving market growth?
Increasing Demand for Fortified Edible Oil.
7. Are there any restraints impacting market growth?
Low Awareness and Application of the Additive.
8. Can you provide examples of recent developments in the market?
In 2021, Al Ghurair announced that they are acquiring (EOCD), 'Edible Oil Company LLC' which is a major company in multi-seed, crushing over the regions of the Middle -East. Signing this deal is to expand its resources and business operations over Dubai and other Middle-Eastern countries.
9. What pricing options are available for accessing the report?
Pricing options include single-user, multi-user, and enterprise licenses priced at USD 4750, USD 5250, and USD 8750 respectively.
10. Is the market size provided in terms of value or volume?
The market size is provided in terms of value, measured in Million.
11. Are there any specific market keywords associated with the report?
Yes, the market keyword associated with the report is "MEA Vegetable Oil Market," which aids in identifying and referencing the specific market segment covered.
12. How do I determine which pricing option suits my needs best?
The pricing options vary based on user requirements and access needs. Individual users may opt for single-user licenses, while businesses requiring broader access may choose multi-user or enterprise licenses for cost-effective access to the report.
13. Are there any additional resources or data provided in the MEA Vegetable Oil Market report?
While the report offers comprehensive insights, it's advisable to review the specific contents or supplementary materials provided to ascertain if additional resources or data are available.
14. How can I stay updated on further developments or reports in the MEA Vegetable Oil Market?
To stay informed about further developments, trends, and reports in the MEA Vegetable Oil Market, consider subscribing to industry newsletters, following relevant companies and organizations, or regularly checking reputable industry news sources and publications.
Methodology
Step 1 - Identification of Relevant Samples Size from Population Database


Step 2 - Approaches for Defining Global Market Size (Value, Volume* & Price*)

Note*: In applicable scenarios
Step 3 - Data Sources
Primary Research
- Web Analytics
- Survey Reports
- Research Institute
- Latest Research Reports
- Opinion Leaders
Secondary Research
- Annual Reports
- White Paper
- Latest Press Release
- Industry Association
- Paid Database
- Investor Presentations

Step 4 - Data Triangulation
Involves using different sources of information in order to increase the validity of a study
These sources are likely to be stakeholders in a program - participants, other researchers, program staff, other community members, and so on.
Then we put all data in single framework & apply various statistical tools to find out the dynamic on the market.
During the analysis stage, feedback from the stakeholder groups would be compared to determine areas of agreement as well as areas of divergence


