
Key Insights
The global sports betting kiosk market is experiencing robust growth, fueled by the increasing popularity of sports betting, technological advancements in kiosk technology, and the expansion of regulated sports betting markets worldwide. The market's Compound Annual Growth Rate (CAGR) of 6.71% from 2019 to 2024 indicates a strong upward trajectory. This growth is driven by several key factors. Firstly, the convenience and anonymity offered by self-service kiosks are attracting a wider range of bettors, including those who might be hesitant to interact with traditional bookmakers. Secondly, the integration of advanced features like touchscreen interfaces, mobile payment options, and real-time odds updates enhances the user experience and drives adoption. Finally, the strategic placement of kiosks in high-traffic locations such as sports stadiums, casinos, and retail outlets maximizes visibility and accessibility. Segmentation analysis reveals that indoor kiosks currently hold a larger market share compared to outdoor kiosks due to factors such as weather protection and security. However, the outdoor kiosk segment is expected to witness significant growth in the coming years, particularly in locations with favorable climates and strong sporting cultures. The end-user segment is dominated by casinos and sports clubs/stadiums, reflecting the strategic positioning of kiosks in venues where betting activity is concentrated. However, the increasing adoption in hotels, restaurants, and retail spaces indicates a broadening market reach.
Looking ahead, the forecast period (2025-2033) anticipates continued growth, driven by factors such as the increasing legalization of online and retail sports betting in various jurisdictions globally, continued technological innovation, and the expansion of sports betting into new markets. However, challenges remain, including regulatory hurdles in certain regions, concerns about responsible gambling, and the potential for competition from online betting platforms. The competitive landscape is characterized by a mix of established players and emerging technology companies, leading to innovation and market consolidation. Companies are focusing on developing advanced features, such as personalized betting experiences and enhanced security measures, to gain a competitive edge. The regional distribution of the market is expected to vary, with North America and Europe likely maintaining strong positions due to the established sports betting industry and regulatory frameworks. However, the Asia-Pacific region is expected to experience significant growth due to increasing disposable income and rising popularity of sports. Successful players in this dynamic market will need to adapt to evolving regulations, technological advancements, and the changing preferences of bettors.
Sports Betting Kiosk Market: A Comprehensive Report (2019-2033)
This in-depth report provides a comprehensive analysis of the Sports Betting Kiosk Market, encompassing market dynamics, growth trends, regional dominance, product landscape, key players, and future outlook. The study period covers 2019-2033, with 2025 as the base and estimated year, and a forecast period of 2025-2033. The historical period analyzed is 2019-2024. The report focuses on the parent market of gaming kiosks and the child market of sports betting kiosks, offering granular insights for industry professionals. The market size is projected to reach xx Million by 2033.
Sports Betting Kiosk Market Dynamics & Structure
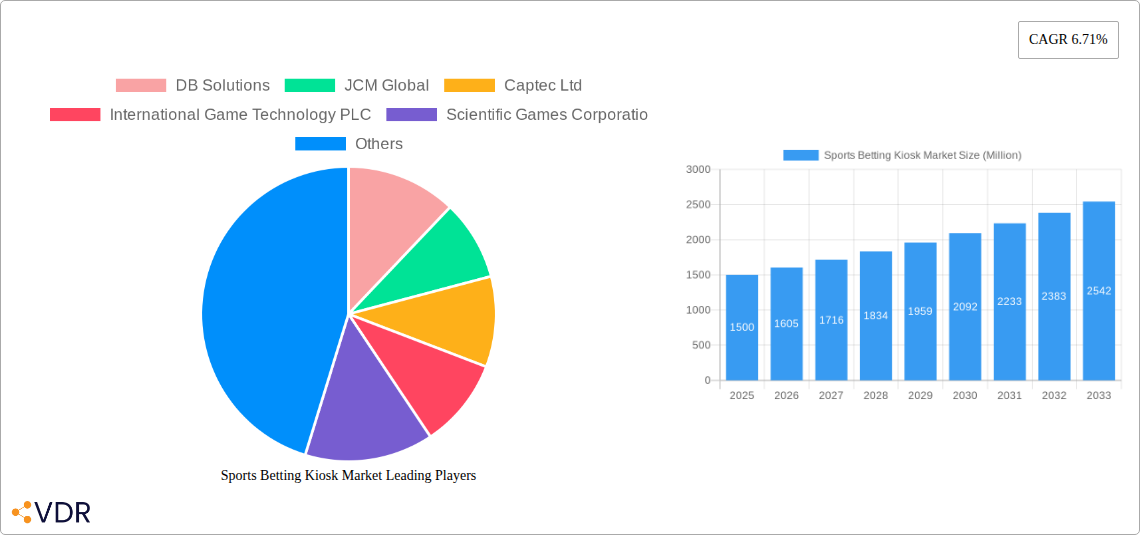
The Sports Betting Kiosk market exhibits a moderately concentrated structure, with key players like DB Solutions, JCM Global, and International Game Technology PLC holding significant market share. Technological innovation, particularly in areas like touch-screen interfaces, secure payment integration, and enhanced data analytics, is a major driver. Regulatory frameworks, varying significantly across jurisdictions, influence market expansion and adoption rates. The emergence of alternative betting methods, such as online platforms, poses competitive pressure. The end-user demographics are expanding beyond traditional casinos to encompass hotels, restaurants, sports stadiums, and even cruise ships. M&A activity has been moderate, with strategic partnerships playing a larger role in market consolidation.
- Market Concentration: Moderately concentrated, with top 5 players holding approximately xx% market share in 2025.
- Technological Innovation: Focus on enhanced user experience, secure transactions, and data analytics.
- Regulatory Landscape: Significant variations across regions impacting market access and growth.
- Competitive Substitutes: Online betting platforms pose a significant competitive threat.
- End-User Demographics: Expansion beyond casinos to diverse venues like sports stadiums and retail locations.
- M&A Activity: Moderate, with strategic partnerships being more prevalent than outright acquisitions. xx M&A deals recorded between 2019-2024.
Sports Betting Kiosk Market Growth Trends & Insights
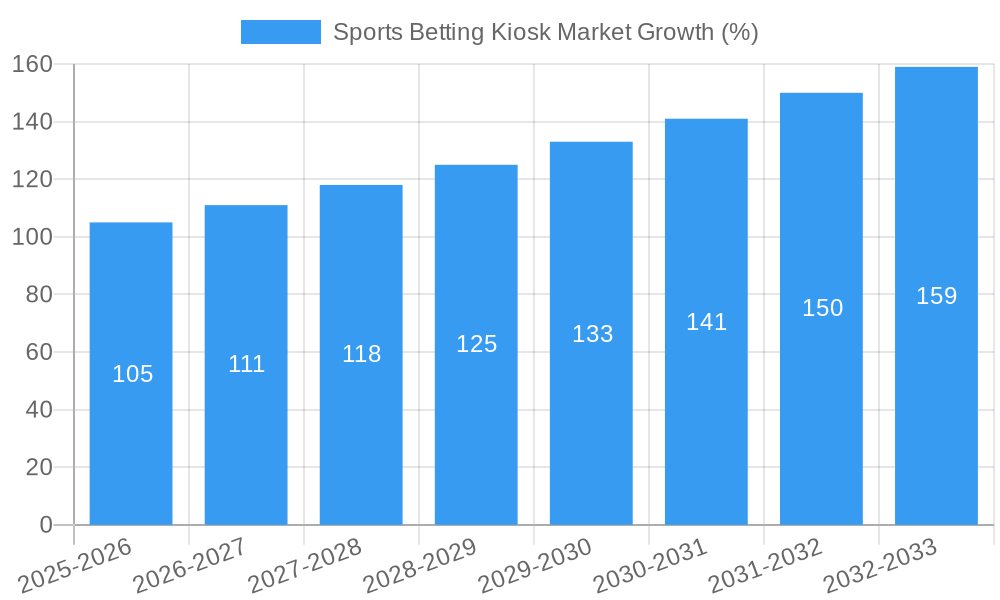
The Sports Betting Kiosk market has witnessed robust growth over the past few years, driven by the increasing popularity of sports betting and the expansion of legalized gambling. The market size is estimated at xx Million in 2025 and is projected to exhibit a CAGR of xx% during the forecast period (2025-2033), reaching xx Million by 2033. This growth is fueled by technological advancements, evolving consumer preferences towards convenient and interactive betting experiences, and the expansion of sports betting into new markets. The rising adoption rate of contactless payment methods further contributes to market expansion. Technological disruptions, such as the integration of AI and machine learning for personalized betting recommendations, are shaping consumer behavior.
Dominant Regions, Countries, or Segments in Sports Betting Kiosk Market
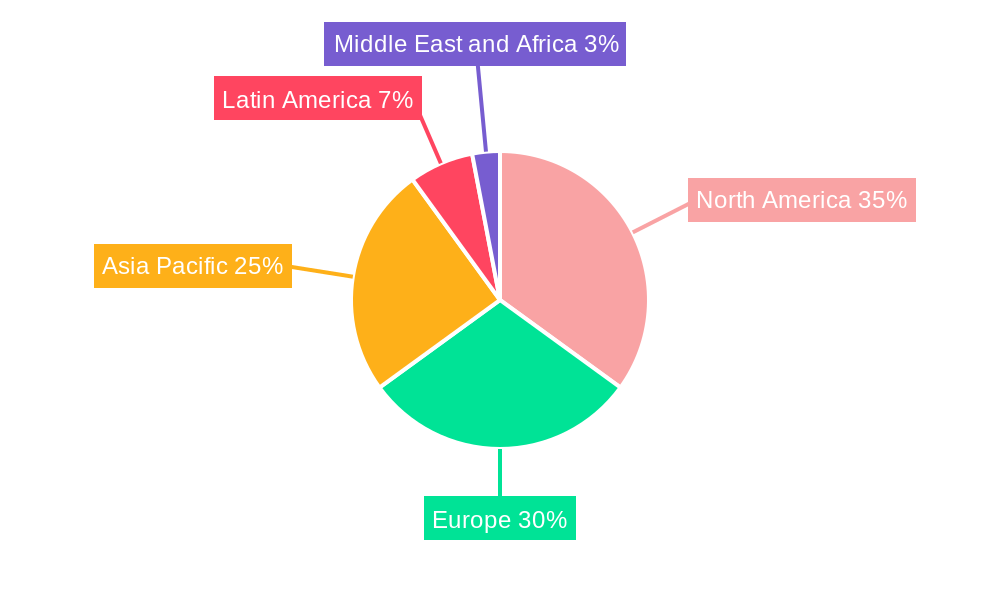
North America currently dominates the Sports Betting Kiosk market, driven by the rapid legalization and expansion of sports betting across several states. Europe is also a significant market, with various countries showing strong adoption rates. The indoor kiosk segment currently holds the largest market share within the application segment, followed by outdoor kiosks and eSports. Casinos remain the leading end-user segment due to their established infrastructure and customer base.
- Key Regional Drivers: North America (legalization & expansion of sports betting), Europe (increasing regulatory clarity and adoption), Asia-Pacific (emerging markets with strong growth potential).
- Dominant Segments: Indoor kiosks (ease of integration and higher foot traffic), Casinos (established infrastructure and large customer base).
- Growth Potential: Emerging markets in Asia-Pacific and Latin America offer significant untapped potential.
Sports Betting Kiosk Market Product Landscape
Sports betting kiosks are evolving from basic betting terminals to sophisticated, user-friendly systems offering a wide range of features. These include touch-screen interfaces, secure payment options (including contactless payments), real-time odds updates, game statistics, and personalized betting recommendations. Innovations focus on enhanced security features, improved user experience, and integration with loyalty programs. Key differentiators include speed of transaction processing, ease of use, and the range of betting options offered.
Key Drivers, Barriers & Challenges in Sports Betting Kiosk Market
Key Drivers:
- Increasing legalization and regulation of sports betting.
- Growing popularity of sports betting, particularly among younger demographics.
- Technological advancements enhancing user experience and security.
- Expansion of sports betting into new markets and venues.
Key Challenges:
- Regulatory hurdles and variations across different jurisdictions.
- Competition from online betting platforms.
- Security concerns related to fraud and data breaches.
- High initial investment costs for kiosk deployment and maintenance. The estimated cost of implementing a single kiosk ranges from xx Million to xx Million.
Emerging Opportunities in Sports Betting Kiosk Market
- Expanding into untapped markets in developing economies.
- Integrating advanced technologies such as AI and blockchain for enhanced security and personalization.
- Developing innovative kiosk designs for specific venues (e.g., smaller kiosks for retail environments).
- Offering personalized betting experiences tailored to individual customer preferences.
Growth Accelerators in the Sports Betting Kiosk Market Industry
Strategic partnerships between kiosk manufacturers and sports betting operators are driving market expansion. Technological advancements, such as improved user interfaces and secure payment systems, are enhancing the appeal of sports betting kiosks. The expansion of sports betting into new markets and venues is creating new opportunities for growth.
Key Players Shaping the Sports Betting Kiosk Market Market
- DB Solutions
- JCM Global
- Captec Ltd
- International Game Technology PLC
- Scientific Games Corporation
- KIOSK Information Systems
- Olea Kiosks Inc
- Kambi Group PLC
- SBTech Malta Limited
- NOVOMATIC Sports Betting Solutions
Notable Milestones in Sports Betting Kiosk Market Sector
- July 2023: Table Trac, Inc. announces a joint venture with Centennial Gaming Systems for unattended loyalty card services, expanding kiosk applications beyond core betting functionalities.
- February 2023: Playtech partners with Gold Rush Gaming to expand its sports betting kiosk software and management systems into the Ohio market, highlighting the growing demand for integrated solutions.
- Ongoing: The American Gaming Association (AGA) projects a USD 16 billion surge in US sports betting, indicating substantial growth potential for the kiosk market.
In-Depth Sports Betting Kiosk Market Market Outlook
The Sports Betting Kiosk market is poised for continued growth, driven by the increasing adoption of sports betting and technological innovation. Strategic partnerships, expansion into new markets, and the development of innovative kiosk functionalities will shape the market landscape. The focus on enhanced security, user experience, and integration with other betting platforms will be key success factors for market players. The market presents significant opportunities for both established players and new entrants.
Sports Betting Kiosk Market Segmentation
-
1. Application
- 1.1. Indoor kiosks
- 1.2. outdoor kiosks
- 1.3. eSports
-
2. End-User
- 2.1. Hotels
- 2.2. Restaurants
- 2.3. Retail Shopping
- 2.4. Casinos
- 2.5. Sports Clubs/Sports Stadiums
- 2.6. Cruise Ships
Sports Betting Kiosk Market Segmentation By Geography
- 1. North America
- 2. Europe
- 3. Asia
- 4. Australia and New Zealand
- 5. Latin America
- 6. Middle East and Africa
Sports Betting Kiosk Market REPORT HIGHLIGHTS
| Aspects | Details |
|---|---|
| Study Period | 2019-2033 |
| Base Year | 2024 |
| Estimated Year | 2025 |
| Forecast Period | 2025-2033 |
| Historical Period | 2019-2024 |
| Growth Rate | CAGR of 6.71% from 2019-2033 |
| Segmentation |
|
Table of Contents
- 1. Introduction
- 1.1. Research Scope
- 1.2. Market Segmentation
- 1.3. Research Methodology
- 1.4. Definitions and Assumptions
- 2. Executive Summary
- 2.1. Introduction
- 3. Market Dynamics
- 3.1. Introduction
- 3.2. Market Drivers
- 3.2.1. sports betting with minimal space and Increase in customer transactions; Growing demand for automated selfoservice kiosks solution
- 3.3. Market Restrains
- 3.3.1. Cyber Security concerns may hinder the growth of the sports betting kiosk market
- 3.4. Market Trends
- 3.4.1. Retail and Casino will dominate the Market
- 4. Market Factor Analysis
- 4.1. Porters Five Forces
- 4.2. Supply/Value Chain
- 4.3. PESTEL analysis
- 4.4. Market Entropy
- 4.5. Patent/Trademark Analysis
- 5. Global Sports Betting Kiosk Market Analysis, Insights and Forecast, 2019-2031
- 5.1. Market Analysis, Insights and Forecast - by Application
- 5.1.1. Indoor kiosks
- 5.1.2. outdoor kiosks
- 5.1.3. eSports
- 5.2. Market Analysis, Insights and Forecast - by End-User
- 5.2.1. Hotels
- 5.2.2. Restaurants
- 5.2.3. Retail Shopping
- 5.2.4. Casinos
- 5.2.5. Sports Clubs/Sports Stadiums
- 5.2.6. Cruise Ships
- 5.3. Market Analysis, Insights and Forecast - by Region
- 5.3.1. North America
- 5.3.2. Europe
- 5.3.3. Asia
- 5.3.4. Australia and New Zealand
- 5.3.5. Latin America
- 5.3.6. Middle East and Africa
- 5.1. Market Analysis, Insights and Forecast - by Application
- 6. North America Sports Betting Kiosk Market Analysis, Insights and Forecast, 2019-2031
- 6.1. Market Analysis, Insights and Forecast - by Application
- 6.1.1. Indoor kiosks
- 6.1.2. outdoor kiosks
- 6.1.3. eSports
- 6.2. Market Analysis, Insights and Forecast - by End-User
- 6.2.1. Hotels
- 6.2.2. Restaurants
- 6.2.3. Retail Shopping
- 6.2.4. Casinos
- 6.2.5. Sports Clubs/Sports Stadiums
- 6.2.6. Cruise Ships
- 6.1. Market Analysis, Insights and Forecast - by Application
- 7. Europe Sports Betting Kiosk Market Analysis, Insights and Forecast, 2019-2031
- 7.1. Market Analysis, Insights and Forecast - by Application
- 7.1.1. Indoor kiosks
- 7.1.2. outdoor kiosks
- 7.1.3. eSports
- 7.2. Market Analysis, Insights and Forecast - by End-User
- 7.2.1. Hotels
- 7.2.2. Restaurants
- 7.2.3. Retail Shopping
- 7.2.4. Casinos
- 7.2.5. Sports Clubs/Sports Stadiums
- 7.2.6. Cruise Ships
- 7.1. Market Analysis, Insights and Forecast - by Application
- 8. Asia Sports Betting Kiosk Market Analysis, Insights and Forecast, 2019-2031
- 8.1. Market Analysis, Insights and Forecast - by Application
- 8.1.1. Indoor kiosks
- 8.1.2. outdoor kiosks
- 8.1.3. eSports
- 8.2. Market Analysis, Insights and Forecast - by End-User
- 8.2.1. Hotels
- 8.2.2. Restaurants
- 8.2.3. Retail Shopping
- 8.2.4. Casinos
- 8.2.5. Sports Clubs/Sports Stadiums
- 8.2.6. Cruise Ships
- 8.1. Market Analysis, Insights and Forecast - by Application
- 9. Australia and New Zealand Sports Betting Kiosk Market Analysis, Insights and Forecast, 2019-2031
- 9.1. Market Analysis, Insights and Forecast - by Application
- 9.1.1. Indoor kiosks
- 9.1.2. outdoor kiosks
- 9.1.3. eSports
- 9.2. Market Analysis, Insights and Forecast - by End-User
- 9.2.1. Hotels
- 9.2.2. Restaurants
- 9.2.3. Retail Shopping
- 9.2.4. Casinos
- 9.2.5. Sports Clubs/Sports Stadiums
- 9.2.6. Cruise Ships
- 9.1. Market Analysis, Insights and Forecast - by Application
- 10. Latin America Sports Betting Kiosk Market Analysis, Insights and Forecast, 2019-2031
- 10.1. Market Analysis, Insights and Forecast - by Application
- 10.1.1. Indoor kiosks
- 10.1.2. outdoor kiosks
- 10.1.3. eSports
- 10.2. Market Analysis, Insights and Forecast - by End-User
- 10.2.1. Hotels
- 10.2.2. Restaurants
- 10.2.3. Retail Shopping
- 10.2.4. Casinos
- 10.2.5. Sports Clubs/Sports Stadiums
- 10.2.6. Cruise Ships
- 10.1. Market Analysis, Insights and Forecast - by Application
- 11. Middle East and Africa Sports Betting Kiosk Market Analysis, Insights and Forecast, 2019-2031
- 11.1. Market Analysis, Insights and Forecast - by Application
- 11.1.1. Indoor kiosks
- 11.1.2. outdoor kiosks
- 11.1.3. eSports
- 11.2. Market Analysis, Insights and Forecast - by End-User
- 11.2.1. Hotels
- 11.2.2. Restaurants
- 11.2.3. Retail Shopping
- 11.2.4. Casinos
- 11.2.5. Sports Clubs/Sports Stadiums
- 11.2.6. Cruise Ships
- 11.1. Market Analysis, Insights and Forecast - by Application
- 12. North America Sports Betting Kiosk Market Analysis, Insights and Forecast, 2019-2031
- 12.1. Market Analysis, Insights and Forecast - By Country/Sub-region
- 12.1.1.
- 13. Europe Sports Betting Kiosk Market Analysis, Insights and Forecast, 2019-2031
- 13.1. Market Analysis, Insights and Forecast - By Country/Sub-region
- 13.1.1.
- 14. Asia Pacific Sports Betting Kiosk Market Analysis, Insights and Forecast, 2019-2031
- 14.1. Market Analysis, Insights and Forecast - By Country/Sub-region
- 14.1.1.
- 15. Latin America Sports Betting Kiosk Market Analysis, Insights and Forecast, 2019-2031
- 15.1. Market Analysis, Insights and Forecast - By Country/Sub-region
- 15.1.1.
- 16. Middle East and Africa Sports Betting Kiosk Market Analysis, Insights and Forecast, 2019-2031
- 16.1. Market Analysis, Insights and Forecast - By Country/Sub-region
- 16.1.1.
- 17. Competitive Analysis
- 17.1. Global Market Share Analysis 2024
- 17.2. Company Profiles
- 17.2.1 DB Solutions
- 17.2.1.1. Overview
- 17.2.1.2. Products
- 17.2.1.3. SWOT Analysis
- 17.2.1.4. Recent Developments
- 17.2.1.5. Financials (Based on Availability)
- 17.2.2 JCM Global
- 17.2.2.1. Overview
- 17.2.2.2. Products
- 17.2.2.3. SWOT Analysis
- 17.2.2.4. Recent Developments
- 17.2.2.5. Financials (Based on Availability)
- 17.2.3 Captec Ltd
- 17.2.3.1. Overview
- 17.2.3.2. Products
- 17.2.3.3. SWOT Analysis
- 17.2.3.4. Recent Developments
- 17.2.3.5. Financials (Based on Availability)
- 17.2.4 International Game Technology PLC
- 17.2.4.1. Overview
- 17.2.4.2. Products
- 17.2.4.3. SWOT Analysis
- 17.2.4.4. Recent Developments
- 17.2.4.5. Financials (Based on Availability)
- 17.2.5 Scientific Games Corporatio
- 17.2.5.1. Overview
- 17.2.5.2. Products
- 17.2.5.3. SWOT Analysis
- 17.2.5.4. Recent Developments
- 17.2.5.5. Financials (Based on Availability)
- 17.2.6 KIOSK Information Systems
- 17.2.6.1. Overview
- 17.2.6.2. Products
- 17.2.6.3. SWOT Analysis
- 17.2.6.4. Recent Developments
- 17.2.6.5. Financials (Based on Availability)
- 17.2.7 Olea Kiosks Inc
- 17.2.7.1. Overview
- 17.2.7.2. Products
- 17.2.7.3. SWOT Analysis
- 17.2.7.4. Recent Developments
- 17.2.7.5. Financials (Based on Availability)
- 17.2.8 Kambi Group PLC
- 17.2.8.1. Overview
- 17.2.8.2. Products
- 17.2.8.3. SWOT Analysis
- 17.2.8.4. Recent Developments
- 17.2.8.5. Financials (Based on Availability)
- 17.2.9 SBTech Malta Limited
- 17.2.9.1. Overview
- 17.2.9.2. Products
- 17.2.9.3. SWOT Analysis
- 17.2.9.4. Recent Developments
- 17.2.9.5. Financials (Based on Availability)
- 17.2.10 NOVOMATIC Sports Betting Solutions
- 17.2.10.1. Overview
- 17.2.10.2. Products
- 17.2.10.3. SWOT Analysis
- 17.2.10.4. Recent Developments
- 17.2.10.5. Financials (Based on Availability)
- 17.2.1 DB Solutions
List of Figures
- Figure 1: Global Sports Betting Kiosk Market Revenue Breakdown (Million, %) by Region 2024 & 2032
- Figure 2: North America Sports Betting Kiosk Market Revenue (Million), by Country 2024 & 2032
- Figure 3: North America Sports Betting Kiosk Market Revenue Share (%), by Country 2024 & 2032
- Figure 4: Europe Sports Betting Kiosk Market Revenue (Million), by Country 2024 & 2032
- Figure 5: Europe Sports Betting Kiosk Market Revenue Share (%), by Country 2024 & 2032
- Figure 6: Asia Pacific Sports Betting Kiosk Market Revenue (Million), by Country 2024 & 2032
- Figure 7: Asia Pacific Sports Betting Kiosk Market Revenue Share (%), by Country 2024 & 2032
- Figure 8: Latin America Sports Betting Kiosk Market Revenue (Million), by Country 2024 & 2032
- Figure 9: Latin America Sports Betting Kiosk Market Revenue Share (%), by Country 2024 & 2032
- Figure 10: Middle East and Africa Sports Betting Kiosk Market Revenue (Million), by Country 2024 & 2032
- Figure 11: Middle East and Africa Sports Betting Kiosk Market Revenue Share (%), by Country 2024 & 2032
- Figure 12: North America Sports Betting Kiosk Market Revenue (Million), by Application 2024 & 2032
- Figure 13: North America Sports Betting Kiosk Market Revenue Share (%), by Application 2024 & 2032
- Figure 14: North America Sports Betting Kiosk Market Revenue (Million), by End-User 2024 & 2032
- Figure 15: North America Sports Betting Kiosk Market Revenue Share (%), by End-User 2024 & 2032
- Figure 16: North America Sports Betting Kiosk Market Revenue (Million), by Country 2024 & 2032
- Figure 17: North America Sports Betting Kiosk Market Revenue Share (%), by Country 2024 & 2032
- Figure 18: Europe Sports Betting Kiosk Market Revenue (Million), by Application 2024 & 2032
- Figure 19: Europe Sports Betting Kiosk Market Revenue Share (%), by Application 2024 & 2032
- Figure 20: Europe Sports Betting Kiosk Market Revenue (Million), by End-User 2024 & 2032
- Figure 21: Europe Sports Betting Kiosk Market Revenue Share (%), by End-User 2024 & 2032
- Figure 22: Europe Sports Betting Kiosk Market Revenue (Million), by Country 2024 & 2032
- Figure 23: Europe Sports Betting Kiosk Market Revenue Share (%), by Country 2024 & 2032
- Figure 24: Asia Sports Betting Kiosk Market Revenue (Million), by Application 2024 & 2032
- Figure 25: Asia Sports Betting Kiosk Market Revenue Share (%), by Application 2024 & 2032
- Figure 26: Asia Sports Betting Kiosk Market Revenue (Million), by End-User 2024 & 2032
- Figure 27: Asia Sports Betting Kiosk Market Revenue Share (%), by End-User 2024 & 2032
- Figure 28: Asia Sports Betting Kiosk Market Revenue (Million), by Country 2024 & 2032
- Figure 29: Asia Sports Betting Kiosk Market Revenue Share (%), by Country 2024 & 2032
- Figure 30: Australia and New Zealand Sports Betting Kiosk Market Revenue (Million), by Application 2024 & 2032
- Figure 31: Australia and New Zealand Sports Betting Kiosk Market Revenue Share (%), by Application 2024 & 2032
- Figure 32: Australia and New Zealand Sports Betting Kiosk Market Revenue (Million), by End-User 2024 & 2032
- Figure 33: Australia and New Zealand Sports Betting Kiosk Market Revenue Share (%), by End-User 2024 & 2032
- Figure 34: Australia and New Zealand Sports Betting Kiosk Market Revenue (Million), by Country 2024 & 2032
- Figure 35: Australia and New Zealand Sports Betting Kiosk Market Revenue Share (%), by Country 2024 & 2032
- Figure 36: Latin America Sports Betting Kiosk Market Revenue (Million), by Application 2024 & 2032
- Figure 37: Latin America Sports Betting Kiosk Market Revenue Share (%), by Application 2024 & 2032
- Figure 38: Latin America Sports Betting Kiosk Market Revenue (Million), by End-User 2024 & 2032
- Figure 39: Latin America Sports Betting Kiosk Market Revenue Share (%), by End-User 2024 & 2032
- Figure 40: Latin America Sports Betting Kiosk Market Revenue (Million), by Country 2024 & 2032
- Figure 41: Latin America Sports Betting Kiosk Market Revenue Share (%), by Country 2024 & 2032
- Figure 42: Middle East and Africa Sports Betting Kiosk Market Revenue (Million), by Application 2024 & 2032
- Figure 43: Middle East and Africa Sports Betting Kiosk Market Revenue Share (%), by Application 2024 & 2032
- Figure 44: Middle East and Africa Sports Betting Kiosk Market Revenue (Million), by End-User 2024 & 2032
- Figure 45: Middle East and Africa Sports Betting Kiosk Market Revenue Share (%), by End-User 2024 & 2032
- Figure 46: Middle East and Africa Sports Betting Kiosk Market Revenue (Million), by Country 2024 & 2032
- Figure 47: Middle East and Africa Sports Betting Kiosk Market Revenue Share (%), by Country 2024 & 2032
List of Tables
- Table 1: Global Sports Betting Kiosk Market Revenue Million Forecast, by Region 2019 & 2032
- Table 2: Global Sports Betting Kiosk Market Revenue Million Forecast, by Application 2019 & 2032
- Table 3: Global Sports Betting Kiosk Market Revenue Million Forecast, by End-User 2019 & 2032
- Table 4: Global Sports Betting Kiosk Market Revenue Million Forecast, by Region 2019 & 2032
- Table 5: Global Sports Betting Kiosk Market Revenue Million Forecast, by Country 2019 & 2032
- Table 6: Sports Betting Kiosk Market Revenue (Million) Forecast, by Application 2019 & 2032
- Table 7: Global Sports Betting Kiosk Market Revenue Million Forecast, by Country 2019 & 2032
- Table 8: Sports Betting Kiosk Market Revenue (Million) Forecast, by Application 2019 & 2032
- Table 9: Global Sports Betting Kiosk Market Revenue Million Forecast, by Country 2019 & 2032
- Table 10: Sports Betting Kiosk Market Revenue (Million) Forecast, by Application 2019 & 2032
- Table 11: Global Sports Betting Kiosk Market Revenue Million Forecast, by Country 2019 & 2032
- Table 12: Sports Betting Kiosk Market Revenue (Million) Forecast, by Application 2019 & 2032
- Table 13: Global Sports Betting Kiosk Market Revenue Million Forecast, by Country 2019 & 2032
- Table 14: Sports Betting Kiosk Market Revenue (Million) Forecast, by Application 2019 & 2032
- Table 15: Global Sports Betting Kiosk Market Revenue Million Forecast, by Application 2019 & 2032
- Table 16: Global Sports Betting Kiosk Market Revenue Million Forecast, by End-User 2019 & 2032
- Table 17: Global Sports Betting Kiosk Market Revenue Million Forecast, by Country 2019 & 2032
- Table 18: Global Sports Betting Kiosk Market Revenue Million Forecast, by Application 2019 & 2032
- Table 19: Global Sports Betting Kiosk Market Revenue Million Forecast, by End-User 2019 & 2032
- Table 20: Global Sports Betting Kiosk Market Revenue Million Forecast, by Country 2019 & 2032
- Table 21: Global Sports Betting Kiosk Market Revenue Million Forecast, by Application 2019 & 2032
- Table 22: Global Sports Betting Kiosk Market Revenue Million Forecast, by End-User 2019 & 2032
- Table 23: Global Sports Betting Kiosk Market Revenue Million Forecast, by Country 2019 & 2032
- Table 24: Global Sports Betting Kiosk Market Revenue Million Forecast, by Application 2019 & 2032
- Table 25: Global Sports Betting Kiosk Market Revenue Million Forecast, by End-User 2019 & 2032
- Table 26: Global Sports Betting Kiosk Market Revenue Million Forecast, by Country 2019 & 2032
- Table 27: Global Sports Betting Kiosk Market Revenue Million Forecast, by Application 2019 & 2032
- Table 28: Global Sports Betting Kiosk Market Revenue Million Forecast, by End-User 2019 & 2032
- Table 29: Global Sports Betting Kiosk Market Revenue Million Forecast, by Country 2019 & 2032
- Table 30: Global Sports Betting Kiosk Market Revenue Million Forecast, by Application 2019 & 2032
- Table 31: Global Sports Betting Kiosk Market Revenue Million Forecast, by End-User 2019 & 2032
- Table 32: Global Sports Betting Kiosk Market Revenue Million Forecast, by Country 2019 & 2032
Frequently Asked Questions
1. What is the projected Compound Annual Growth Rate (CAGR) of the Sports Betting Kiosk Market?
The projected CAGR is approximately 6.71%.
2. Which companies are prominent players in the Sports Betting Kiosk Market?
Key companies in the market include DB Solutions, JCM Global, Captec Ltd, International Game Technology PLC, Scientific Games Corporatio, KIOSK Information Systems, Olea Kiosks Inc, Kambi Group PLC, SBTech Malta Limited, NOVOMATIC Sports Betting Solutions.
3. What are the main segments of the Sports Betting Kiosk Market?
The market segments include Application, End-User.
4. Can you provide details about the market size?
The market size is estimated to be USD XX Million as of 2022.
5. What are some drivers contributing to market growth?
sports betting with minimal space and Increase in customer transactions; Growing demand for automated selfoservice kiosks solution.
6. What are the notable trends driving market growth?
Retail and Casino will dominate the Market.
7. Are there any restraints impacting market growth?
Cyber Security concerns may hinder the growth of the sports betting kiosk market.
8. Can you provide examples of recent developments in the market?
July 2023 - Table Trac, Inc., the provider of CasinoTrac, a comprehensive casino information and management system that automates and monitors casino operations, announced a Joint Venture with Centennial Gaming Systems aimed at offering unattended loyalty card re-printing and enrollment services.
9. What pricing options are available for accessing the report?
Pricing options include single-user, multi-user, and enterprise licenses priced at USD 4750, USD 5250, and USD 8750 respectively.
10. Is the market size provided in terms of value or volume?
The market size is provided in terms of value, measured in Million.
11. Are there any specific market keywords associated with the report?
Yes, the market keyword associated with the report is "Sports Betting Kiosk Market," which aids in identifying and referencing the specific market segment covered.
12. How do I determine which pricing option suits my needs best?
The pricing options vary based on user requirements and access needs. Individual users may opt for single-user licenses, while businesses requiring broader access may choose multi-user or enterprise licenses for cost-effective access to the report.
13. Are there any additional resources or data provided in the Sports Betting Kiosk Market report?
While the report offers comprehensive insights, it's advisable to review the specific contents or supplementary materials provided to ascertain if additional resources or data are available.
14. How can I stay updated on further developments or reports in the Sports Betting Kiosk Market?
To stay informed about further developments, trends, and reports in the Sports Betting Kiosk Market, consider subscribing to industry newsletters, following relevant companies and organizations, or regularly checking reputable industry news sources and publications.
Methodology
Step 1 - Identification of Relevant Samples Size from Population Database


Step 2 - Approaches for Defining Global Market Size (Value, Volume* & Price*)

Note*: In applicable scenarios
Step 3 - Data Sources
Primary Research
- Web Analytics
- Survey Reports
- Research Institute
- Latest Research Reports
- Opinion Leaders
Secondary Research
- Annual Reports
- White Paper
- Latest Press Release
- Industry Association
- Paid Database
- Investor Presentations

Step 4 - Data Triangulation
Involves using different sources of information in order to increase the validity of a study
These sources are likely to be stakeholders in a program - participants, other researchers, program staff, other community members, and so on.
Then we put all data in single framework & apply various statistical tools to find out the dynamic on the market.
During the analysis stage, feedback from the stakeholder groups would be compared to determine areas of agreement as well as areas of divergence


