

Key Insights
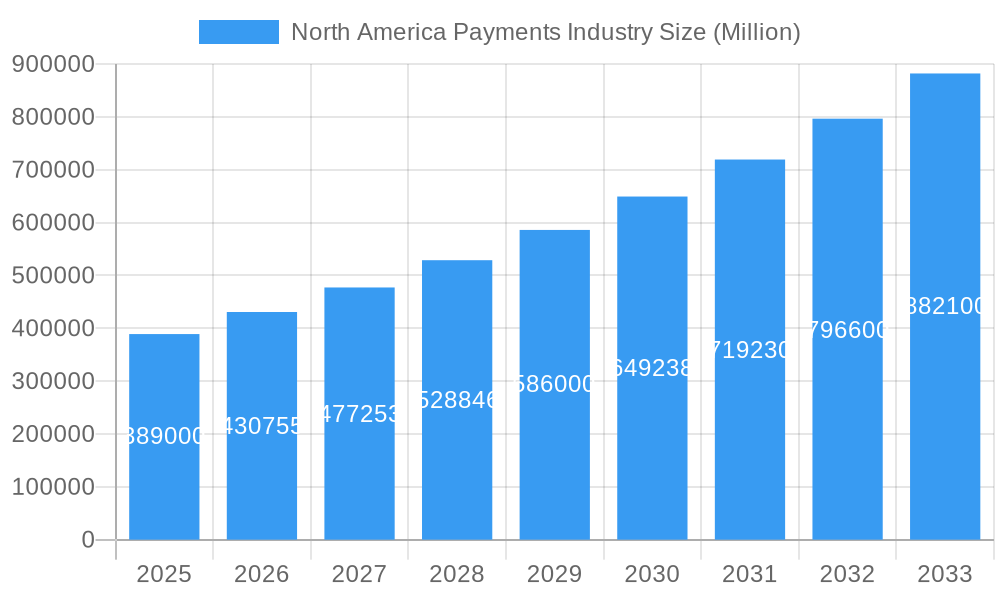
The North American payments industry, valued at $389 billion in 2025, is experiencing robust growth, projected to expand at a Compound Annual Growth Rate (CAGR) of 10.45% from 2025 to 2033. This expansion is fueled by several key drivers. The increasing adoption of e-commerce and digital wallets, such as Apple Pay and Google Pay, is significantly contributing to this growth. Furthermore, the rising prevalence of contactless payments, driven by consumer preference for speed and convenience, particularly post-pandemic, is accelerating the shift away from traditional cash and card transactions. The expansion of the FinTech sector, with companies like PayPal and Square offering innovative payment solutions, also fuels the market's expansion. Within the North American market, the United States holds the largest share, followed by Canada, with significant growth potential in Mexico and other regions. Segmentation analysis reveals that the retail sector dominates end-user industry spending, followed by entertainment, healthcare, and hospitality. Online sales are a rapidly growing segment, reflecting the overall digital transformation across various sectors. The point-of-sale (POS) mode of payment still constitutes a significant portion of the market, although it's increasingly complemented by digital and mobile payment options.
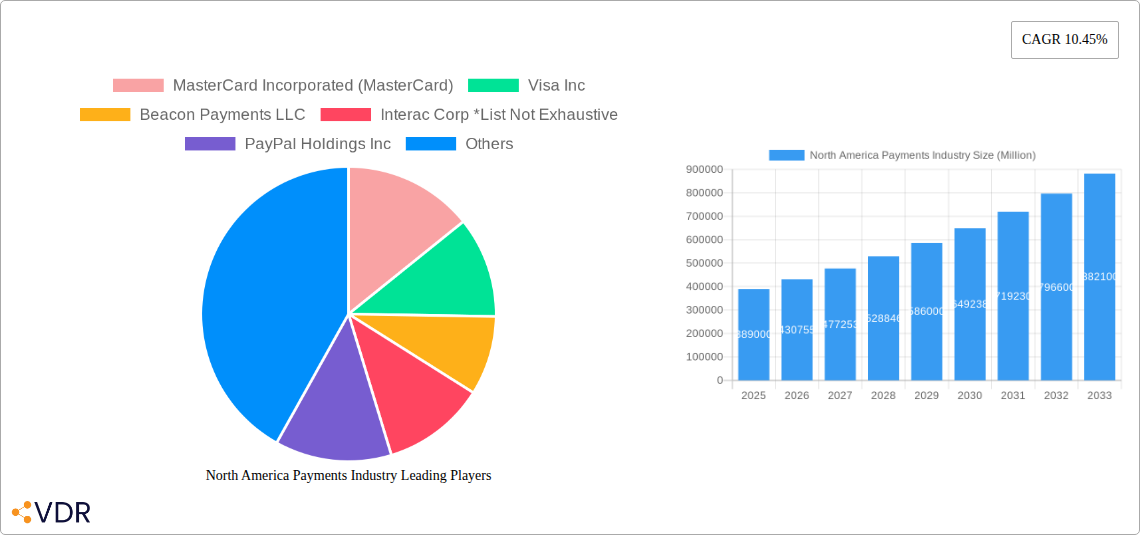
North America Payments Industry Market Size (In Billion)
The projected growth trajectory indicates that the market will surpass $800 billion by 2033. However, potential restraints include regulatory challenges surrounding data privacy and security, along with the need for continuous innovation to combat evolving fraud methods. The industry's competitive landscape is dynamic, with established players like MasterCard and Visa competing with emerging FinTech companies. The strategic alliances and mergers & acquisitions are likely to continue shaping the market structure. Growth will depend on the successful integration of emerging technologies, such as blockchain and AI, for enhanced security and customer experience. Further opportunities lie in the expansion into underserved markets and the development of innovative payment solutions tailored to specific industry needs.
North America Payments Industry Company Market Share
North America Payments Industry Market Report: 2019-2033
This comprehensive report provides an in-depth analysis of the North America payments industry, covering the period 2019-2033, with a focus on market dynamics, growth trends, key players, and future outlook. The report utilizes data from 2019-2024 (historical period) and projects figures from 2025 (base year) to 2033 (forecast period). All values are presented in millions of units. This report is essential for industry professionals, investors, and strategists seeking a detailed understanding of this rapidly evolving sector.
North America Payments Industry Market Dynamics & Structure
The North American payments landscape is characterized by high market concentration, intense competition, and rapid technological innovation. The industry is heavily influenced by regulatory frameworks, evolving consumer preferences, and a dynamic mergers and acquisitions (M&A) environment. The market is segmented by payment mode (Point of Sale, Online Sale, etc.), end-user industry (Retail, Healthcare, Hospitality, etc.), and country (United States, Canada).
- Market Concentration: The market is dominated by a few large players, with the top 5 players holding approximately xx% market share in 2024. This high concentration is expected to remain relatively stable through 2033.
- Technological Innovation: The industry is witnessing rapid innovation in areas such as mobile payments, digital wallets, and blockchain technology. However, barriers to entry remain significant due to high infrastructure costs and stringent security regulations.
- Regulatory Frameworks: Government regulations regarding data privacy, security, and consumer protection significantly impact industry operations. Ongoing changes in regulations, particularly concerning open banking initiatives and data portability, present both challenges and opportunities for market players.
- Competitive Product Substitutes: The emergence of alternative payment solutions, such as Buy Now Pay Later (BNPL) services and cryptocurrencies, presents a challenge to traditional payment providers.
- End-User Demographics: The growing adoption of digital technologies across demographics is driving significant growth in online and mobile payments. This trend is particularly evident among younger generations.
- M&A Trends: The past five years saw xx M&A deals, with a focus on enhancing technology, expanding geographical reach, and diversifying service offerings. This trend is expected to continue in the forecast period, potentially further consolidating the market.
North America Payments Industry Growth Trends & Insights
The North American payments industry experienced robust growth in the historical period (2019-2024), driven by rising e-commerce adoption, increased mobile penetration, and the shift towards cashless transactions. The market size grew from $xx million in 2019 to $xx million in 2024, registering a Compound Annual Growth Rate (CAGR) of xx%. This positive trend is projected to continue, with the market size reaching $xx million by 2033, demonstrating a CAGR of xx% during the forecast period (2025-2033).
Key factors driving this growth include:
- The continued rise of e-commerce and the increasing preference for online shopping, driving demand for secure and convenient online payment solutions.
- Growing adoption of mobile payment technologies and the expansion of digital wallets among consumers of all ages.
- Technological advancements leading to the introduction of new and innovative payment solutions, such as contactless payments and blockchain-based technologies.
- Increasing government initiatives promoting financial inclusion and digital payments.
Dominant Regions, Countries, or Segments in North America Payments Industry
The United States is the dominant market within North America, accounting for approximately xx% of the total market value in 2024. This dominance is attributed to its larger population, higher levels of disposable income, greater e-commerce penetration, and a more mature regulatory environment. Canada represents a significant but smaller market share.
Among segments:
- By Country: The United States dominates due to its larger economy and higher adoption rate of digital payments. Canada follows, showing a robust growth trajectory fueled by increasing digitalization.
- By End-user Industry: The Retail segment leads, followed by the Entertainment and Healthcare sectors, reflecting high transaction volumes in these industries.
- By Mode of Payment: Point of Sale (POS) payments continue to be dominant, though online sales are growing rapidly, with a significant shift towards mobile POS and contactless transactions.
North America Payments Industry Product Landscape
The product landscape is characterized by a wide range of payment solutions, including credit and debit cards, mobile wallets (e.g., Apple Pay, Google Pay), online payment gateways (e.g., PayPal), and real-time payment systems. Recent innovations have focused on enhancing security, improving user experience, and expanding functionalities. Key features include biometric authentication, tokenization, and integration with various online and offline platforms. The emphasis is on seamless, secure, and convenient payment experiences tailored to specific consumer needs and industry requirements.
Key Drivers, Barriers & Challenges in North America Payments Industry
Key Drivers: The key drivers include increasing smartphone penetration, rising e-commerce adoption, growing demand for contactless and mobile payment options, and government initiatives promoting financial inclusion and digital payments. The shift towards cashless transactions is a significant force.
Key Challenges: Key challenges include concerns about data security and fraud, the need for robust regulatory compliance, and maintaining interoperability across different payment systems. Competition from emerging fintech players also puts pressure on traditional payment providers. Supply chain disruptions impacting the production of POS terminals have also caused temporary slowdowns.
Emerging Opportunities in North America Payments Industry
Emerging opportunities include the expansion of BNPL services, increasing adoption of blockchain technology for secure cross-border payments, the growing use of embedded finance within various applications, and the potential for further innovation in contactless and biometric payment technologies. The integration of AI and machine learning to improve fraud detection and risk management also presents lucrative opportunities.
Growth Accelerators in the North America Payments Industry
Technological advancements, such as improved security protocols and the integration of artificial intelligence, are major growth accelerators. Strategic partnerships between traditional financial institutions and fintech companies are also fueling expansion into new markets and service offerings. Increased regulatory clarity and the promotion of open banking initiatives further facilitate market growth.
Key Players Shaping the North America Payments Industry Market
- MasterCard Incorporated (MasterCard)
- Visa Inc
- Beacon Payments LLC
- Interac Corp
- PayPal Holdings Inc
- Alphabet Inc (Apple Pay)
- Amazon com Inc
- Alipay com Co Ltd
- Dwolla
- Google Pay (Google LLC)
Notable Milestones in North America Payments Industry Sector
- August 2023: PayPal announced the launch of PayPal USD, a stablecoin backed by US dollars.
- September 2023: PayPal introduces Web3 Payment On and Off Ramps, enabling users to buy and sell supported cryptocurrencies within the PayPal platform.
In-Depth North America Payments Industry Market Outlook
The North American payments industry is poised for continued growth driven by technological innovation, evolving consumer preferences, and increasing digitalization. Strategic partnerships, expansion into new market segments, and the adoption of innovative payment solutions will shape the future of the industry. The market presents significant opportunities for both established players and emerging fintech companies. The increasing importance of security and regulatory compliance will remain critical factors influencing market dynamics.
North America Payments Industry Segmentation
-
1. Mode of Payment
-
1.1. Point of Sale
- 1.1.1. Card Pay
- 1.1.2. Digital Wallet (includes Mobile Wallets)
- 1.1.3. Cash
- 1.1.4. Others
-
1.2. Online Sale
- 1.2.1. Others (
-
1.1. Point of Sale
-
2. End-user Industry
- 2.1. Retail
- 2.2. Entertainment
- 2.3. Healthcare
- 2.4. Hospitality
- 2.5. Other End-user Industries
North America Payments Industry Segmentation By Geography
-
1. North America
- 1.1. United States
- 1.2. Canada
- 1.3. Mexico
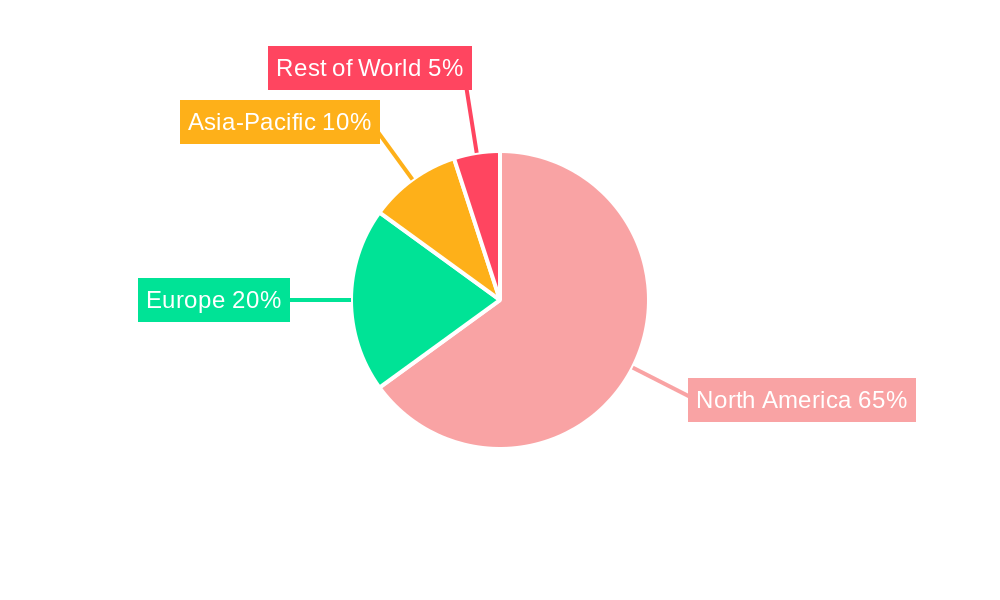
North America Payments Industry Regional Market Share
Geographic Coverage of North America Payments Industry
North America Payments Industry REPORT HIGHLIGHTS
| Aspects | Details |
|---|---|
| Study Period | 2020-2034 |
| Base Year | 2025 |
| Estimated Year | 2026 |
| Forecast Period | 2026-2034 |
| Historical Period | 2020-2025 |
| Growth Rate | CAGR of 10.45% from 2020-2034 |
| Segmentation |
|
Table of Contents
- 1. Introduction
- 1.1. Research Scope
- 1.2. Market Segmentation
- 1.3. Research Objective
- 1.4. Definitions and Assumptions
- 2. Executive Summary
- 2.1. Market Snapshot
- 3. Market Dynamics
- 3.1. Market Drivers
- 3.2. Market Restrains
- 3.3. Market Trends
- 3.4. Market Opportunities
- 4. Market Factor Analysis
- 4.1. Porters Five Forces
- 4.1.1. Bargaining Power of Suppliers
- 4.1.2. Bargaining Power of Buyers
- 4.1.3. Threat of New Entrants
- 4.1.4. Threat of Substitutes
- 4.1.5. Competitive Rivalry
- 4.2. PESTEL analysis
- 4.3. BCG Analysis
- 4.3.1. Stars (High Growth, High Market Share)
- 4.3.2. Cash Cows (Low Growth, High Market Share)
- 4.3.3. Question Mark (High Growth, Low Market Share)
- 4.3.4. Dogs (Low Growth, Low Market Share)
- 4.4. Ansoff Matrix Analysis
- 4.5. Supply Chain Analysis
- 4.6. Regulatory Landscape
- 4.7. Current Market Potential and Opportunity Assessment (TAM–SAM–SOM Framework)
- 4.8. VDR Analyst Note
- 4.1. Porters Five Forces
- 5. Market Analysis, Insights and Forecast 2021-2033
- 5.1. Market Analysis, Insights and Forecast - by Mode of Payment
- 5.1.1. Point of Sale
- 5.1.1.1. Card Pay
- 5.1.1.2. Digital Wallet (includes Mobile Wallets)
- 5.1.1.3. Cash
- 5.1.1.4. Others
- 5.1.2. Online Sale
- 5.1.2.1. Others (
- 5.1.1. Point of Sale
- 5.2. Market Analysis, Insights and Forecast - by End-user Industry
- 5.2.1. Retail
- 5.2.2. Entertainment
- 5.2.3. Healthcare
- 5.2.4. Hospitality
- 5.2.5. Other End-user Industries
- 5.3. Market Analysis, Insights and Forecast - by Region
- 5.3.1. North America
- 5.1. Market Analysis, Insights and Forecast - by Mode of Payment
- 6. North America Payments Industry Analysis, Insights and Forecast, 2021-2033
- 6.1. Market Analysis, Insights and Forecast - by Mode of Payment
- 6.1.1. Point of Sale
- 6.1.1.1. Card Pay
- 6.1.1.2. Digital Wallet (includes Mobile Wallets)
- 6.1.1.3. Cash
- 6.1.1.4. Others
- 6.1.2. Online Sale
- 6.1.2.1. Others (
- 6.1.1. Point of Sale
- 6.2. Market Analysis, Insights and Forecast - by End-user Industry
- 6.2.1. Retail
- 6.2.2. Entertainment
- 6.2.3. Healthcare
- 6.2.4. Hospitality
- 6.2.5. Other End-user Industries
- 6.1. Market Analysis, Insights and Forecast - by Mode of Payment
- 7. Competitive Analysis
- 7.1. Company Profiles
- 7.1.1 MasterCard Incorporated (MasterCard)
- 7.1.1.1. Company Overview
- 7.1.1.2. Products
- 7.1.1.3. Company Financials
- 7.1.1.4. SWOT Analysis
- 7.1.2 Visa Inc
- 7.1.2.1. Company Overview
- 7.1.2.2. Products
- 7.1.2.3. Company Financials
- 7.1.2.4. SWOT Analysis
- 7.1.3 Beacon Payments LLC
- 7.1.3.1. Company Overview
- 7.1.3.2. Products
- 7.1.3.3. Company Financials
- 7.1.3.4. SWOT Analysis
- 7.1.4 Interac Corp *List Not Exhaustive
- 7.1.4.1. Company Overview
- 7.1.4.2. Products
- 7.1.4.3. Company Financials
- 7.1.4.4. SWOT Analysis
- 7.1.5 PayPal Holdings Inc
- 7.1.5.1. Company Overview
- 7.1.5.2. Products
- 7.1.5.3. Company Financials
- 7.1.5.4. SWOT Analysis
- 7.1.6 Alphabet Inc (Apple Pay)
- 7.1.6.1. Company Overview
- 7.1.6.2. Products
- 7.1.6.3. Company Financials
- 7.1.6.4. SWOT Analysis
- 7.1.7 Amazon com Inc
- 7.1.7.1. Company Overview
- 7.1.7.2. Products
- 7.1.7.3. Company Financials
- 7.1.7.4. SWOT Analysis
- 7.1.8 Alipay com Co Ltd
- 7.1.8.1. Company Overview
- 7.1.8.2. Products
- 7.1.8.3. Company Financials
- 7.1.8.4. SWOT Analysis
- 7.1.9 Dwolla
- 7.1.9.1. Company Overview
- 7.1.9.2. Products
- 7.1.9.3. Company Financials
- 7.1.9.4. SWOT Analysis
- 7.1.10 Google Pay (Google LLC)
- 7.1.10.1. Company Overview
- 7.1.10.2. Products
- 7.1.10.3. Company Financials
- 7.1.10.4. SWOT Analysis
- 7.1.1 MasterCard Incorporated (MasterCard)
- 7.2. Market Entropy
- 7.2.1 Company's Key Areas Served
- 7.2.2 Recent Developments
- 7.3. Company Market Share Analysis 2025
- 7.3.1 Top 5 Companies Market Share Analysis
- 7.3.2 Top 3 Companies Market Share Analysis
- 7.4. List of Potential Customers
- 8. Research Methodology
List of Figures
- Figure 1: North America Payments Industry Revenue Breakdown (Million, %) by Product 2025 & 2033
- Figure 2: North America Payments Industry Share (%) by Company 2025
List of Tables
- Table 1: North America Payments Industry Revenue Million Forecast, by Mode of Payment 2020 & 2033
- Table 2: North America Payments Industry Revenue Million Forecast, by End-user Industry 2020 & 2033
- Table 3: North America Payments Industry Revenue Million Forecast, by Region 2020 & 2033
- Table 4: North America Payments Industry Revenue Million Forecast, by Mode of Payment 2020 & 2033
- Table 5: North America Payments Industry Revenue Million Forecast, by End-user Industry 2020 & 2033
- Table 6: North America Payments Industry Revenue Million Forecast, by Country 2020 & 2033
- Table 7: United States North America Payments Industry Revenue (Million) Forecast, by Application 2020 & 2033
- Table 8: Canada North America Payments Industry Revenue (Million) Forecast, by Application 2020 & 2033
- Table 9: Mexico North America Payments Industry Revenue (Million) Forecast, by Application 2020 & 2033
Frequently Asked Questions
1. What is the projected Compound Annual Growth Rate (CAGR) of the North America Payments Industry?
The projected CAGR is approximately 10.45%.
2. Which companies are prominent players in the North America Payments Industry?
Key companies in the market include MasterCard Incorporated (MasterCard), Visa Inc, Beacon Payments LLC, Interac Corp *List Not Exhaustive, PayPal Holdings Inc, Alphabet Inc (Apple Pay), Amazon com Inc, Alipay com Co Ltd, Dwolla, Google Pay (Google LLC).
3. What are the main segments of the North America Payments Industry?
The market segments include Mode of Payment, End-user Industry.
4. Can you provide details about the market size?
The market size is estimated to be USD 389.00 Million as of 2022.
5. What are some drivers contributing to market growth?
High Proliferation of E-commerce. Including the Rise of M-commerce; Smartphone Growth and Electronic Initiatives in the payment market; Increase in Real-Time Payments.
6. What are the notable trends driving market growth?
Increasing use of digital wallets payments.
7. Are there any restraints impacting market growth?
Lack of a Standard Legislative Policy Across the Globe; Privacy and Security Concerns.
8. Can you provide examples of recent developments in the market?
August 2023 - PayPal announced the launch of stablecoin digital currency, which will be backed by US dollars and used for transactions on its global online payments platform. The stablecoin, known as PayPal USD, will be issued by Paxos Trust Co. and will be backed by US dollar deposits and short-term US Treasuries.
9. What pricing options are available for accessing the report?
Pricing options include single-user, multi-user, and enterprise licenses priced at USD 4750, USD 5250, and USD 8750 respectively.
10. Is the market size provided in terms of value or volume?
The market size is provided in terms of value, measured in Million.
11. Are there any specific market keywords associated with the report?
Yes, the market keyword associated with the report is "North America Payments Industry," which aids in identifying and referencing the specific market segment covered.
12. How do I determine which pricing option suits my needs best?
The pricing options vary based on user requirements and access needs. Individual users may opt for single-user licenses, while businesses requiring broader access may choose multi-user or enterprise licenses for cost-effective access to the report.
13. Are there any additional resources or data provided in the North America Payments Industry report?
While the report offers comprehensive insights, it's advisable to review the specific contents or supplementary materials provided to ascertain if additional resources or data are available.
14. How can I stay updated on further developments or reports in the North America Payments Industry?
To stay informed about further developments, trends, and reports in the North America Payments Industry, consider subscribing to industry newsletters, following relevant companies and organizations, or regularly checking reputable industry news sources and publications.
Methodology
Step 1 - Identification of Relevant Samples Size from Population Database


Step 2 - Approaches for Defining Global Market Size (Value, Volume* & Price*)

Note*: In applicable scenarios
Step 3 - Data Sources
Primary Research
- Web Analytics
- Survey Reports
- Research Institute
- Latest Research Reports
- Opinion Leaders
Secondary Research
- Annual Reports
- White Paper
- Latest Press Release
- Industry Association
- Paid Database
- Investor Presentations

Step 4 - Data Triangulation
Involves using different sources of information in order to increase the validity of a study
These sources are likely to be stakeholders in a program - participants, other researchers, program staff, other community members, and so on.
Then we put all data in single framework & apply various statistical tools to find out the dynamic on the market.
During the analysis stage, feedback from the stakeholder groups would be compared to determine areas of agreement as well as areas of divergence