
Key Insights
The global connected ship market is experiencing robust growth, driven by increasing demand for enhanced safety, operational efficiency, and reduced environmental impact within the maritime industry. A 3.90% CAGR from 2019 to 2024 suggests a substantial market expansion, projected to continue into the forecast period (2025-2033). Key drivers include the rising adoption of advanced technologies like IoT (Internet of Things), big data analytics, and AI (Artificial Intelligence) to optimize vessel operations, improve fleet management, and enhance communication capabilities. The integration of these technologies enables real-time monitoring of vessel performance, predictive maintenance, and optimized fuel consumption, leading to significant cost savings and improved operational efficiency. Furthermore, stringent regulatory compliance mandates for enhanced safety and environmental protection are compelling shipping companies to invest in connected ship solutions. Market segmentation reveals strong growth across various ship types, including commercial and defense vessels, and applications such as vessel traffic management, fleet operations, and fleet health monitoring. Line-fit installations are currently dominant but retrofitting existing fleets presents a significant growth opportunity in the coming years. Major players such as Kongsberg Gruppen ASA, Wärtsilä Corporation, and General Electric Co. are actively shaping the market landscape through technological innovation and strategic partnerships. Geographic distribution indicates strong presence across North America, Europe, and Asia-Pacific, with further expansion expected in emerging markets.
The market's future trajectory hinges on several factors. Continued technological advancements, particularly in 5G connectivity and edge computing, will further accelerate market growth. The successful integration of autonomous systems and advanced data analytics will optimize vessel operations, leading to greater efficiency and cost reductions. However, high initial investment costs for implementing connected ship technologies and the need for robust cybersecurity infrastructure may pose challenges to widespread adoption. Nevertheless, the long-term benefits of enhanced safety, operational efficiency, and environmental sustainability are expected to outweigh these challenges, ensuring continued strong growth for the connected ship market throughout the forecast period. Competition will intensify amongst existing players and new entrants, driving further innovation and price optimization.

Connected Ship Market: A Comprehensive Report (2019-2033)
This comprehensive report provides an in-depth analysis of the Connected Ship Market, encompassing market dynamics, growth trends, regional dominance, product landscapes, key players, and future outlook. The report covers the parent market of Maritime Technology and the child market of Ship Connectivity Solutions, offering invaluable insights for industry professionals, investors, and strategic decision-makers. The study period spans from 2019 to 2033, with a base year of 2025 and a forecast period from 2025 to 2033. The historical period analyzed is 2019-2024. The market size is projected to reach xx Million units by 2033.
Connected Ship Market Market Dynamics & Structure
The Connected Ship market is characterized by moderate concentration, with several key players vying for market share. Technological innovation, primarily in IoT, AI, and 5G connectivity, is a significant driver, alongside evolving regulatory frameworks focused on safety and efficiency. Competitive product substitutes, such as traditional communication systems, are gradually losing ground to the enhanced capabilities of connected ship solutions. The end-user demographics are primarily commercial and defense shipping companies, with varying adoption rates based on vessel type and operational needs. M&A activity in the sector has been relatively moderate, with a projected xx deals annually over the forecast period, primarily focused on enhancing technological capabilities and expanding market reach.
- Market Concentration: Moderately concentrated, with top 5 players holding approximately xx% of the market share in 2024.
- Technological Innovation: Significant advancements in IoT, AI, and 5G are driving market growth.
- Regulatory Frameworks: Stringent safety and environmental regulations are influencing adoption.
- Competitive Substitutes: Traditional communication systems pose a diminishing competitive threat.
- End-User Demographics: Predominantly commercial and defense shipping companies.
- M&A Trends: xx M&A deals projected annually from 2025-2033, focusing on technology and market expansion.
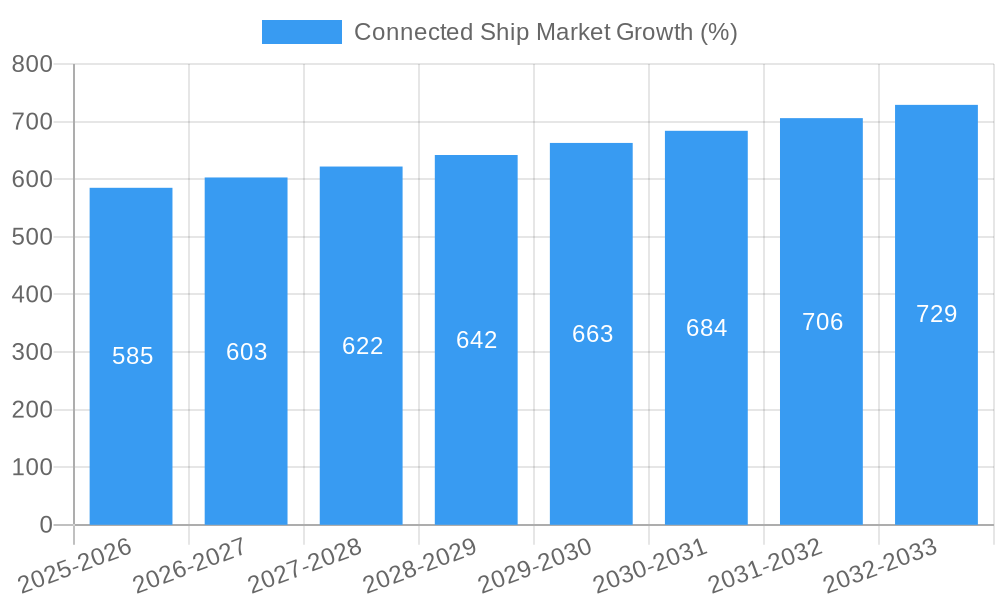
Connected Ship Market Growth Trends & Insights
The Connected Ship market is experiencing robust growth, driven by increasing demand for improved operational efficiency, enhanced safety measures, and real-time data-driven decision-making. The market size is projected to grow at a CAGR of xx% during the forecast period (2025-2033), reaching xx Million units by 2033. This growth is fueled by the rising adoption of connected ship solutions across various ship types, applications, and fit types. Technological disruptions, such as the integration of AI and machine learning, are further accelerating market expansion. Shifting consumer behavior towards enhanced vessel management and safety is a primary driver.
Dominant Regions, Countries, or Segments in Connected Ship Market
The Asia-Pacific region is expected to dominate the Connected Ship market throughout the forecast period, driven by the significant growth in maritime trade and investments in maritime infrastructure. Within this region, China and Japan are leading the way due to substantial government support, a burgeoning shipbuilding industry, and a focus on technological advancement. In terms of segments, the Commercial ship type holds the largest market share, followed by Defense. Fleet operations and vessel traffic management applications are leading segments, particularly in developed economies. Line Fit installations currently dominate, yet Retrofit is projected to experience significant growth due to the increasing need for modernization among existing fleets.
- Key Regional Drivers: Strong maritime trade, investment in infrastructure, government support.
- Leading Countries: China, Japan, South Korea.
- Dominant Segments: Commercial ships, Fleet Operations, and Vessel Traffic Management applications, Line Fit installations.
Connected Ship Market Product Landscape
Connected ship solutions encompass a range of technologies, including satellite communication systems, onboard sensors, data analytics platforms, and cybersecurity solutions. These technologies collectively enhance vessel operations, safety, and efficiency. Recent innovations focus on improved data integration, advanced analytics capabilities, and enhanced cybersecurity features. Unique selling propositions revolve around reduced operational costs, improved safety, and enhanced environmental compliance.
Key Drivers, Barriers & Challenges in Connected Ship Market
Key Drivers: Rising demand for operational efficiency, stringent safety regulations, growing need for real-time data analytics, and the increasing adoption of IoT technologies.
Challenges & Restraints: High initial investment costs, integration complexities, cybersecurity threats, and potential data privacy concerns represent key hurdles. Supply chain disruptions caused by global events also pose significant challenges. For example, semiconductor shortages have hindered the timely production of some components, creating delays in project implementation and increasing costs.
Emerging Opportunities in Connected Ship Market
Untapped markets exist in developing economies with significant maritime activity but limited adoption of connected ship solutions. The increasing demand for autonomous shipping presents substantial opportunities. Furthermore, integrating sustainability features, such as fuel efficiency optimization and emission monitoring, into connected ship solutions will drive future growth.
Growth Accelerators in the Connected Ship Market Industry
Strategic partnerships between technology providers, shipbuilders, and shipping companies are significantly accelerating market growth. Technological breakthroughs, particularly in AI and 5G connectivity, are expanding the capabilities and applications of connected ship solutions. Expansion into new markets, particularly in developing economies, will further fuel long-term growth.
Key Players Shaping the Connected Ship Market Market
- Kongsberg Gruppen ASA
- Wartsila Corporation
- General Electric Co
- Synectics Global
- Atos SE
- Inmarsat plc
- Northrop Grumman Corporation
- Marlink AS
Notable Milestones in Connected Ship Market Sector
- February 2022: Mitsubishi Shipbuilding announces the construction of the world's first demonstration test ship for liquefied CO2 transportation, showcasing advancements in LCO2 handling technology.
- July 2022: Maersk successfully completes the first India-Bangladesh cross-border logistics of containerized cargo using inland waterways, highlighting the potential of inland waterways for efficient logistics.
In-Depth Connected Ship Market Market Outlook
The Connected Ship market is poised for continued growth, driven by ongoing technological advancements and increasing demand for enhanced operational efficiency and safety. Strategic partnerships, expansion into new markets, and the development of innovative applications will further propel market expansion. The market presents significant opportunities for both established players and new entrants to capitalize on the growing demand for connected solutions in the maritime industry.
Connected Ship Market Segmentation
-
1. Ship Type
- 1.1. Commercial
- 1.2. Defense
-
2. Application
- 2.1. Vessel Traffic Management
- 2.2. Fleet Operations
- 2.3. Fleet Health Monitoring
-
3. Fit
- 3.1. Line Fit
- 3.2. Retrofit
Connected Ship Market Segmentation By Geography
-
1. North America
- 1.1. United States
- 1.2. Canada
-
2. Europe
- 2.1. United Kingdom
- 2.2. Germany
- 2.3. France
- 2.4. Rest of Europe
-
3. Asia Pacific
- 3.1. China
- 3.2. Japan
- 3.3. India
- 3.4. South Korea
- 3.5. Rest of Asia Pacific
- 4. Rest of the World

Connected Ship Market REPORT HIGHLIGHTS
| Aspects | Details |
|---|---|
| Study Period | 2019-2033 |
| Base Year | 2024 |
| Estimated Year | 2025 |
| Forecast Period | 2025-2033 |
| Historical Period | 2019-2024 |
| Growth Rate | CAGR of 3.90% from 2019-2033 |
| Segmentation |
|
Table of Contents
- 1. Introduction
- 1.1. Research Scope
- 1.2. Market Segmentation
- 1.3. Research Methodology
- 1.4. Definitions and Assumptions
- 2. Executive Summary
- 2.1. Introduction
- 3. Market Dynamics
- 3.1. Introduction
- 3.2. Market Drivers
- 3.2.1. Increasing Seaborne Trade Across the Globe; Growing Incorporation of ICT in the Global Marine Industry; Increasing Maritime Tourism Industry
- 3.3. Market Restrains
- 3.3.1. High Deployment Cost of Marine Broadband Connectivity
- 3.4. Market Trends
- 3.4.1. Maritime Industry Segment is expected to Account for the Largest Market Share during the Forecast Period
- 4. Market Factor Analysis
- 4.1. Porters Five Forces
- 4.2. Supply/Value Chain
- 4.3. PESTEL analysis
- 4.4. Market Entropy
- 4.5. Patent/Trademark Analysis
- 5. Global Connected Ship Market Analysis, Insights and Forecast, 2019-2031
- 5.1. Market Analysis, Insights and Forecast - by Ship Type
- 5.1.1. Commercial
- 5.1.2. Defense
- 5.2. Market Analysis, Insights and Forecast - by Application
- 5.2.1. Vessel Traffic Management
- 5.2.2. Fleet Operations
- 5.2.3. Fleet Health Monitoring
- 5.3. Market Analysis, Insights and Forecast - by Fit
- 5.3.1. Line Fit
- 5.3.2. Retrofit
- 5.4. Market Analysis, Insights and Forecast - by Region
- 5.4.1. North America
- 5.4.2. Europe
- 5.4.3. Asia Pacific
- 5.4.4. Rest of the World
- 5.1. Market Analysis, Insights and Forecast - by Ship Type
- 6. North America Connected Ship Market Analysis, Insights and Forecast, 2019-2031
- 6.1. Market Analysis, Insights and Forecast - by Ship Type
- 6.1.1. Commercial
- 6.1.2. Defense
- 6.2. Market Analysis, Insights and Forecast - by Application
- 6.2.1. Vessel Traffic Management
- 6.2.2. Fleet Operations
- 6.2.3. Fleet Health Monitoring
- 6.3. Market Analysis, Insights and Forecast - by Fit
- 6.3.1. Line Fit
- 6.3.2. Retrofit
- 6.1. Market Analysis, Insights and Forecast - by Ship Type
- 7. Europe Connected Ship Market Analysis, Insights and Forecast, 2019-2031
- 7.1. Market Analysis, Insights and Forecast - by Ship Type
- 7.1.1. Commercial
- 7.1.2. Defense
- 7.2. Market Analysis, Insights and Forecast - by Application
- 7.2.1. Vessel Traffic Management
- 7.2.2. Fleet Operations
- 7.2.3. Fleet Health Monitoring
- 7.3. Market Analysis, Insights and Forecast - by Fit
- 7.3.1. Line Fit
- 7.3.2. Retrofit
- 7.1. Market Analysis, Insights and Forecast - by Ship Type
- 8. Asia Pacific Connected Ship Market Analysis, Insights and Forecast, 2019-2031
- 8.1. Market Analysis, Insights and Forecast - by Ship Type
- 8.1.1. Commercial
- 8.1.2. Defense
- 8.2. Market Analysis, Insights and Forecast - by Application
- 8.2.1. Vessel Traffic Management
- 8.2.2. Fleet Operations
- 8.2.3. Fleet Health Monitoring
- 8.3. Market Analysis, Insights and Forecast - by Fit
- 8.3.1. Line Fit
- 8.3.2. Retrofit
- 8.1. Market Analysis, Insights and Forecast - by Ship Type
- 9. Rest of the World Connected Ship Market Analysis, Insights and Forecast, 2019-2031
- 9.1. Market Analysis, Insights and Forecast - by Ship Type
- 9.1.1. Commercial
- 9.1.2. Defense
- 9.2. Market Analysis, Insights and Forecast - by Application
- 9.2.1. Vessel Traffic Management
- 9.2.2. Fleet Operations
- 9.2.3. Fleet Health Monitoring
- 9.3. Market Analysis, Insights and Forecast - by Fit
- 9.3.1. Line Fit
- 9.3.2. Retrofit
- 9.1. Market Analysis, Insights and Forecast - by Ship Type
- 10. North America Connected Ship Market Analysis, Insights and Forecast, 2019-2031
- 10.1. Market Analysis, Insights and Forecast - By Country/Sub-region
- 10.1.1 United States
- 10.1.2 Canada
- 11. Europe Connected Ship Market Analysis, Insights and Forecast, 2019-2031
- 11.1. Market Analysis, Insights and Forecast - By Country/Sub-region
- 11.1.1 United Kingdom
- 11.1.2 Germany
- 11.1.3 France
- 11.1.4 Rest of Europe
- 12. Asia Pacific Connected Ship Market Analysis, Insights and Forecast, 2019-2031
- 12.1. Market Analysis, Insights and Forecast - By Country/Sub-region
- 12.1.1 China
- 12.1.2 Japan
- 12.1.3 India
- 12.1.4 South Korea
- 12.1.5 Rest of Asia Pacific
- 13. Rest of the World Connected Ship Market Analysis, Insights and Forecast, 2019-2031
- 13.1. Market Analysis, Insights and Forecast - By Country/Sub-region
- 13.1.1.
- 14. Competitive Analysis
- 14.1. Global Market Share Analysis 2024
- 14.2. Company Profiles
- 14.2.1 Kongsberg Gruppen ASA
- 14.2.1.1. Overview
- 14.2.1.2. Products
- 14.2.1.3. SWOT Analysis
- 14.2.1.4. Recent Developments
- 14.2.1.5. Financials (Based on Availability)
- 14.2.2 Wartsila Corporation
- 14.2.2.1. Overview
- 14.2.2.2. Products
- 14.2.2.3. SWOT Analysis
- 14.2.2.4. Recent Developments
- 14.2.2.5. Financials (Based on Availability)
- 14.2.3 General Electric Co
- 14.2.3.1. Overview
- 14.2.3.2. Products
- 14.2.3.3. SWOT Analysis
- 14.2.3.4. Recent Developments
- 14.2.3.5. Financials (Based on Availability)
- 14.2.4 Synectics Global
- 14.2.4.1. Overview
- 14.2.4.2. Products
- 14.2.4.3. SWOT Analysis
- 14.2.4.4. Recent Developments
- 14.2.4.5. Financials (Based on Availability)
- 14.2.5 Atos SE
- 14.2.5.1. Overview
- 14.2.5.2. Products
- 14.2.5.3. SWOT Analysis
- 14.2.5.4. Recent Developments
- 14.2.5.5. Financials (Based on Availability)
- 14.2.6 Inmarsat plc*List Not Exhaustive
- 14.2.6.1. Overview
- 14.2.6.2. Products
- 14.2.6.3. SWOT Analysis
- 14.2.6.4. Recent Developments
- 14.2.6.5. Financials (Based on Availability)
- 14.2.7 Northrop Grumman Corporation
- 14.2.7.1. Overview
- 14.2.7.2. Products
- 14.2.7.3. SWOT Analysis
- 14.2.7.4. Recent Developments
- 14.2.7.5. Financials (Based on Availability)
- 14.2.8 Marlink AS
- 14.2.8.1. Overview
- 14.2.8.2. Products
- 14.2.8.3. SWOT Analysis
- 14.2.8.4. Recent Developments
- 14.2.8.5. Financials (Based on Availability)
- 14.2.1 Kongsberg Gruppen ASA
List of Figures
- Figure 1: Global Connected Ship Market Revenue Breakdown (Million, %) by Region 2024 & 2032
- Figure 2: North America Connected Ship Market Revenue (Million), by Country 2024 & 2032
- Figure 3: North America Connected Ship Market Revenue Share (%), by Country 2024 & 2032
- Figure 4: Europe Connected Ship Market Revenue (Million), by Country 2024 & 2032
- Figure 5: Europe Connected Ship Market Revenue Share (%), by Country 2024 & 2032
- Figure 6: Asia Pacific Connected Ship Market Revenue (Million), by Country 2024 & 2032
- Figure 7: Asia Pacific Connected Ship Market Revenue Share (%), by Country 2024 & 2032
- Figure 8: Rest of the World Connected Ship Market Revenue (Million), by Country 2024 & 2032
- Figure 9: Rest of the World Connected Ship Market Revenue Share (%), by Country 2024 & 2032
- Figure 10: North America Connected Ship Market Revenue (Million), by Ship Type 2024 & 2032
- Figure 11: North America Connected Ship Market Revenue Share (%), by Ship Type 2024 & 2032
- Figure 12: North America Connected Ship Market Revenue (Million), by Application 2024 & 2032
- Figure 13: North America Connected Ship Market Revenue Share (%), by Application 2024 & 2032
- Figure 14: North America Connected Ship Market Revenue (Million), by Fit 2024 & 2032
- Figure 15: North America Connected Ship Market Revenue Share (%), by Fit 2024 & 2032
- Figure 16: North America Connected Ship Market Revenue (Million), by Country 2024 & 2032
- Figure 17: North America Connected Ship Market Revenue Share (%), by Country 2024 & 2032
- Figure 18: Europe Connected Ship Market Revenue (Million), by Ship Type 2024 & 2032
- Figure 19: Europe Connected Ship Market Revenue Share (%), by Ship Type 2024 & 2032
- Figure 20: Europe Connected Ship Market Revenue (Million), by Application 2024 & 2032
- Figure 21: Europe Connected Ship Market Revenue Share (%), by Application 2024 & 2032
- Figure 22: Europe Connected Ship Market Revenue (Million), by Fit 2024 & 2032
- Figure 23: Europe Connected Ship Market Revenue Share (%), by Fit 2024 & 2032
- Figure 24: Europe Connected Ship Market Revenue (Million), by Country 2024 & 2032
- Figure 25: Europe Connected Ship Market Revenue Share (%), by Country 2024 & 2032
- Figure 26: Asia Pacific Connected Ship Market Revenue (Million), by Ship Type 2024 & 2032
- Figure 27: Asia Pacific Connected Ship Market Revenue Share (%), by Ship Type 2024 & 2032
- Figure 28: Asia Pacific Connected Ship Market Revenue (Million), by Application 2024 & 2032
- Figure 29: Asia Pacific Connected Ship Market Revenue Share (%), by Application 2024 & 2032
- Figure 30: Asia Pacific Connected Ship Market Revenue (Million), by Fit 2024 & 2032
- Figure 31: Asia Pacific Connected Ship Market Revenue Share (%), by Fit 2024 & 2032
- Figure 32: Asia Pacific Connected Ship Market Revenue (Million), by Country 2024 & 2032
- Figure 33: Asia Pacific Connected Ship Market Revenue Share (%), by Country 2024 & 2032
- Figure 34: Rest of the World Connected Ship Market Revenue (Million), by Ship Type 2024 & 2032
- Figure 35: Rest of the World Connected Ship Market Revenue Share (%), by Ship Type 2024 & 2032
- Figure 36: Rest of the World Connected Ship Market Revenue (Million), by Application 2024 & 2032
- Figure 37: Rest of the World Connected Ship Market Revenue Share (%), by Application 2024 & 2032
- Figure 38: Rest of the World Connected Ship Market Revenue (Million), by Fit 2024 & 2032
- Figure 39: Rest of the World Connected Ship Market Revenue Share (%), by Fit 2024 & 2032
- Figure 40: Rest of the World Connected Ship Market Revenue (Million), by Country 2024 & 2032
- Figure 41: Rest of the World Connected Ship Market Revenue Share (%), by Country 2024 & 2032
List of Tables
- Table 1: Global Connected Ship Market Revenue Million Forecast, by Region 2019 & 2032
- Table 2: Global Connected Ship Market Revenue Million Forecast, by Ship Type 2019 & 2032
- Table 3: Global Connected Ship Market Revenue Million Forecast, by Application 2019 & 2032
- Table 4: Global Connected Ship Market Revenue Million Forecast, by Fit 2019 & 2032
- Table 5: Global Connected Ship Market Revenue Million Forecast, by Region 2019 & 2032
- Table 6: Global Connected Ship Market Revenue Million Forecast, by Country 2019 & 2032
- Table 7: United States Connected Ship Market Revenue (Million) Forecast, by Application 2019 & 2032
- Table 8: Canada Connected Ship Market Revenue (Million) Forecast, by Application 2019 & 2032
- Table 9: Global Connected Ship Market Revenue Million Forecast, by Country 2019 & 2032
- Table 10: United Kingdom Connected Ship Market Revenue (Million) Forecast, by Application 2019 & 2032
- Table 11: Germany Connected Ship Market Revenue (Million) Forecast, by Application 2019 & 2032
- Table 12: France Connected Ship Market Revenue (Million) Forecast, by Application 2019 & 2032
- Table 13: Rest of Europe Connected Ship Market Revenue (Million) Forecast, by Application 2019 & 2032
- Table 14: Global Connected Ship Market Revenue Million Forecast, by Country 2019 & 2032
- Table 15: China Connected Ship Market Revenue (Million) Forecast, by Application 2019 & 2032
- Table 16: Japan Connected Ship Market Revenue (Million) Forecast, by Application 2019 & 2032
- Table 17: India Connected Ship Market Revenue (Million) Forecast, by Application 2019 & 2032
- Table 18: South Korea Connected Ship Market Revenue (Million) Forecast, by Application 2019 & 2032
- Table 19: Rest of Asia Pacific Connected Ship Market Revenue (Million) Forecast, by Application 2019 & 2032
- Table 20: Global Connected Ship Market Revenue Million Forecast, by Country 2019 & 2032
- Table 21: Connected Ship Market Revenue (Million) Forecast, by Application 2019 & 2032
- Table 22: Global Connected Ship Market Revenue Million Forecast, by Ship Type 2019 & 2032
- Table 23: Global Connected Ship Market Revenue Million Forecast, by Application 2019 & 2032
- Table 24: Global Connected Ship Market Revenue Million Forecast, by Fit 2019 & 2032
- Table 25: Global Connected Ship Market Revenue Million Forecast, by Country 2019 & 2032
- Table 26: United States Connected Ship Market Revenue (Million) Forecast, by Application 2019 & 2032
- Table 27: Canada Connected Ship Market Revenue (Million) Forecast, by Application 2019 & 2032
- Table 28: Global Connected Ship Market Revenue Million Forecast, by Ship Type 2019 & 2032
- Table 29: Global Connected Ship Market Revenue Million Forecast, by Application 2019 & 2032
- Table 30: Global Connected Ship Market Revenue Million Forecast, by Fit 2019 & 2032
- Table 31: Global Connected Ship Market Revenue Million Forecast, by Country 2019 & 2032
- Table 32: United Kingdom Connected Ship Market Revenue (Million) Forecast, by Application 2019 & 2032
- Table 33: Germany Connected Ship Market Revenue (Million) Forecast, by Application 2019 & 2032
- Table 34: France Connected Ship Market Revenue (Million) Forecast, by Application 2019 & 2032
- Table 35: Rest of Europe Connected Ship Market Revenue (Million) Forecast, by Application 2019 & 2032
- Table 36: Global Connected Ship Market Revenue Million Forecast, by Ship Type 2019 & 2032
- Table 37: Global Connected Ship Market Revenue Million Forecast, by Application 2019 & 2032
- Table 38: Global Connected Ship Market Revenue Million Forecast, by Fit 2019 & 2032
- Table 39: Global Connected Ship Market Revenue Million Forecast, by Country 2019 & 2032
- Table 40: China Connected Ship Market Revenue (Million) Forecast, by Application 2019 & 2032
- Table 41: Japan Connected Ship Market Revenue (Million) Forecast, by Application 2019 & 2032
- Table 42: India Connected Ship Market Revenue (Million) Forecast, by Application 2019 & 2032
- Table 43: South Korea Connected Ship Market Revenue (Million) Forecast, by Application 2019 & 2032
- Table 44: Rest of Asia Pacific Connected Ship Market Revenue (Million) Forecast, by Application 2019 & 2032
- Table 45: Global Connected Ship Market Revenue Million Forecast, by Ship Type 2019 & 2032
- Table 46: Global Connected Ship Market Revenue Million Forecast, by Application 2019 & 2032
- Table 47: Global Connected Ship Market Revenue Million Forecast, by Fit 2019 & 2032
- Table 48: Global Connected Ship Market Revenue Million Forecast, by Country 2019 & 2032
Frequently Asked Questions
1. What is the projected Compound Annual Growth Rate (CAGR) of the Connected Ship Market?
The projected CAGR is approximately 3.90%.
2. Which companies are prominent players in the Connected Ship Market?
Key companies in the market include Kongsberg Gruppen ASA, Wartsila Corporation, General Electric Co, Synectics Global, Atos SE, Inmarsat plc*List Not Exhaustive, Northrop Grumman Corporation, Marlink AS.
3. What are the main segments of the Connected Ship Market?
The market segments include Ship Type, Application, Fit.
4. Can you provide details about the market size?
The market size is estimated to be USD XX Million as of 2022.
5. What are some drivers contributing to market growth?
Increasing Seaborne Trade Across the Globe; Growing Incorporation of ICT in the Global Marine Industry; Increasing Maritime Tourism Industry.
6. What are the notable trends driving market growth?
Maritime Industry Segment is expected to Account for the Largest Market Share during the Forecast Period.
7. Are there any restraints impacting market growth?
High Deployment Cost of Marine Broadband Connectivity.
8. Can you provide examples of recent developments in the market?
February 2022 - Mitsubishi Shipbuilding agrees to construct the World's first demonstration test ship for liquefied CO2 transportation. The ship will integrate the company's liquefied gas handling technologies for tomorrow's long-distance, high-volume LCO2 transport needs.
9. What pricing options are available for accessing the report?
Pricing options include single-user, multi-user, and enterprise licenses priced at USD 4750, USD 5250, and USD 8750 respectively.
10. Is the market size provided in terms of value or volume?
The market size is provided in terms of value, measured in Million.
11. Are there any specific market keywords associated with the report?
Yes, the market keyword associated with the report is "Connected Ship Market," which aids in identifying and referencing the specific market segment covered.
12. How do I determine which pricing option suits my needs best?
The pricing options vary based on user requirements and access needs. Individual users may opt for single-user licenses, while businesses requiring broader access may choose multi-user or enterprise licenses for cost-effective access to the report.
13. Are there any additional resources or data provided in the Connected Ship Market report?
While the report offers comprehensive insights, it's advisable to review the specific contents or supplementary materials provided to ascertain if additional resources or data are available.
14. How can I stay updated on further developments or reports in the Connected Ship Market?
To stay informed about further developments, trends, and reports in the Connected Ship Market, consider subscribing to industry newsletters, following relevant companies and organizations, or regularly checking reputable industry news sources and publications.
Methodology
Step 1 - Identification of Relevant Samples Size from Population Database


Step 2 - Approaches for Defining Global Market Size (Value, Volume* & Price*)

Note*: In applicable scenarios
Step 3 - Data Sources
Primary Research
- Web Analytics
- Survey Reports
- Research Institute
- Latest Research Reports
- Opinion Leaders
Secondary Research
- Annual Reports
- White Paper
- Latest Press Release
- Industry Association
- Paid Database
- Investor Presentations

Step 4 - Data Triangulation
Involves using different sources of information in order to increase the validity of a study
These sources are likely to be stakeholders in a program - participants, other researchers, program staff, other community members, and so on.
Then we put all data in single framework & apply various statistical tools to find out the dynamic on the market.
During the analysis stage, feedback from the stakeholder groups would be compared to determine areas of agreement as well as areas of divergence


