Key Insights
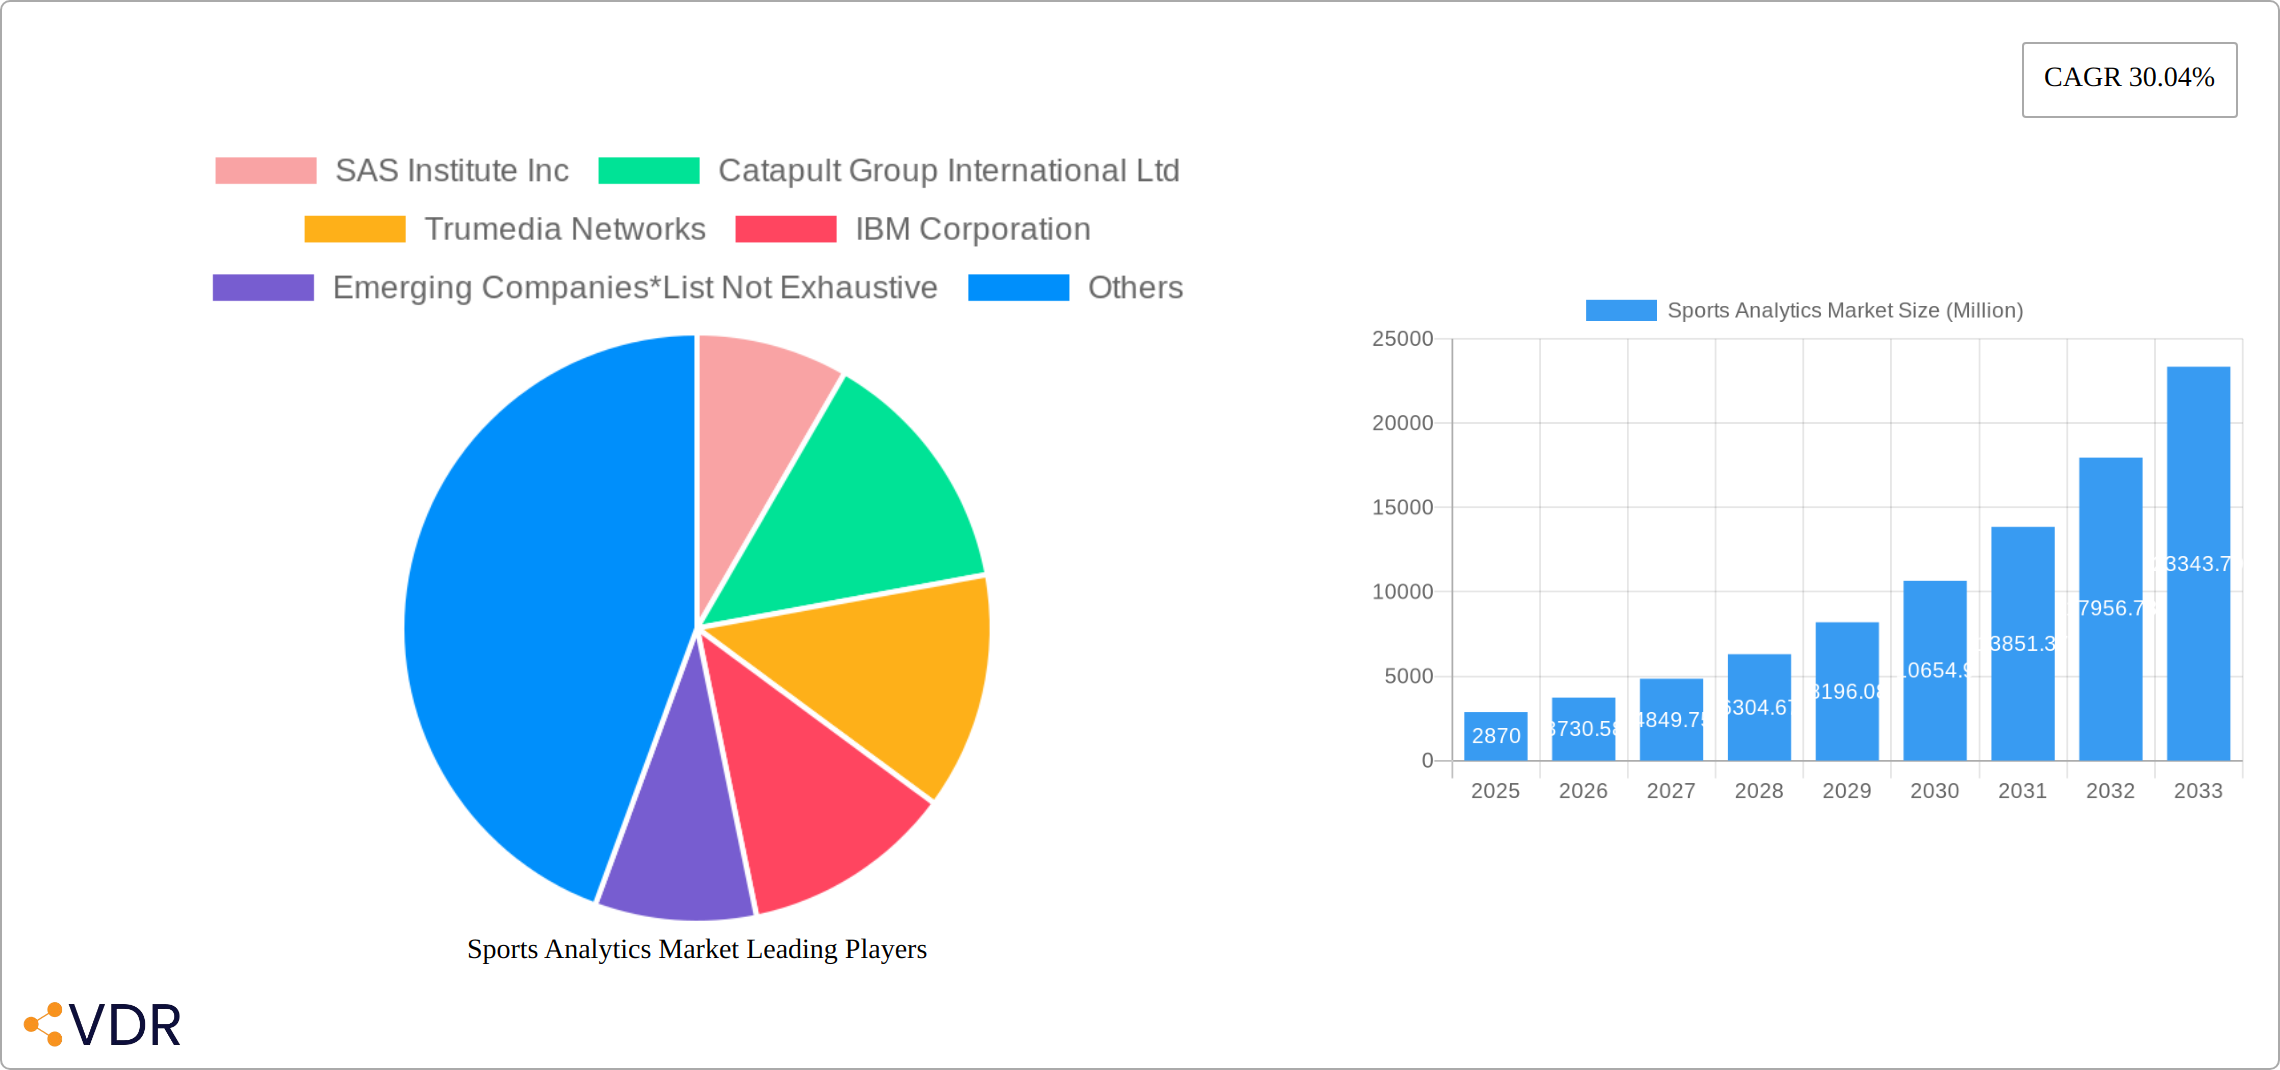
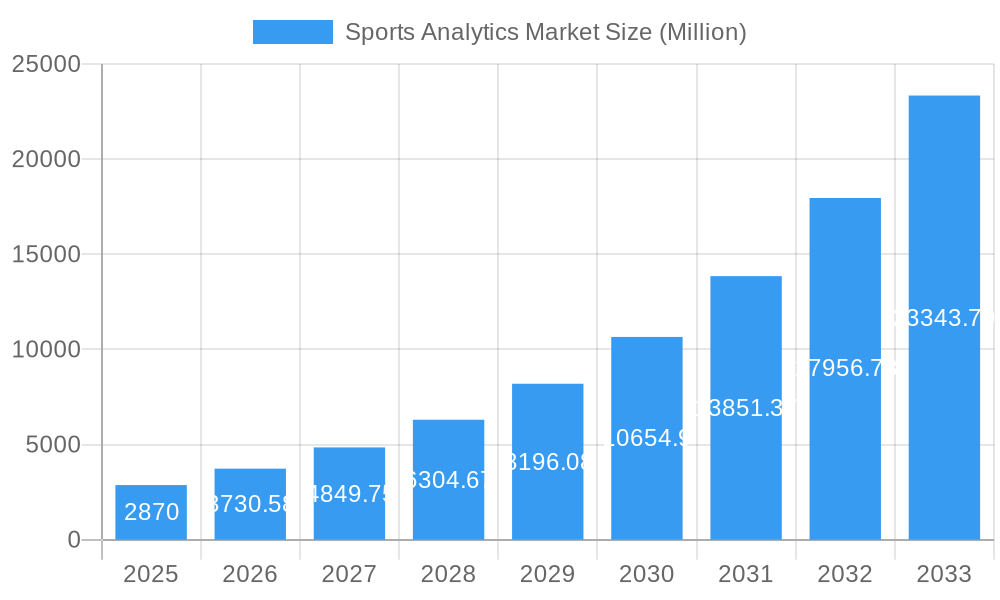
The global sports analytics market is experiencing robust growth, projected to reach \$2.87 billion in 2025 and exhibiting a compound annual growth rate (CAGR) of 30.04% from 2025 to 2033. This expansion is fueled by several key factors. Firstly, the increasing adoption of data-driven strategies by sports teams and organizations to enhance performance, recruitment, and fan engagement is a major driver. Advanced analytics provide insights into player performance, team tactics, and fan behavior, enabling data-informed decision-making across various aspects of the sports industry. Secondly, technological advancements in areas like wearable sensor technology, artificial intelligence (AI), and machine learning (ML) are contributing significantly to the market's growth. These technologies enable the collection and analysis of vast amounts of data, generating actionable insights that were previously unavailable. Finally, the rising popularity of fantasy sports and the growing demand for real-time sports data analysis are further boosting market growth. The market is segmented by sport (football, cricket, hockey, basketball, American football, and others), with football and cricket currently dominating due to their global popularity and significant investment in data-driven approaches. Key players in the market include established technology companies like SAS Institute, IBM, and Oracle, alongside specialized sports analytics providers like Opta Sports and Sportsradar. Geographical expansion is also a significant trend, with North America and Europe currently holding the largest market shares, but significant growth potential is expected from the Asia-Pacific region driven by increasing investments in sports infrastructure and rising fan engagement.
Sports Analytics Market Market Size (In Billion)
The competitive landscape is dynamic, with both established technology giants and specialized sports analytics firms vying for market share. The market is characterized by a high level of innovation, with continuous development of new analytical tools and techniques. While the market faces challenges such as data security concerns and the need for skilled professionals to interpret and utilize the data effectively, the overall outlook remains highly positive. The integration of advanced analytics is becoming increasingly crucial for success in the sports industry, driving further market expansion in the coming years. Future growth will likely be driven by increased adoption of AI and ML, the development of more sophisticated analytical models, and the expansion into new sports and regions.
Sports Analytics Market Company Market Share
Sports Analytics Market: A Comprehensive Report (2019-2033)
This comprehensive report provides an in-depth analysis of the Sports Analytics Market, encompassing market dynamics, growth trends, regional dominance, product landscape, key players, and future outlook. With a study period spanning 2019-2033, a base year of 2025, and a forecast period of 2025-2033, this report is an invaluable resource for industry professionals, investors, and strategic decision-makers. The market is segmented by sport (Football, Cricket, Hockey, Basketball, American Football, Other Sports) and key players include SAS Institute Inc, Catapult Group International Ltd, Trumedia Networks, IBM Corporation, Stats LLC, Opta Sports, Tableau Software Inc, Oracle Corporation, Sportsradar AG, SAP SE, and numerous emerging companies. The report's projected market size for 2025 is xx Million.
Sports Analytics Market Dynamics & Structure
The Sports Analytics market is characterized by moderate concentration, with several large players and a growing number of emerging companies. Technological innovation, particularly in AI and machine learning, is a primary growth driver. Regulatory frameworks concerning data privacy and usage are increasingly influential. Competitive substitutes include traditional scouting methods and less sophisticated analytical tools. End-users are diverse, ranging from professional sports teams and leagues to college athletic programs and individual athletes. M&A activity is expected to remain robust, with strategic acquisitions driving consolidation.
- Market Concentration: Moderately concentrated, with top 5 players holding approximately xx% market share in 2025.
- Technological Innovation: AI, machine learning, and big data analytics are key drivers. Innovation barriers include data access, integration, and talent acquisition.
- Regulatory Frameworks: GDPR, CCPA, and other data privacy regulations are shaping market practices.
- Competitive Substitutes: Traditional scouting methods, basic statistical analysis.
- End-User Demographics: Professional teams, leagues, colleges, individual athletes, broadcasters.
- M&A Trends: xx M&A deals projected in the forecast period (2025-2033).
Sports Analytics Market Growth Trends & Insights
The Sports Analytics market is experiencing robust growth, fueled by the exponential increase in data availability from wearable technology, video analysis, and other sources, coupled with the widespread adoption of sophisticated analytics techniques. This data-driven approach is revolutionizing decision-making across all levels of sports, from professional leagues to amateur competitions. The market's expansion is projected to be substantial throughout the forecast period, driven by several key factors. While professional sports leagues currently lead in adoption rates, a rapid increase is observed in collegiate and amateur settings, indicating a broadening market reach. Technological advancements, particularly in AI and machine learning, are fundamentally reshaping the market landscape, enabling more accurate predictions and personalized insights than ever before. Furthermore, evolving consumer behavior, marked by the increased consumption of data-driven sports content by fans, creates a positive feedback loop, further propelling market growth. This heightened fan engagement necessitates innovative data visualization and presentation methods, driving further market expansion.
- Market Size Evolution: Expected CAGR of xx% from 2025 to 2033, indicating a significant and sustained expansion.
- Adoption Rates: Highest penetration remains in professional leagues, however, significant and rapid growth is evident in collegiate and amateur sectors, suggesting a broader market potential.
- Technological Disruptions: AI, machine learning, and cloud computing are not just driving, but are fundamentally transforming the market by enabling complex predictive modeling and real-time analysis.
- Consumer Behavior Shifts: Increased fan engagement with data-driven content and insights fuels demand for user-friendly platforms and accessible data visualizations.
Dominant Regions, Countries, or Segments in Sports Analytics Market
North America currently commands the largest market share, primarily due to the high adoption of analytics in major professional leagues such as the NFL, NBA, and MLB. Europe closely follows, exhibiting robust growth, particularly within football (soccer) analytics, reflecting the global popularity and data richness of the sport. Globally, the Football segment maintains its dominance, followed by Basketball and American Football. However, regional variations exist, influenced by factors like economic conditions, technological infrastructure development, and the level of professionalization within the respective sports industries. Emerging markets in Asia-Pacific are also demonstrating significant growth potential, driven by increasing popularity of various sports, including cricket and football, and rising investment in sports technology.
- North America: High adoption rates in professional leagues, supported by robust technological infrastructure and significant investment in data-driven solutions.
- Europe: Strong growth in football analytics, fueled by substantial investment in sports technology and a highly competitive market.
- Asia-Pacific: A rapidly expanding market, driven by the increasing popularity of various sports, coupled with a growing investment in data analytics capabilities.
- Dominant Segment: Football (Soccer) retains the largest market share globally, due to its widespread popularity, vast data availability, and substantial investment in analytics.
Sports Analytics Market Product Landscape
The market showcases a diverse range of products, spanning from fundamental statistical analysis tools to sophisticated AI-powered platforms that facilitate predictive analytics and performance optimization. Key product innovations include real-time data capture and analysis, advanced machine learning algorithms capable of identifying complex patterns and predicting outcomes, and user-friendly visualization dashboards designed for accessibility and actionable insights. These tools empower sports teams and organizations to significantly enhance various aspects of their operations, including player recruitment strategies, the refinement of training programs, and improved strategic decision-making during competitions. Unique selling propositions (USPs) often revolve around the accuracy and reliability of the data, the predictive power of the algorithms, the ease of use and integration into existing workflows, and the provision of insightful visualizations and reports.
Key Drivers, Barriers & Challenges in Sports Analytics Market
Key Drivers:
- The continuous increase in data availability from a wide array of sources, including wearable sensors, video analysis systems, and performance tracking technologies.
- Rapid advancements in AI and machine learning, enabling the development of increasingly sophisticated and accurate analytics models.
- The growing acceptance and integration of data-driven decision-making practices within sports organizations at all levels.
Key Barriers & Challenges:
- The substantial cost of implementing and maintaining advanced analytics systems, requiring significant upfront investment and ongoing operational expenditure.
- Data privacy concerns and navigating the complex landscape of data protection regulations and compliance requirements.
- A shortage of skilled professionals possessing the expertise to interpret and effectively apply advanced analytics findings, leading to a demand for skilled data scientists and analysts.
Emerging Opportunities in Sports Analytics Market
Emerging opportunities exist in the expansion into amateur and youth sports, the development of specialized analytics for specific sports, and the integration of analytics with fan engagement platforms. Further opportunities lie in personalized player development plans leveraging AI and data-driven insights, along with wearable sensor technology advancements. Untapped markets include esports and emerging sports globally.
Growth Accelerators in the Sports Analytics Market Industry
Long-term growth will be driven by continued technological advancements, strategic partnerships between technology companies and sports organizations, and the expansion of analytics into new markets and applications. The increasing availability of affordable, user-friendly analytical tools will further accelerate adoption rates among smaller teams and organizations. Expansion into personalized fan experiences and emerging sports such as esports will create new avenues for growth.
Key Players Shaping the Sports Analytics Market Market
- SAS Institute Inc
- Catapult Group International Ltd
- Trumedia Networks
- IBM Corporation
- Emerging Companies*List Not Exhaustive
- Stats LLC
- Opta Sports
- Tableau Software Inc
- Oracle Corporation
- Sportsradar AG
- SAP SE
Notable Milestones in Sports Analytics Market Sector
- October 2023: Texas A&M Athletics partners with Gemini Sports Analytics to leverage AI-powered analytics for athlete support and strategic decision-making.
- February 2023: Gemini Sports Analytics partners with SIS (Sports Info Solutions) to integrate data and expand analytics solutions for sports organizations.
In-Depth Sports Analytics Market Market Outlook
The Sports Analytics market is poised for substantial and sustained growth over the coming decade. This positive trajectory is fueled by several interconnected factors, including ongoing technological innovation, the ever-increasing availability of high-quality data, and the broadening adoption of data-driven strategies across the entire sports industry. Strategic partnerships, mergers and acquisitions, and expansion into untapped markets will play crucial roles in shaping this growth. The future success of the market hinges upon continued advancements in AI, machine learning, and particularly in the development of intuitive and accessible data visualization tools, which will further unlock previously unavailable insights and enhance decision-making at all levels of sport, from individual athletes to league-wide strategic planning.
Sports Analytics Market Segmentation
-
1. Sport
- 1.1. Football
- 1.2. Cricket
- 1.3. Hockey
- 1.4. Basketball
- 1.5. American Football
- 1.6. Other Sports
Sports Analytics Market Segmentation By Geography
- 1. North America
- 2. Europe
- 3. Asia Pacific
- 4. Latin America
- 5. Middle East and Africa
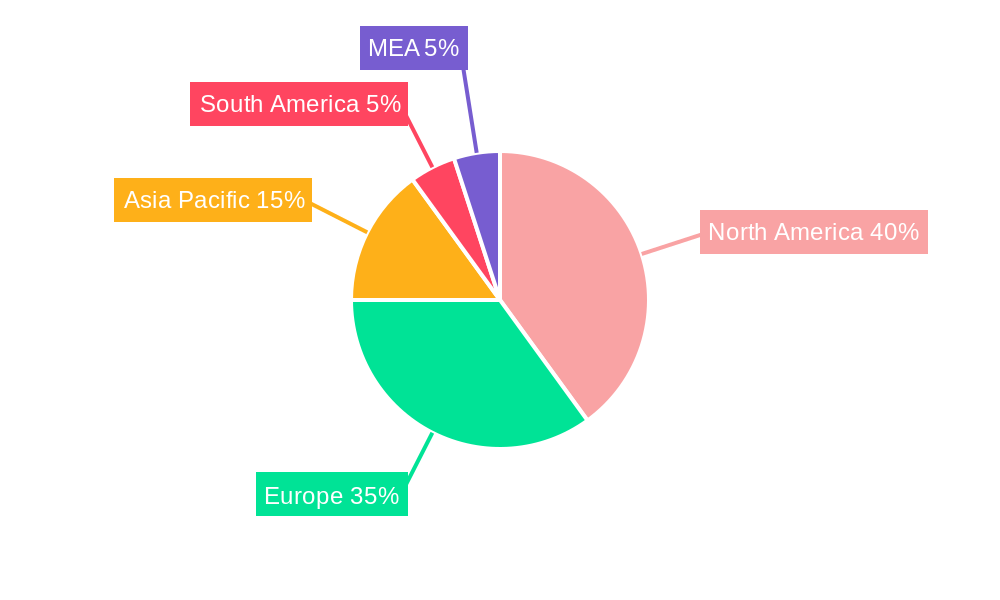
Sports Analytics Market Regional Market Share
Geographic Coverage of Sports Analytics Market
Sports Analytics Market REPORT HIGHLIGHTS
| Aspects | Details |
|---|---|
| Study Period | 2020-2034 |
| Base Year | 2025 |
| Estimated Year | 2026 |
| Forecast Period | 2026-2034 |
| Historical Period | 2020-2025 |
| Growth Rate | CAGR of 30.04% from 2020-2034 |
| Segmentation |
|
Table of Contents
- 1. Introduction
- 1.1. Research Scope
- 1.2. Market Segmentation
- 1.3. Research Methodology
- 1.4. Definitions and Assumptions
- 2. Executive Summary
- 2.1. Introduction
- 3. Market Dynamics
- 3.1. Introduction
- 3.2. Market Drivers
- 3.2.1 Rising Adoption of Big Data Analytics
- 3.2.2 AI and ML Technologies; Increase in Investments in the Newer Technologies
- 3.3. Market Restrains
- 3.3.1. Lack of Awareness About the Benefits of Sports Analytics Solutions
- 3.4. Market Trends
- 3.4.1. Football Sport is Expected to Hold Significant Market Share
- 4. Market Factor Analysis
- 4.1. Porters Five Forces
- 4.2. Supply/Value Chain
- 4.3. PESTEL analysis
- 4.4. Market Entropy
- 4.5. Patent/Trademark Analysis
- 5. Global Sports Analytics Market Analysis, Insights and Forecast, 2020-2032
- 5.1. Market Analysis, Insights and Forecast - by Sport
- 5.1.1. Football
- 5.1.2. Cricket
- 5.1.3. Hockey
- 5.1.4. Basketball
- 5.1.5. American Football
- 5.1.6. Other Sports
- 5.2. Market Analysis, Insights and Forecast - by Region
- 5.2.1. North America
- 5.2.2. Europe
- 5.2.3. Asia Pacific
- 5.2.4. Latin America
- 5.2.5. Middle East and Africa
- 5.1. Market Analysis, Insights and Forecast - by Sport
- 6. North America Sports Analytics Market Analysis, Insights and Forecast, 2020-2032
- 6.1. Market Analysis, Insights and Forecast - by Sport
- 6.1.1. Football
- 6.1.2. Cricket
- 6.1.3. Hockey
- 6.1.4. Basketball
- 6.1.5. American Football
- 6.1.6. Other Sports
- 6.1. Market Analysis, Insights and Forecast - by Sport
- 7. Europe Sports Analytics Market Analysis, Insights and Forecast, 2020-2032
- 7.1. Market Analysis, Insights and Forecast - by Sport
- 7.1.1. Football
- 7.1.2. Cricket
- 7.1.3. Hockey
- 7.1.4. Basketball
- 7.1.5. American Football
- 7.1.6. Other Sports
- 7.1. Market Analysis, Insights and Forecast - by Sport
- 8. Asia Pacific Sports Analytics Market Analysis, Insights and Forecast, 2020-2032
- 8.1. Market Analysis, Insights and Forecast - by Sport
- 8.1.1. Football
- 8.1.2. Cricket
- 8.1.3. Hockey
- 8.1.4. Basketball
- 8.1.5. American Football
- 8.1.6. Other Sports
- 8.1. Market Analysis, Insights and Forecast - by Sport
- 9. Latin America Sports Analytics Market Analysis, Insights and Forecast, 2020-2032
- 9.1. Market Analysis, Insights and Forecast - by Sport
- 9.1.1. Football
- 9.1.2. Cricket
- 9.1.3. Hockey
- 9.1.4. Basketball
- 9.1.5. American Football
- 9.1.6. Other Sports
- 9.1. Market Analysis, Insights and Forecast - by Sport
- 10. Middle East and Africa Sports Analytics Market Analysis, Insights and Forecast, 2020-2032
- 10.1. Market Analysis, Insights and Forecast - by Sport
- 10.1.1. Football
- 10.1.2. Cricket
- 10.1.3. Hockey
- 10.1.4. Basketball
- 10.1.5. American Football
- 10.1.6. Other Sports
- 10.1. Market Analysis, Insights and Forecast - by Sport
- 11. Competitive Analysis
- 11.1. Global Market Share Analysis 2025
- 11.2. Company Profiles
- 11.2.1 SAS Institute Inc
- 11.2.1.1. Overview
- 11.2.1.2. Products
- 11.2.1.3. SWOT Analysis
- 11.2.1.4. Recent Developments
- 11.2.1.5. Financials (Based on Availability)
- 11.2.2 Catapult Group International Ltd
- 11.2.2.1. Overview
- 11.2.2.2. Products
- 11.2.2.3. SWOT Analysis
- 11.2.2.4. Recent Developments
- 11.2.2.5. Financials (Based on Availability)
- 11.2.3 Trumedia Networks
- 11.2.3.1. Overview
- 11.2.3.2. Products
- 11.2.3.3. SWOT Analysis
- 11.2.3.4. Recent Developments
- 11.2.3.5. Financials (Based on Availability)
- 11.2.4 IBM Corporation
- 11.2.4.1. Overview
- 11.2.4.2. Products
- 11.2.4.3. SWOT Analysis
- 11.2.4.4. Recent Developments
- 11.2.4.5. Financials (Based on Availability)
- 11.2.5 Emerging Companies*List Not Exhaustive
- 11.2.5.1. Overview
- 11.2.5.2. Products
- 11.2.5.3. SWOT Analysis
- 11.2.5.4. Recent Developments
- 11.2.5.5. Financials (Based on Availability)
- 11.2.6 Stats LLC
- 11.2.6.1. Overview
- 11.2.6.2. Products
- 11.2.6.3. SWOT Analysis
- 11.2.6.4. Recent Developments
- 11.2.6.5. Financials (Based on Availability)
- 11.2.7 Opta Sports
- 11.2.7.1. Overview
- 11.2.7.2. Products
- 11.2.7.3. SWOT Analysis
- 11.2.7.4. Recent Developments
- 11.2.7.5. Financials (Based on Availability)
- 11.2.8 Tableau Software Inc
- 11.2.8.1. Overview
- 11.2.8.2. Products
- 11.2.8.3. SWOT Analysis
- 11.2.8.4. Recent Developments
- 11.2.8.5. Financials (Based on Availability)
- 11.2.9 Oracle Corporation
- 11.2.9.1. Overview
- 11.2.9.2. Products
- 11.2.9.3. SWOT Analysis
- 11.2.9.4. Recent Developments
- 11.2.9.5. Financials (Based on Availability)
- 11.2.10 Sportsradar AG
- 11.2.10.1. Overview
- 11.2.10.2. Products
- 11.2.10.3. SWOT Analysis
- 11.2.10.4. Recent Developments
- 11.2.10.5. Financials (Based on Availability)
- 11.2.11 SAP SE
- 11.2.11.1. Overview
- 11.2.11.2. Products
- 11.2.11.3. SWOT Analysis
- 11.2.11.4. Recent Developments
- 11.2.11.5. Financials (Based on Availability)
- 11.2.1 SAS Institute Inc
List of Figures
- Figure 1: Global Sports Analytics Market Revenue Breakdown (Million, %) by Region 2025 & 2033
- Figure 2: North America Sports Analytics Market Revenue (Million), by Sport 2025 & 2033
- Figure 3: North America Sports Analytics Market Revenue Share (%), by Sport 2025 & 2033
- Figure 4: North America Sports Analytics Market Revenue (Million), by Country 2025 & 2033
- Figure 5: North America Sports Analytics Market Revenue Share (%), by Country 2025 & 2033
- Figure 6: Europe Sports Analytics Market Revenue (Million), by Sport 2025 & 2033
- Figure 7: Europe Sports Analytics Market Revenue Share (%), by Sport 2025 & 2033
- Figure 8: Europe Sports Analytics Market Revenue (Million), by Country 2025 & 2033
- Figure 9: Europe Sports Analytics Market Revenue Share (%), by Country 2025 & 2033
- Figure 10: Asia Pacific Sports Analytics Market Revenue (Million), by Sport 2025 & 2033
- Figure 11: Asia Pacific Sports Analytics Market Revenue Share (%), by Sport 2025 & 2033
- Figure 12: Asia Pacific Sports Analytics Market Revenue (Million), by Country 2025 & 2033
- Figure 13: Asia Pacific Sports Analytics Market Revenue Share (%), by Country 2025 & 2033
- Figure 14: Latin America Sports Analytics Market Revenue (Million), by Sport 2025 & 2033
- Figure 15: Latin America Sports Analytics Market Revenue Share (%), by Sport 2025 & 2033
- Figure 16: Latin America Sports Analytics Market Revenue (Million), by Country 2025 & 2033
- Figure 17: Latin America Sports Analytics Market Revenue Share (%), by Country 2025 & 2033
- Figure 18: Middle East and Africa Sports Analytics Market Revenue (Million), by Sport 2025 & 2033
- Figure 19: Middle East and Africa Sports Analytics Market Revenue Share (%), by Sport 2025 & 2033
- Figure 20: Middle East and Africa Sports Analytics Market Revenue (Million), by Country 2025 & 2033
- Figure 21: Middle East and Africa Sports Analytics Market Revenue Share (%), by Country 2025 & 2033
List of Tables
- Table 1: Global Sports Analytics Market Revenue Million Forecast, by Sport 2020 & 2033
- Table 2: Global Sports Analytics Market Revenue Million Forecast, by Region 2020 & 2033
- Table 3: Global Sports Analytics Market Revenue Million Forecast, by Sport 2020 & 2033
- Table 4: Global Sports Analytics Market Revenue Million Forecast, by Country 2020 & 2033
- Table 5: Global Sports Analytics Market Revenue Million Forecast, by Sport 2020 & 2033
- Table 6: Global Sports Analytics Market Revenue Million Forecast, by Country 2020 & 2033
- Table 7: Global Sports Analytics Market Revenue Million Forecast, by Sport 2020 & 2033
- Table 8: Global Sports Analytics Market Revenue Million Forecast, by Country 2020 & 2033
- Table 9: Global Sports Analytics Market Revenue Million Forecast, by Sport 2020 & 2033
- Table 10: Global Sports Analytics Market Revenue Million Forecast, by Country 2020 & 2033
- Table 11: Global Sports Analytics Market Revenue Million Forecast, by Sport 2020 & 2033
- Table 12: Global Sports Analytics Market Revenue Million Forecast, by Country 2020 & 2033
Frequently Asked Questions
1. What is the projected Compound Annual Growth Rate (CAGR) of the Sports Analytics Market?
The projected CAGR is approximately 30.04%.
2. Which companies are prominent players in the Sports Analytics Market?
Key companies in the market include SAS Institute Inc, Catapult Group International Ltd, Trumedia Networks, IBM Corporation, Emerging Companies*List Not Exhaustive, Stats LLC, Opta Sports, Tableau Software Inc, Oracle Corporation, Sportsradar AG, SAP SE.
3. What are the main segments of the Sports Analytics Market?
The market segments include Sport.
4. Can you provide details about the market size?
The market size is estimated to be USD 2.87 Million as of 2022.
5. What are some drivers contributing to market growth?
Rising Adoption of Big Data Analytics. AI and ML Technologies; Increase in Investments in the Newer Technologies.
6. What are the notable trends driving market growth?
Football Sport is Expected to Hold Significant Market Share.
7. Are there any restraints impacting market growth?
Lack of Awareness About the Benefits of Sports Analytics Solutions.
8. Can you provide examples of recent developments in the market?
October 2023, Texas A&M Athletics Sports Science announced that it has entered into an arrangement with Gemini Sports Analytics to offer the Aggies' staff Gemini’s AI software platform built-for sports that is projected to empower the Aggies to access prognostic analytics in addition to metrics to aid support student-athletes. The Gemini application authorizes stakeholders by offering predictive data analytics to the end users, cumulative interdisciplinary professionals' efficiency, and permitting high-level decision-makers to make game-changing choices faster.
9. What pricing options are available for accessing the report?
Pricing options include single-user, multi-user, and enterprise licenses priced at USD 4750, USD 5250, and USD 8750 respectively.
10. Is the market size provided in terms of value or volume?
The market size is provided in terms of value, measured in Million.
11. Are there any specific market keywords associated with the report?
Yes, the market keyword associated with the report is "Sports Analytics Market," which aids in identifying and referencing the specific market segment covered.
12. How do I determine which pricing option suits my needs best?
The pricing options vary based on user requirements and access needs. Individual users may opt for single-user licenses, while businesses requiring broader access may choose multi-user or enterprise licenses for cost-effective access to the report.
13. Are there any additional resources or data provided in the Sports Analytics Market report?
While the report offers comprehensive insights, it's advisable to review the specific contents or supplementary materials provided to ascertain if additional resources or data are available.
14. How can I stay updated on further developments or reports in the Sports Analytics Market?
To stay informed about further developments, trends, and reports in the Sports Analytics Market, consider subscribing to industry newsletters, following relevant companies and organizations, or regularly checking reputable industry news sources and publications.
Methodology
Step 1 - Identification of Relevant Samples Size from Population Database


Step 2 - Approaches for Defining Global Market Size (Value, Volume* & Price*)

Note*: In applicable scenarios
Step 3 - Data Sources
Primary Research
- Web Analytics
- Survey Reports
- Research Institute
- Latest Research Reports
- Opinion Leaders
Secondary Research
- Annual Reports
- White Paper
- Latest Press Release
- Industry Association
- Paid Database
- Investor Presentations

Step 4 - Data Triangulation
Involves using different sources of information in order to increase the validity of a study
These sources are likely to be stakeholders in a program - participants, other researchers, program staff, other community members, and so on.
Then we put all data in single framework & apply various statistical tools to find out the dynamic on the market.
During the analysis stage, feedback from the stakeholder groups would be compared to determine areas of agreement as well as areas of divergence

