
Key Insights
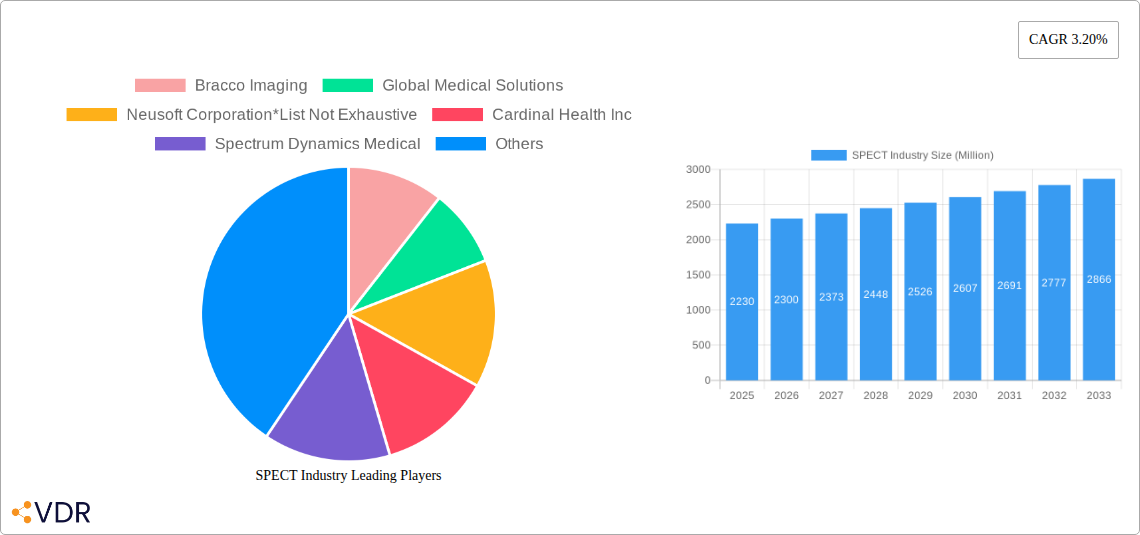
The global Single-Photon Emission Computed Tomography (SPECT) industry, valued at $2.23 billion in 2025, is projected to experience steady growth, driven primarily by the increasing prevalence of cardiovascular diseases and cancer, necessitating advanced diagnostic imaging. Technological advancements, such as improved detector technology and hybrid imaging systems combining SPECT with other modalities like CT, are further fueling market expansion. The rising geriatric population, susceptible to age-related conditions diagnosable via SPECT, also contributes significantly to market demand. While regulatory hurdles and high equipment costs pose challenges, the overall market outlook remains positive, particularly in regions with robust healthcare infrastructure and growing awareness of advanced diagnostic techniques. Segment-wise, Tc-99m radioisotopes currently dominate due to their cost-effectiveness and widespread availability, but other isotopes are gaining traction due to their superior imaging capabilities in specific applications. Oncology and cardiology remain the largest application segments, reflecting the high incidence of heart disease and various cancers globally.
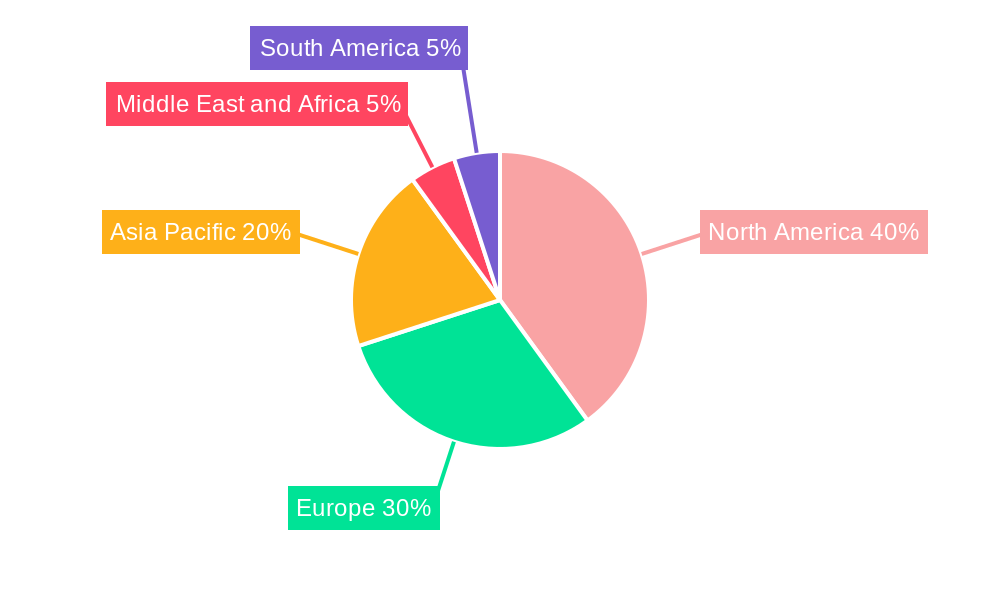
The Asia-Pacific region, driven by expanding healthcare infrastructure and rising disposable incomes in countries like China and India, is anticipated to witness significant growth in the coming years. North America, currently a dominant market, will maintain a substantial share due to high adoption rates of advanced technologies and established healthcare systems. Europe, with its sophisticated medical infrastructure, will also see considerable market growth. The competitive landscape is characterized by established players like GE Healthcare and Bracco Imaging, alongside emerging companies offering innovative solutions. Strategic collaborations, technological advancements, and expansion into emerging markets will be crucial for companies seeking to maintain a competitive edge in this evolving landscape. Further growth will be influenced by the development of more specific and sensitive radiopharmaceuticals, improved image quality, and the integration of SPECT into more streamlined healthcare workflows.
This comprehensive report provides an in-depth analysis of the SPECT (Single-Photon Emission Computed Tomography) industry, encompassing market dynamics, growth trends, regional segmentation, product landscape, key players, and future outlook. The report covers the period from 2019 to 2033, with a focus on the forecast period of 2025-2033 and a base year of 2025. The parent market is the medical imaging market, and the child market is nuclear medicine imaging. This report is invaluable for industry professionals, investors, and researchers seeking a thorough understanding of this dynamic sector. Market values are presented in Million units.
SPECT Industry Market Dynamics & Structure
The SPECT industry is characterized by moderate market concentration, with several key players holding significant market share. Technological innovation, particularly in detector technology and image reconstruction algorithms, is a key driver. Stringent regulatory frameworks, including those governing radioisotope production and handling, significantly influence market dynamics. Competitive pressures stem from alternative imaging modalities like PET and MRI. End-user demographics, particularly the aging population and rising prevalence of chronic diseases, fuel market growth. M&A activity has been relatively stable, with xx deals recorded between 2019 and 2024, resulting in an average annual deal value of xx Million.
- Market Concentration: Moderately concentrated, with top 5 players holding xx% market share (2025).
- Technological Innovation: Focus on improved image resolution, faster scan times, and reduced radiation dose.
- Regulatory Landscape: Stringent regulations impacting radioisotope production and usage.
- Competitive Substitutes: PET, MRI, and CT scans pose competitive challenges.
- End-User Demographics: Aging population and increased prevalence of cardiovascular and neurological diseases drive demand.
- M&A Activity: xx deals between 2019-2024, averaging xx Million per deal.
SPECT Industry Growth Trends & Insights
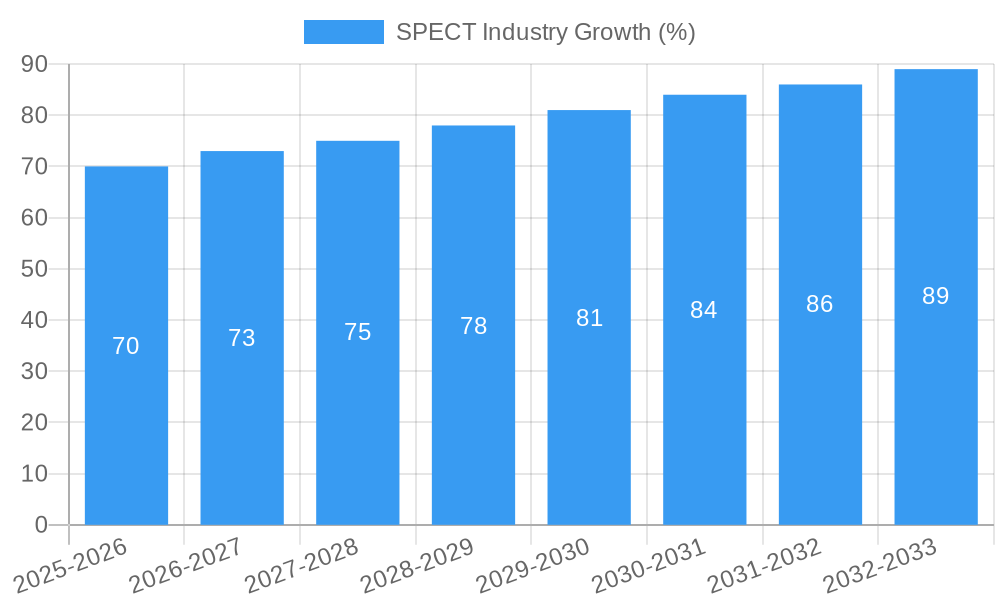
The global SPECT industry experienced steady growth during the historical period (2019-2024), with a CAGR of xx%. This growth is attributed to factors such as the increasing prevalence of chronic diseases necessitating diagnostic imaging, technological advancements leading to improved image quality and reduced procedure times, and rising healthcare expenditure globally. The market size in 2025 is estimated at xx Million, and is projected to reach xx Million by 2033, exhibiting a CAGR of xx% during the forecast period (2025-2033). Market penetration in key regions remains relatively high, with further growth expected from emerging economies. Technological disruptions, such as the development of advanced detector technology and AI-powered image analysis tools, are expected to further accelerate market growth. Consumer behavior is shifting towards minimally invasive procedures and faster diagnostic options, favouring the adoption of SPECT imaging.
Dominant Regions, Countries, or Segments in SPECT Industry
North America currently holds the largest market share in the SPECT industry, driven by factors such as high healthcare expenditure, advanced healthcare infrastructure, and a large patient pool. Within this region, the United States dominates due to its robust healthcare system and high adoption rates of advanced medical technologies. Europe follows as a significant market, with Germany and France exhibiting strong growth.
By application, Oncology dominates the market, accounting for xx% of the overall revenue in 2025 due to the widespread use of SPECT in cancer diagnosis and staging. Cardiology holds a significant share as well. By type of radioisotopes, Tc-99m is the dominant radioisotope, due to its cost-effectiveness and widespread availability.
- Key Drivers (North America): High healthcare expenditure, advanced healthcare infrastructure, large patient pool.
- Key Drivers (Europe): Growing geriatric population, increasing prevalence of chronic diseases.
- Dominant Segments: Oncology (xx%), Cardiology (xx%), Tc-99m (xx%).
SPECT Industry Product Landscape
The SPECT industry offers a range of products, including SPECT cameras, radiopharmaceuticals, and image processing software. Recent innovations focus on improved image resolution, faster scan times, and reduced radiation doses. Manufacturers are investing in advanced detector technologies, such as cadmium zinc telluride (CZT) detectors, to enhance image quality and reduce scan times. Unique selling propositions often center around superior image quality, ease of use, and cost-effectiveness.
Key Drivers, Barriers & Challenges in SPECT Industry
Key Drivers: The rising prevalence of cardiovascular diseases, neurological disorders, and cancer are major drivers. Technological advancements, such as improved image quality and reduced radiation dose, also contribute to market growth. Increasing government initiatives to improve healthcare infrastructure in developing countries also support market expansion.
Challenges: High cost of equipment and radiopharmaceuticals, limited availability of skilled professionals, and stringent regulatory approvals create significant barriers to market entry. Competition from alternative imaging modalities like PET and MRI also poses a challenge. Supply chain disruptions relating to radioisotope production can also impact market growth.
Emerging Opportunities in SPECT Industry
Emerging opportunities lie in the development of new radiotracers for improved diagnostic capabilities, expansion into emerging markets with growing healthcare infrastructure, and integration of AI and machine learning in image analysis for enhanced diagnostic accuracy. The development of hybrid imaging systems combining SPECT with other modalities like CT or MRI also presents significant potential.
Growth Accelerators in the SPECT Industry
Technological advancements in detector technology and image reconstruction algorithms are key growth catalysts. Strategic partnerships between manufacturers and healthcare providers can accelerate market penetration. Expansion into emerging markets with unmet clinical needs will fuel significant long-term growth.
Key Players Shaping the SPECT Industry Market
- Bracco Imaging
- Global Medical Solutions
- Neusoft Corporation
- Cardinal Health Inc
- Spectrum Dynamics Medical
- Guerbet
- NTP Radioisotopes SOC Ltd
- Lantheus Medical Imaging Inc
- Gamma Medica Inc
- GE Healthcare (GE Company)
- Curium
- Digirad Corporation
Notable Milestones in SPECT Industry Sector
- 2020: Launch of a new generation SPECT camera with improved resolution by GE Healthcare.
- 2021: Acquisition of a leading radiopharmaceutical company by Bracco Imaging.
- 2022: Approval of a novel radiotracer for neurodegenerative diseases by the FDA.
- 2023: Introduction of AI-powered image analysis software by a key player. (Further milestones to be added as they become available)
In-Depth SPECT Industry Market Outlook
The SPECT industry is poised for continued growth, driven by technological advancements, increasing healthcare expenditure, and the rising prevalence of chronic diseases. Strategic partnerships, new product launches, and expansion into untapped markets will further enhance market potential. The focus on improved image quality, reduced radiation dose, and cost-effective solutions will be key factors influencing market dynamics in the coming years. The market is expected to witness strong growth in the next decade, creating numerous strategic opportunities for industry players.
SPECT Industry Segmentation
-
1. Type of Radioisotopes
- 1.1. Tc-99m
- 1.2. Ra-223
- 1.3. Ga-67
- 1.4. I-123
- 1.5. Other Types of Radioisotopes
-
2. Application
- 2.1. Oncology
- 2.2. Cardiology
- 2.3. Neurology
- 2.4. Other Applications
SPECT Industry Segmentation By Geography
-
1. North America
- 1.1. United States
- 1.2. Canada
- 1.3. Mexico
-
2. Europe
- 2.1. Germany
- 2.2. United Kingdom
- 2.3. France
- 2.4. Italy
- 2.5. Spain
- 2.6. Rest of Europe
-
3. Asia Pacific
- 3.1. China
- 3.2. Japan
- 3.3. India
- 3.4. Australia
- 3.5. South Korea
- 3.6. Rest of Asia Pacific
-
4. Middle East and Africa
- 4.1. GCC
- 4.2. South Africa
- 4.3. Rest of Middle East and Africa
-
5. South America
- 5.1. Brazil
- 5.2. Argentina
- 5.3. Rest of South America
SPECT Industry REPORT HIGHLIGHTS
| Aspects | Details |
|---|---|
| Study Period | 2019-2033 |
| Base Year | 2024 |
| Estimated Year | 2025 |
| Forecast Period | 2025-2033 |
| Historical Period | 2019-2024 |
| Growth Rate | CAGR of 3.20% from 2019-2033 |
| Segmentation |
|
Table of Contents
- 1. Introduction
- 1.1. Research Scope
- 1.2. Market Segmentation
- 1.3. Research Methodology
- 1.4. Definitions and Assumptions
- 2. Executive Summary
- 2.1. Introduction
- 3. Market Dynamics
- 3.1. Introduction
- 3.2. Market Drivers
- 3.2.1. Increasing Demand for SPECT Analysis in Radiopharmaceuticals; Growing Geriatric Population; Improvements in SPECT Imaging Technology
- 3.3. Market Restrains
- 3.3.1. Shorter Half-life of Radioisotopes; Stringent Regulatory Guidelines
- 3.4. Market Trends
- 3.4.1. The Gallium-67 Segment is Expected to Witness a Large CAGR Over the Forecast Period in the Single Photon Emission Computed Tomography (SPECT) Market
- 4. Market Factor Analysis
- 4.1. Porters Five Forces
- 4.2. Supply/Value Chain
- 4.3. PESTEL analysis
- 4.4. Market Entropy
- 4.5. Patent/Trademark Analysis
- 5. Global SPECT Industry Analysis, Insights and Forecast, 2019-2031
- 5.1. Market Analysis, Insights and Forecast - by Type of Radioisotopes
- 5.1.1. Tc-99m
- 5.1.2. Ra-223
- 5.1.3. Ga-67
- 5.1.4. I-123
- 5.1.5. Other Types of Radioisotopes
- 5.2. Market Analysis, Insights and Forecast - by Application
- 5.2.1. Oncology
- 5.2.2. Cardiology
- 5.2.3. Neurology
- 5.2.4. Other Applications
- 5.3. Market Analysis, Insights and Forecast - by Region
- 5.3.1. North America
- 5.3.2. Europe
- 5.3.3. Asia Pacific
- 5.3.4. Middle East and Africa
- 5.3.5. South America
- 5.1. Market Analysis, Insights and Forecast - by Type of Radioisotopes
- 6. North America SPECT Industry Analysis, Insights and Forecast, 2019-2031
- 6.1. Market Analysis, Insights and Forecast - by Type of Radioisotopes
- 6.1.1. Tc-99m
- 6.1.2. Ra-223
- 6.1.3. Ga-67
- 6.1.4. I-123
- 6.1.5. Other Types of Radioisotopes
- 6.2. Market Analysis, Insights and Forecast - by Application
- 6.2.1. Oncology
- 6.2.2. Cardiology
- 6.2.3. Neurology
- 6.2.4. Other Applications
- 6.1. Market Analysis, Insights and Forecast - by Type of Radioisotopes
- 7. Europe SPECT Industry Analysis, Insights and Forecast, 2019-2031
- 7.1. Market Analysis, Insights and Forecast - by Type of Radioisotopes
- 7.1.1. Tc-99m
- 7.1.2. Ra-223
- 7.1.3. Ga-67
- 7.1.4. I-123
- 7.1.5. Other Types of Radioisotopes
- 7.2. Market Analysis, Insights and Forecast - by Application
- 7.2.1. Oncology
- 7.2.2. Cardiology
- 7.2.3. Neurology
- 7.2.4. Other Applications
- 7.1. Market Analysis, Insights and Forecast - by Type of Radioisotopes
- 8. Asia Pacific SPECT Industry Analysis, Insights and Forecast, 2019-2031
- 8.1. Market Analysis, Insights and Forecast - by Type of Radioisotopes
- 8.1.1. Tc-99m
- 8.1.2. Ra-223
- 8.1.3. Ga-67
- 8.1.4. I-123
- 8.1.5. Other Types of Radioisotopes
- 8.2. Market Analysis, Insights and Forecast - by Application
- 8.2.1. Oncology
- 8.2.2. Cardiology
- 8.2.3. Neurology
- 8.2.4. Other Applications
- 8.1. Market Analysis, Insights and Forecast - by Type of Radioisotopes
- 9. Middle East and Africa SPECT Industry Analysis, Insights and Forecast, 2019-2031
- 9.1. Market Analysis, Insights and Forecast - by Type of Radioisotopes
- 9.1.1. Tc-99m
- 9.1.2. Ra-223
- 9.1.3. Ga-67
- 9.1.4. I-123
- 9.1.5. Other Types of Radioisotopes
- 9.2. Market Analysis, Insights and Forecast - by Application
- 9.2.1. Oncology
- 9.2.2. Cardiology
- 9.2.3. Neurology
- 9.2.4. Other Applications
- 9.1. Market Analysis, Insights and Forecast - by Type of Radioisotopes
- 10. South America SPECT Industry Analysis, Insights and Forecast, 2019-2031
- 10.1. Market Analysis, Insights and Forecast - by Type of Radioisotopes
- 10.1.1. Tc-99m
- 10.1.2. Ra-223
- 10.1.3. Ga-67
- 10.1.4. I-123
- 10.1.5. Other Types of Radioisotopes
- 10.2. Market Analysis, Insights and Forecast - by Application
- 10.2.1. Oncology
- 10.2.2. Cardiology
- 10.2.3. Neurology
- 10.2.4. Other Applications
- 10.1. Market Analysis, Insights and Forecast - by Type of Radioisotopes
- 11. North America SPECT Industry Analysis, Insights and Forecast, 2019-2031
- 11.1. Market Analysis, Insights and Forecast - By Country/Sub-region
- 11.1.1 United States
- 11.1.2 Canada
- 11.1.3 Mexico
- 12. Europe SPECT Industry Analysis, Insights and Forecast, 2019-2031
- 12.1. Market Analysis, Insights and Forecast - By Country/Sub-region
- 12.1.1 Germany
- 12.1.2 United Kingdom
- 12.1.3 France
- 12.1.4 Italy
- 12.1.5 Spain
- 12.1.6 Rest of Europe
- 13. Asia Pacific SPECT Industry Analysis, Insights and Forecast, 2019-2031
- 13.1. Market Analysis, Insights and Forecast - By Country/Sub-region
- 13.1.1 China
- 13.1.2 Japan
- 13.1.3 India
- 13.1.4 Australia
- 13.1.5 South Korea
- 13.1.6 Rest of Asia Pacific
- 14. Middle East and Africa SPECT Industry Analysis, Insights and Forecast, 2019-2031
- 14.1. Market Analysis, Insights and Forecast - By Country/Sub-region
- 14.1.1 GCC
- 14.1.2 South Africa
- 14.1.3 Rest of Middle East and Africa
- 15. South America SPECT Industry Analysis, Insights and Forecast, 2019-2031
- 15.1. Market Analysis, Insights and Forecast - By Country/Sub-region
- 15.1.1 Brazil
- 15.1.2 Argentina
- 15.1.3 Rest of South America
- 16. Competitive Analysis
- 16.1. Global Market Share Analysis 2024
- 16.2. Company Profiles
- 16.2.1 Bracco Imaging
- 16.2.1.1. Overview
- 16.2.1.2. Products
- 16.2.1.3. SWOT Analysis
- 16.2.1.4. Recent Developments
- 16.2.1.5. Financials (Based on Availability)
- 16.2.2 Global Medical Solutions
- 16.2.2.1. Overview
- 16.2.2.2. Products
- 16.2.2.3. SWOT Analysis
- 16.2.2.4. Recent Developments
- 16.2.2.5. Financials (Based on Availability)
- 16.2.3 Neusoft Corporation*List Not Exhaustive
- 16.2.3.1. Overview
- 16.2.3.2. Products
- 16.2.3.3. SWOT Analysis
- 16.2.3.4. Recent Developments
- 16.2.3.5. Financials (Based on Availability)
- 16.2.4 Cardinal Health Inc
- 16.2.4.1. Overview
- 16.2.4.2. Products
- 16.2.4.3. SWOT Analysis
- 16.2.4.4. Recent Developments
- 16.2.4.5. Financials (Based on Availability)
- 16.2.5 Spectrum Dynamics Medical
- 16.2.5.1. Overview
- 16.2.5.2. Products
- 16.2.5.3. SWOT Analysis
- 16.2.5.4. Recent Developments
- 16.2.5.5. Financials (Based on Availability)
- 16.2.6 Guerbet
- 16.2.6.1. Overview
- 16.2.6.2. Products
- 16.2.6.3. SWOT Analysis
- 16.2.6.4. Recent Developments
- 16.2.6.5. Financials (Based on Availability)
- 16.2.7 NTP Radioisotopes SOC Ltd
- 16.2.7.1. Overview
- 16.2.7.2. Products
- 16.2.7.3. SWOT Analysis
- 16.2.7.4. Recent Developments
- 16.2.7.5. Financials (Based on Availability)
- 16.2.8 Lantheus Medical Imaging Inc
- 16.2.8.1. Overview
- 16.2.8.2. Products
- 16.2.8.3. SWOT Analysis
- 16.2.8.4. Recent Developments
- 16.2.8.5. Financials (Based on Availability)
- 16.2.9 Gamma Medica Inc
- 16.2.9.1. Overview
- 16.2.9.2. Products
- 16.2.9.3. SWOT Analysis
- 16.2.9.4. Recent Developments
- 16.2.9.5. Financials (Based on Availability)
- 16.2.10 GE Healthcare (GE Company)
- 16.2.10.1. Overview
- 16.2.10.2. Products
- 16.2.10.3. SWOT Analysis
- 16.2.10.4. Recent Developments
- 16.2.10.5. Financials (Based on Availability)
- 16.2.11 Curium
- 16.2.11.1. Overview
- 16.2.11.2. Products
- 16.2.11.3. SWOT Analysis
- 16.2.11.4. Recent Developments
- 16.2.11.5. Financials (Based on Availability)
- 16.2.12 Digirad Corporation
- 16.2.12.1. Overview
- 16.2.12.2. Products
- 16.2.12.3. SWOT Analysis
- 16.2.12.4. Recent Developments
- 16.2.12.5. Financials (Based on Availability)
- 16.2.1 Bracco Imaging
List of Figures
- Figure 1: Global SPECT Industry Revenue Breakdown (Million, %) by Region 2024 & 2032
- Figure 2: North America SPECT Industry Revenue (Million), by Country 2024 & 2032
- Figure 3: North America SPECT Industry Revenue Share (%), by Country 2024 & 2032
- Figure 4: Europe SPECT Industry Revenue (Million), by Country 2024 & 2032
- Figure 5: Europe SPECT Industry Revenue Share (%), by Country 2024 & 2032
- Figure 6: Asia Pacific SPECT Industry Revenue (Million), by Country 2024 & 2032
- Figure 7: Asia Pacific SPECT Industry Revenue Share (%), by Country 2024 & 2032
- Figure 8: Middle East and Africa SPECT Industry Revenue (Million), by Country 2024 & 2032
- Figure 9: Middle East and Africa SPECT Industry Revenue Share (%), by Country 2024 & 2032
- Figure 10: South America SPECT Industry Revenue (Million), by Country 2024 & 2032
- Figure 11: South America SPECT Industry Revenue Share (%), by Country 2024 & 2032
- Figure 12: North America SPECT Industry Revenue (Million), by Type of Radioisotopes 2024 & 2032
- Figure 13: North America SPECT Industry Revenue Share (%), by Type of Radioisotopes 2024 & 2032
- Figure 14: North America SPECT Industry Revenue (Million), by Application 2024 & 2032
- Figure 15: North America SPECT Industry Revenue Share (%), by Application 2024 & 2032
- Figure 16: North America SPECT Industry Revenue (Million), by Country 2024 & 2032
- Figure 17: North America SPECT Industry Revenue Share (%), by Country 2024 & 2032
- Figure 18: Europe SPECT Industry Revenue (Million), by Type of Radioisotopes 2024 & 2032
- Figure 19: Europe SPECT Industry Revenue Share (%), by Type of Radioisotopes 2024 & 2032
- Figure 20: Europe SPECT Industry Revenue (Million), by Application 2024 & 2032
- Figure 21: Europe SPECT Industry Revenue Share (%), by Application 2024 & 2032
- Figure 22: Europe SPECT Industry Revenue (Million), by Country 2024 & 2032
- Figure 23: Europe SPECT Industry Revenue Share (%), by Country 2024 & 2032
- Figure 24: Asia Pacific SPECT Industry Revenue (Million), by Type of Radioisotopes 2024 & 2032
- Figure 25: Asia Pacific SPECT Industry Revenue Share (%), by Type of Radioisotopes 2024 & 2032
- Figure 26: Asia Pacific SPECT Industry Revenue (Million), by Application 2024 & 2032
- Figure 27: Asia Pacific SPECT Industry Revenue Share (%), by Application 2024 & 2032
- Figure 28: Asia Pacific SPECT Industry Revenue (Million), by Country 2024 & 2032
- Figure 29: Asia Pacific SPECT Industry Revenue Share (%), by Country 2024 & 2032
- Figure 30: Middle East and Africa SPECT Industry Revenue (Million), by Type of Radioisotopes 2024 & 2032
- Figure 31: Middle East and Africa SPECT Industry Revenue Share (%), by Type of Radioisotopes 2024 & 2032
- Figure 32: Middle East and Africa SPECT Industry Revenue (Million), by Application 2024 & 2032
- Figure 33: Middle East and Africa SPECT Industry Revenue Share (%), by Application 2024 & 2032
- Figure 34: Middle East and Africa SPECT Industry Revenue (Million), by Country 2024 & 2032
- Figure 35: Middle East and Africa SPECT Industry Revenue Share (%), by Country 2024 & 2032
- Figure 36: South America SPECT Industry Revenue (Million), by Type of Radioisotopes 2024 & 2032
- Figure 37: South America SPECT Industry Revenue Share (%), by Type of Radioisotopes 2024 & 2032
- Figure 38: South America SPECT Industry Revenue (Million), by Application 2024 & 2032
- Figure 39: South America SPECT Industry Revenue Share (%), by Application 2024 & 2032
- Figure 40: South America SPECT Industry Revenue (Million), by Country 2024 & 2032
- Figure 41: South America SPECT Industry Revenue Share (%), by Country 2024 & 2032
List of Tables
- Table 1: Global SPECT Industry Revenue Million Forecast, by Region 2019 & 2032
- Table 2: Global SPECT Industry Revenue Million Forecast, by Type of Radioisotopes 2019 & 2032
- Table 3: Global SPECT Industry Revenue Million Forecast, by Application 2019 & 2032
- Table 4: Global SPECT Industry Revenue Million Forecast, by Region 2019 & 2032
- Table 5: Global SPECT Industry Revenue Million Forecast, by Country 2019 & 2032
- Table 6: United States SPECT Industry Revenue (Million) Forecast, by Application 2019 & 2032
- Table 7: Canada SPECT Industry Revenue (Million) Forecast, by Application 2019 & 2032
- Table 8: Mexico SPECT Industry Revenue (Million) Forecast, by Application 2019 & 2032
- Table 9: Global SPECT Industry Revenue Million Forecast, by Country 2019 & 2032
- Table 10: Germany SPECT Industry Revenue (Million) Forecast, by Application 2019 & 2032
- Table 11: United Kingdom SPECT Industry Revenue (Million) Forecast, by Application 2019 & 2032
- Table 12: France SPECT Industry Revenue (Million) Forecast, by Application 2019 & 2032
- Table 13: Italy SPECT Industry Revenue (Million) Forecast, by Application 2019 & 2032
- Table 14: Spain SPECT Industry Revenue (Million) Forecast, by Application 2019 & 2032
- Table 15: Rest of Europe SPECT Industry Revenue (Million) Forecast, by Application 2019 & 2032
- Table 16: Global SPECT Industry Revenue Million Forecast, by Country 2019 & 2032
- Table 17: China SPECT Industry Revenue (Million) Forecast, by Application 2019 & 2032
- Table 18: Japan SPECT Industry Revenue (Million) Forecast, by Application 2019 & 2032
- Table 19: India SPECT Industry Revenue (Million) Forecast, by Application 2019 & 2032
- Table 20: Australia SPECT Industry Revenue (Million) Forecast, by Application 2019 & 2032
- Table 21: South Korea SPECT Industry Revenue (Million) Forecast, by Application 2019 & 2032
- Table 22: Rest of Asia Pacific SPECT Industry Revenue (Million) Forecast, by Application 2019 & 2032
- Table 23: Global SPECT Industry Revenue Million Forecast, by Country 2019 & 2032
- Table 24: GCC SPECT Industry Revenue (Million) Forecast, by Application 2019 & 2032
- Table 25: South Africa SPECT Industry Revenue (Million) Forecast, by Application 2019 & 2032
- Table 26: Rest of Middle East and Africa SPECT Industry Revenue (Million) Forecast, by Application 2019 & 2032
- Table 27: Global SPECT Industry Revenue Million Forecast, by Country 2019 & 2032
- Table 28: Brazil SPECT Industry Revenue (Million) Forecast, by Application 2019 & 2032
- Table 29: Argentina SPECT Industry Revenue (Million) Forecast, by Application 2019 & 2032
- Table 30: Rest of South America SPECT Industry Revenue (Million) Forecast, by Application 2019 & 2032
- Table 31: Global SPECT Industry Revenue Million Forecast, by Type of Radioisotopes 2019 & 2032
- Table 32: Global SPECT Industry Revenue Million Forecast, by Application 2019 & 2032
- Table 33: Global SPECT Industry Revenue Million Forecast, by Country 2019 & 2032
- Table 34: United States SPECT Industry Revenue (Million) Forecast, by Application 2019 & 2032
- Table 35: Canada SPECT Industry Revenue (Million) Forecast, by Application 2019 & 2032
- Table 36: Mexico SPECT Industry Revenue (Million) Forecast, by Application 2019 & 2032
- Table 37: Global SPECT Industry Revenue Million Forecast, by Type of Radioisotopes 2019 & 2032
- Table 38: Global SPECT Industry Revenue Million Forecast, by Application 2019 & 2032
- Table 39: Global SPECT Industry Revenue Million Forecast, by Country 2019 & 2032
- Table 40: Germany SPECT Industry Revenue (Million) Forecast, by Application 2019 & 2032
- Table 41: United Kingdom SPECT Industry Revenue (Million) Forecast, by Application 2019 & 2032
- Table 42: France SPECT Industry Revenue (Million) Forecast, by Application 2019 & 2032
- Table 43: Italy SPECT Industry Revenue (Million) Forecast, by Application 2019 & 2032
- Table 44: Spain SPECT Industry Revenue (Million) Forecast, by Application 2019 & 2032
- Table 45: Rest of Europe SPECT Industry Revenue (Million) Forecast, by Application 2019 & 2032
- Table 46: Global SPECT Industry Revenue Million Forecast, by Type of Radioisotopes 2019 & 2032
- Table 47: Global SPECT Industry Revenue Million Forecast, by Application 2019 & 2032
- Table 48: Global SPECT Industry Revenue Million Forecast, by Country 2019 & 2032
- Table 49: China SPECT Industry Revenue (Million) Forecast, by Application 2019 & 2032
- Table 50: Japan SPECT Industry Revenue (Million) Forecast, by Application 2019 & 2032
- Table 51: India SPECT Industry Revenue (Million) Forecast, by Application 2019 & 2032
- Table 52: Australia SPECT Industry Revenue (Million) Forecast, by Application 2019 & 2032
- Table 53: South Korea SPECT Industry Revenue (Million) Forecast, by Application 2019 & 2032
- Table 54: Rest of Asia Pacific SPECT Industry Revenue (Million) Forecast, by Application 2019 & 2032
- Table 55: Global SPECT Industry Revenue Million Forecast, by Type of Radioisotopes 2019 & 2032
- Table 56: Global SPECT Industry Revenue Million Forecast, by Application 2019 & 2032
- Table 57: Global SPECT Industry Revenue Million Forecast, by Country 2019 & 2032
- Table 58: GCC SPECT Industry Revenue (Million) Forecast, by Application 2019 & 2032
- Table 59: South Africa SPECT Industry Revenue (Million) Forecast, by Application 2019 & 2032
- Table 60: Rest of Middle East and Africa SPECT Industry Revenue (Million) Forecast, by Application 2019 & 2032
- Table 61: Global SPECT Industry Revenue Million Forecast, by Type of Radioisotopes 2019 & 2032
- Table 62: Global SPECT Industry Revenue Million Forecast, by Application 2019 & 2032
- Table 63: Global SPECT Industry Revenue Million Forecast, by Country 2019 & 2032
- Table 64: Brazil SPECT Industry Revenue (Million) Forecast, by Application 2019 & 2032
- Table 65: Argentina SPECT Industry Revenue (Million) Forecast, by Application 2019 & 2032
- Table 66: Rest of South America SPECT Industry Revenue (Million) Forecast, by Application 2019 & 2032
Frequently Asked Questions
1. What is the projected Compound Annual Growth Rate (CAGR) of the SPECT Industry?
The projected CAGR is approximately 3.20%.
2. Which companies are prominent players in the SPECT Industry?
Key companies in the market include Bracco Imaging, Global Medical Solutions, Neusoft Corporation*List Not Exhaustive, Cardinal Health Inc, Spectrum Dynamics Medical, Guerbet, NTP Radioisotopes SOC Ltd, Lantheus Medical Imaging Inc, Gamma Medica Inc, GE Healthcare (GE Company), Curium, Digirad Corporation.
3. What are the main segments of the SPECT Industry?
The market segments include Type of Radioisotopes, Application.
4. Can you provide details about the market size?
The market size is estimated to be USD 2.23 Million as of 2022.
5. What are some drivers contributing to market growth?
Increasing Demand for SPECT Analysis in Radiopharmaceuticals; Growing Geriatric Population; Improvements in SPECT Imaging Technology.
6. What are the notable trends driving market growth?
The Gallium-67 Segment is Expected to Witness a Large CAGR Over the Forecast Period in the Single Photon Emission Computed Tomography (SPECT) Market.
7. Are there any restraints impacting market growth?
Shorter Half-life of Radioisotopes; Stringent Regulatory Guidelines.
8. Can you provide examples of recent developments in the market?
N/A
9. What pricing options are available for accessing the report?
Pricing options include single-user, multi-user, and enterprise licenses priced at USD 4750, USD 5250, and USD 8750 respectively.
10. Is the market size provided in terms of value or volume?
The market size is provided in terms of value, measured in Million.
11. Are there any specific market keywords associated with the report?
Yes, the market keyword associated with the report is "SPECT Industry," which aids in identifying and referencing the specific market segment covered.
12. How do I determine which pricing option suits my needs best?
The pricing options vary based on user requirements and access needs. Individual users may opt for single-user licenses, while businesses requiring broader access may choose multi-user or enterprise licenses for cost-effective access to the report.
13. Are there any additional resources or data provided in the SPECT Industry report?
While the report offers comprehensive insights, it's advisable to review the specific contents or supplementary materials provided to ascertain if additional resources or data are available.
14. How can I stay updated on further developments or reports in the SPECT Industry?
To stay informed about further developments, trends, and reports in the SPECT Industry, consider subscribing to industry newsletters, following relevant companies and organizations, or regularly checking reputable industry news sources and publications.
Methodology
Step 1 - Identification of Relevant Samples Size from Population Database


Step 2 - Approaches for Defining Global Market Size (Value, Volume* & Price*)

Note*: In applicable scenarios
Step 3 - Data Sources
Primary Research
- Web Analytics
- Survey Reports
- Research Institute
- Latest Research Reports
- Opinion Leaders
Secondary Research
- Annual Reports
- White Paper
- Latest Press Release
- Industry Association
- Paid Database
- Investor Presentations

Step 4 - Data Triangulation
Involves using different sources of information in order to increase the validity of a study
These sources are likely to be stakeholders in a program - participants, other researchers, program staff, other community members, and so on.
Then we put all data in single framework & apply various statistical tools to find out the dynamic on the market.
During the analysis stage, feedback from the stakeholder groups would be compared to determine areas of agreement as well as areas of divergence


