
Key Insights
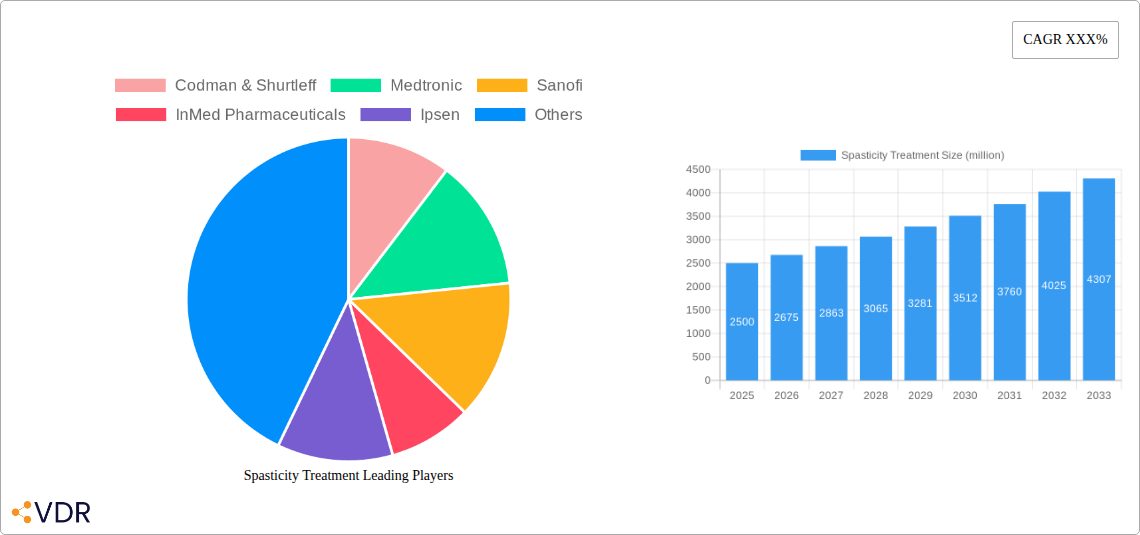
The global spasticity treatment market is experiencing robust growth, driven by an aging population, increasing prevalence of neurological disorders like cerebral palsy and multiple sclerosis, and advancements in treatment modalities. The market size in 2025 is estimated at $2.5 billion, projecting a Compound Annual Growth Rate (CAGR) of 7% from 2025 to 2033. This growth is fueled by the rising adoption of botulinum toxin injections, baclofen pumps, and oral medications, as well as increased awareness and improved diagnosis of spasticity. Significant research and development efforts are focused on developing novel therapies, including non-invasive techniques and targeted drug delivery systems, further contributing to market expansion. However, the high cost of advanced treatments, the potential for adverse effects associated with certain therapies, and regional disparities in access to healthcare represent key restraints to market growth.
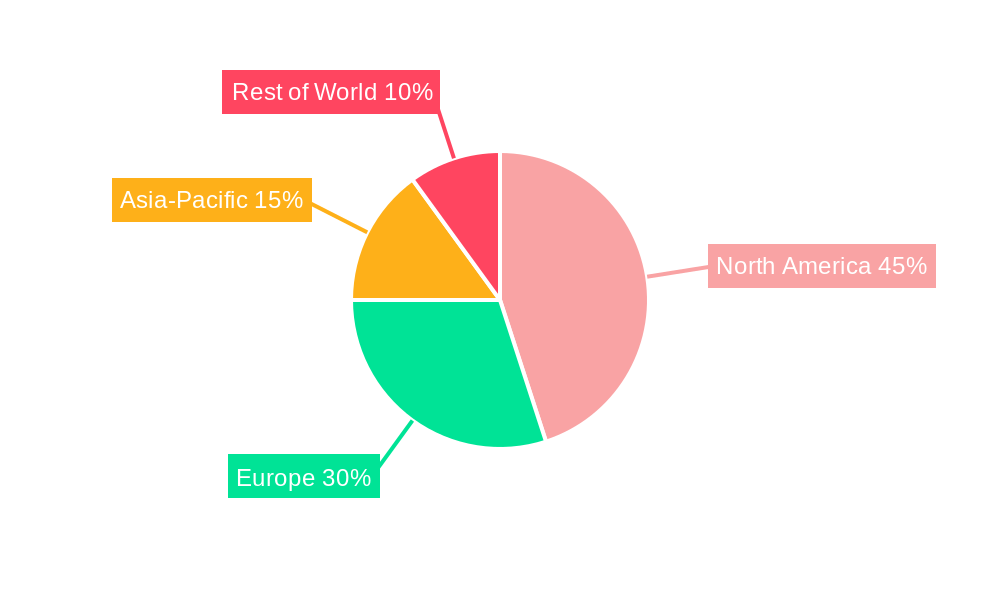
The market is segmented by treatment type (pharmaceuticals, surgical interventions, and physical therapy), by disease indication (cerebral palsy, stroke, multiple sclerosis, spinal cord injury), and geographically across major regions. Key players such as Codman & Shurtleff, Medtronic, Sanofi, InMed Pharmaceuticals, Ipsen, Orient Pharma, Taj Pharmaceuticals, MediciNova, and Genentech are engaged in intense competition, focusing on product innovation, expansion into emerging markets, and strategic partnerships to enhance their market share. The North American market currently holds the largest share, driven by high healthcare expenditure and robust adoption of advanced therapies. However, the Asia-Pacific region is poised for significant growth due to rising prevalence of neurological disorders and increased healthcare investments. The forecast period of 2025-2033 anticipates continued growth, propelled by innovative treatment approaches and expanding access to healthcare in developing economies.
Spasticity Treatment Market Report: 2019-2033
This comprehensive report provides an in-depth analysis of the global spasticity treatment market, offering valuable insights for industry professionals, investors, and strategic decision-makers. The report covers the period 2019-2033, with a focus on the forecast period 2025-2033 (base year 2025, estimated year 2025). The market is segmented by drug class, route of administration, and end-user. The report also analyzes key players and emerging trends shaping the future of spasticity treatment. The global market size in 2025 is estimated at $XX billion.
Spasticity Treatment Market Dynamics & Structure
The spasticity treatment market is characterized by moderate concentration, with a few major players holding significant market share. However, the market is also witnessing increased competition from emerging companies developing innovative therapies. Technological innovation, driven by advancements in drug delivery systems and biologics, is a key driver. Regulatory frameworks, including stringent approval processes, impact market entry and growth. Competitive product substitutes, such as physical therapy and surgical interventions, also influence market dynamics. The end-user demographics are diverse, encompassing patients with various neurological conditions across different age groups. M&A activity has been moderate in recent years, with a focus on strategic partnerships and collaborations to expand product portfolios and market access.
- Market Concentration: Moderately concentrated, with top 5 players holding approximately XX% market share in 2025.
- Technological Innovation: Significant advancements in botulinum toxin formulations, baclofen pumps, and other novel therapies.
- Regulatory Framework: Stringent regulatory approvals impacting time-to-market and market access.
- Competitive Substitutes: Physical therapy, surgical interventions, and other non-pharmacological treatments.
- End-User Demographics: Patients with cerebral palsy, multiple sclerosis, stroke, and spinal cord injury across diverse age groups.
- M&A Activity: XX major deals in the past 5 years, primarily focused on strategic alliances and licensing agreements.
Spasticity Treatment Growth Trends & Insights
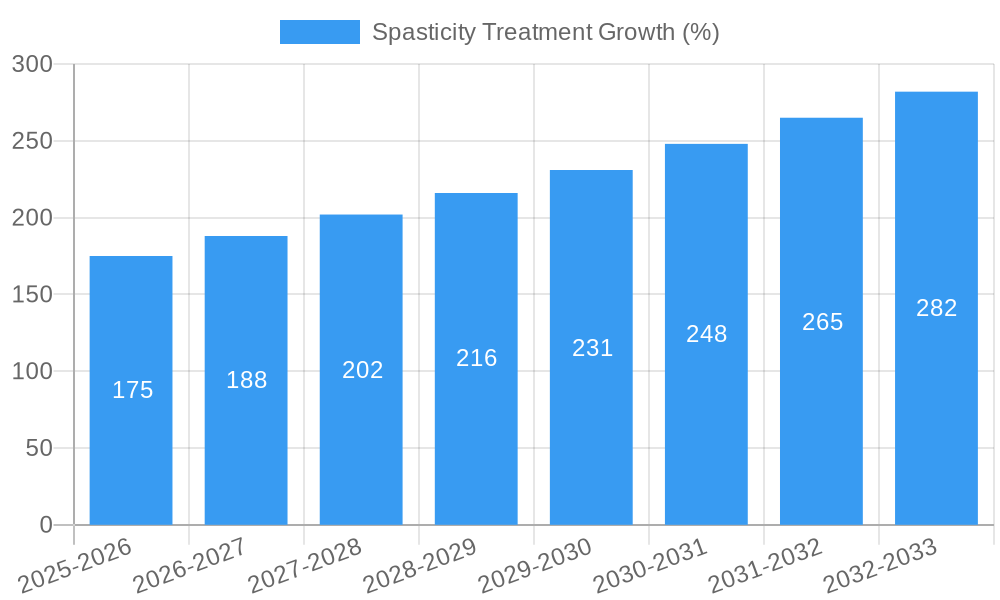
The spasticity treatment market experienced significant growth during the historical period (2019-2024), driven by increasing prevalence of neurological disorders, rising healthcare expenditure, and growing awareness about treatment options. The market is projected to maintain a healthy CAGR of XX% during the forecast period (2025-2033). This growth is fueled by technological advancements leading to the development of more effective and targeted therapies, along with a shift towards minimally invasive procedures. Furthermore, increasing adoption of advanced diagnostic tools for early detection and improved patient outcomes contribute to market expansion. Consumer behavior is shifting towards preference for non-invasive treatments and personalized medicine approaches.
- Market Size (2025): $XX billion
- CAGR (2025-2033): XX%
- Market Penetration (2025): XX% of target patient population
- Technological Disruption: Advancements in drug delivery systems and personalized medicine.
- Consumer Behavior Shifts: Growing preference for minimally invasive and convenient treatments.
Dominant Regions, Countries, or Segments in Spasticity Treatment
North America holds the largest market share in spasticity treatment, driven by high healthcare expenditure, advanced healthcare infrastructure, and a large patient pool. Europe follows as the second-largest market, showcasing robust growth due to rising prevalence of neurological disorders and increasing awareness among healthcare professionals. Asia-Pacific is expected to witness substantial growth, fueled by rising disposable incomes, growing healthcare infrastructure, and increasing government initiatives.
- North America: High healthcare expenditure, advanced healthcare infrastructure, and large patient population.
- Europe: High prevalence of neurological disorders, robust healthcare systems, and increased awareness.
- Asia-Pacific: Rising disposable incomes, developing healthcare infrastructure, and government support.
- Market Share (2025): North America (XX%), Europe (XX%), Asia-Pacific (XX%).
- Growth Potential (2025-2033): Asia-Pacific (highest growth potential).
Spasticity Treatment Product Landscape
The spasticity treatment market encompasses a wide range of products, including botulinum toxin injections (e.g., Botox, Dysport), oral medications (e.g., baclofen, tizanidine), and intrathecal baclofen pumps. These products differ in their mechanism of action, administration routes, and efficacy profiles. Recent innovations focus on improving drug delivery systems, enhancing efficacy, and minimizing side effects. Technological advancements include development of targeted drug delivery systems, personalized medicine approaches, and novel drug candidates.
Key Drivers, Barriers & Challenges in Spasticity Treatment
Key Drivers:
- Increasing prevalence of neurological disorders.
- Rising healthcare expenditure and insurance coverage.
- Technological advancements in drug delivery and therapies.
Challenges:
- High cost of treatment limiting accessibility.
- Side effects associated with certain medications.
- Stringent regulatory approvals delaying market entry.
- Supply chain disruptions impacting product availability.
Emerging Opportunities in Spasticity Treatment
- Development of novel therapies targeting specific spasticity mechanisms.
- Expansion into untapped markets in developing countries.
- Personalized medicine approaches tailoring treatments to individual patient needs.
- Growth of minimally invasive procedures and telehealth solutions.
Growth Accelerators in the Spasticity Treatment Industry
Long-term growth in the spasticity treatment market will be propelled by continuous technological advancements, strategic collaborations between pharmaceutical companies and technology providers, and expansion into emerging markets. Furthermore, government initiatives supporting healthcare access and research and development will accelerate market growth.
Key Players Shaping the Spasticity Treatment Market
- Medtronic
- Sanofi
- Ipsen
- InMed Pharmaceuticals
- Orient Pharma
- Taj Pharmaceuticals
- MediciNova
- Genentech
- Codman & Shurtleff
Notable Milestones in Spasticity Treatment Sector
- 2020: FDA approval of a novel spasticity treatment.
- 2022: Launch of a new drug delivery system for baclofen.
- 2023: Strategic partnership between two major players for joint development.
- 2024: Publication of key clinical trial results demonstrating efficacy of a new treatment.
In-Depth Spasticity Treatment Market Outlook
The spasticity treatment market is poised for continued growth driven by the factors discussed above. The market presents significant opportunities for companies to innovate, develop new therapies, and expand their market presence. Strategic partnerships, mergers, and acquisitions are expected to reshape the market landscape. Focus on personalized medicine, improved drug delivery systems, and expansion into untapped markets will be key for long-term success.
Spasticity Treatment Segmentation
-
1. Application
- 1.1. Children
- 1.2. Adults
-
2. Type
- 2.1. Physical Treatment
- 2.2. Medicine Treatment
Spasticity Treatment Segmentation By Geography
-
1. North America
- 1.1. United States
- 1.2. Canada
- 1.3. Mexico
-
2. South America
- 2.1. Brazil
- 2.2. Argentina
- 2.3. Rest of South America
-
3. Europe
- 3.1. United Kingdom
- 3.2. Germany
- 3.3. France
- 3.4. Italy
- 3.5. Spain
- 3.6. Russia
- 3.7. Benelux
- 3.8. Nordics
- 3.9. Rest of Europe
-
4. Middle East & Africa
- 4.1. Turkey
- 4.2. Israel
- 4.3. GCC
- 4.4. North Africa
- 4.5. South Africa
- 4.6. Rest of Middle East & Africa
-
5. Asia Pacific
- 5.1. China
- 5.2. India
- 5.3. Japan
- 5.4. South Korea
- 5.5. ASEAN
- 5.6. Oceania
- 5.7. Rest of Asia Pacific
Spasticity Treatment REPORT HIGHLIGHTS
| Aspects | Details |
|---|---|
| Study Period | 2019-2033 |
| Base Year | 2024 |
| Estimated Year | 2025 |
| Forecast Period | 2025-2033 |
| Historical Period | 2019-2024 |
| Growth Rate | CAGR of XXX% from 2019-2033 |
| Segmentation |
|
Table of Contents
- 1. Introduction
- 1.1. Research Scope
- 1.2. Market Segmentation
- 1.3. Research Methodology
- 1.4. Definitions and Assumptions
- 2. Executive Summary
- 2.1. Introduction
- 3. Market Dynamics
- 3.1. Introduction
- 3.2. Market Drivers
- 3.3. Market Restrains
- 3.4. Market Trends
- 4. Market Factor Analysis
- 4.1. Porters Five Forces
- 4.2. Supply/Value Chain
- 4.3. PESTEL analysis
- 4.4. Market Entropy
- 4.5. Patent/Trademark Analysis
- 5. Global Spasticity Treatment Analysis, Insights and Forecast, 2019-2031
- 5.1. Market Analysis, Insights and Forecast - by Application
- 5.1.1. Children
- 5.1.2. Adults
- 5.2. Market Analysis, Insights and Forecast - by Type
- 5.2.1. Physical Treatment
- 5.2.2. Medicine Treatment
- 5.3. Market Analysis, Insights and Forecast - by Region
- 5.3.1. North America
- 5.3.2. South America
- 5.3.3. Europe
- 5.3.4. Middle East & Africa
- 5.3.5. Asia Pacific
- 5.1. Market Analysis, Insights and Forecast - by Application
- 6. North America Spasticity Treatment Analysis, Insights and Forecast, 2019-2031
- 6.1. Market Analysis, Insights and Forecast - by Application
- 6.1.1. Children
- 6.1.2. Adults
- 6.2. Market Analysis, Insights and Forecast - by Type
- 6.2.1. Physical Treatment
- 6.2.2. Medicine Treatment
- 6.1. Market Analysis, Insights and Forecast - by Application
- 7. South America Spasticity Treatment Analysis, Insights and Forecast, 2019-2031
- 7.1. Market Analysis, Insights and Forecast - by Application
- 7.1.1. Children
- 7.1.2. Adults
- 7.2. Market Analysis, Insights and Forecast - by Type
- 7.2.1. Physical Treatment
- 7.2.2. Medicine Treatment
- 7.1. Market Analysis, Insights and Forecast - by Application
- 8. Europe Spasticity Treatment Analysis, Insights and Forecast, 2019-2031
- 8.1. Market Analysis, Insights and Forecast - by Application
- 8.1.1. Children
- 8.1.2. Adults
- 8.2. Market Analysis, Insights and Forecast - by Type
- 8.2.1. Physical Treatment
- 8.2.2. Medicine Treatment
- 8.1. Market Analysis, Insights and Forecast - by Application
- 9. Middle East & Africa Spasticity Treatment Analysis, Insights and Forecast, 2019-2031
- 9.1. Market Analysis, Insights and Forecast - by Application
- 9.1.1. Children
- 9.1.2. Adults
- 9.2. Market Analysis, Insights and Forecast - by Type
- 9.2.1. Physical Treatment
- 9.2.2. Medicine Treatment
- 9.1. Market Analysis, Insights and Forecast - by Application
- 10. Asia Pacific Spasticity Treatment Analysis, Insights and Forecast, 2019-2031
- 10.1. Market Analysis, Insights and Forecast - by Application
- 10.1.1. Children
- 10.1.2. Adults
- 10.2. Market Analysis, Insights and Forecast - by Type
- 10.2.1. Physical Treatment
- 10.2.2. Medicine Treatment
- 10.1. Market Analysis, Insights and Forecast - by Application
- 11. Competitive Analysis
- 11.1. Global Market Share Analysis 2024
- 11.2. Company Profiles
- 11.2.1 Codman & Shurtleff
- 11.2.1.1. Overview
- 11.2.1.2. Products
- 11.2.1.3. SWOT Analysis
- 11.2.1.4. Recent Developments
- 11.2.1.5. Financials (Based on Availability)
- 11.2.2 Medtronic
- 11.2.2.1. Overview
- 11.2.2.2. Products
- 11.2.2.3. SWOT Analysis
- 11.2.2.4. Recent Developments
- 11.2.2.5. Financials (Based on Availability)
- 11.2.3 Sanofi
- 11.2.3.1. Overview
- 11.2.3.2. Products
- 11.2.3.3. SWOT Analysis
- 11.2.3.4. Recent Developments
- 11.2.3.5. Financials (Based on Availability)
- 11.2.4 InMed Pharmaceuticals
- 11.2.4.1. Overview
- 11.2.4.2. Products
- 11.2.4.3. SWOT Analysis
- 11.2.4.4. Recent Developments
- 11.2.4.5. Financials (Based on Availability)
- 11.2.5 Ipsen
- 11.2.5.1. Overview
- 11.2.5.2. Products
- 11.2.5.3. SWOT Analysis
- 11.2.5.4. Recent Developments
- 11.2.5.5. Financials (Based on Availability)
- 11.2.6 Orient Pharma
- 11.2.6.1. Overview
- 11.2.6.2. Products
- 11.2.6.3. SWOT Analysis
- 11.2.6.4. Recent Developments
- 11.2.6.5. Financials (Based on Availability)
- 11.2.7 Taj Pharmaceuticals
- 11.2.7.1. Overview
- 11.2.7.2. Products
- 11.2.7.3. SWOT Analysis
- 11.2.7.4. Recent Developments
- 11.2.7.5. Financials (Based on Availability)
- 11.2.8 MediciNova
- 11.2.8.1. Overview
- 11.2.8.2. Products
- 11.2.8.3. SWOT Analysis
- 11.2.8.4. Recent Developments
- 11.2.8.5. Financials (Based on Availability)
- 11.2.9 Genentech
- 11.2.9.1. Overview
- 11.2.9.2. Products
- 11.2.9.3. SWOT Analysis
- 11.2.9.4. Recent Developments
- 11.2.9.5. Financials (Based on Availability)
- 11.2.1 Codman & Shurtleff
List of Figures
- Figure 1: Global Spasticity Treatment Revenue Breakdown (million, %) by Region 2024 & 2032
- Figure 2: North America Spasticity Treatment Revenue (million), by Application 2024 & 2032
- Figure 3: North America Spasticity Treatment Revenue Share (%), by Application 2024 & 2032
- Figure 4: North America Spasticity Treatment Revenue (million), by Type 2024 & 2032
- Figure 5: North America Spasticity Treatment Revenue Share (%), by Type 2024 & 2032
- Figure 6: North America Spasticity Treatment Revenue (million), by Country 2024 & 2032
- Figure 7: North America Spasticity Treatment Revenue Share (%), by Country 2024 & 2032
- Figure 8: South America Spasticity Treatment Revenue (million), by Application 2024 & 2032
- Figure 9: South America Spasticity Treatment Revenue Share (%), by Application 2024 & 2032
- Figure 10: South America Spasticity Treatment Revenue (million), by Type 2024 & 2032
- Figure 11: South America Spasticity Treatment Revenue Share (%), by Type 2024 & 2032
- Figure 12: South America Spasticity Treatment Revenue (million), by Country 2024 & 2032
- Figure 13: South America Spasticity Treatment Revenue Share (%), by Country 2024 & 2032
- Figure 14: Europe Spasticity Treatment Revenue (million), by Application 2024 & 2032
- Figure 15: Europe Spasticity Treatment Revenue Share (%), by Application 2024 & 2032
- Figure 16: Europe Spasticity Treatment Revenue (million), by Type 2024 & 2032
- Figure 17: Europe Spasticity Treatment Revenue Share (%), by Type 2024 & 2032
- Figure 18: Europe Spasticity Treatment Revenue (million), by Country 2024 & 2032
- Figure 19: Europe Spasticity Treatment Revenue Share (%), by Country 2024 & 2032
- Figure 20: Middle East & Africa Spasticity Treatment Revenue (million), by Application 2024 & 2032
- Figure 21: Middle East & Africa Spasticity Treatment Revenue Share (%), by Application 2024 & 2032
- Figure 22: Middle East & Africa Spasticity Treatment Revenue (million), by Type 2024 & 2032
- Figure 23: Middle East & Africa Spasticity Treatment Revenue Share (%), by Type 2024 & 2032
- Figure 24: Middle East & Africa Spasticity Treatment Revenue (million), by Country 2024 & 2032
- Figure 25: Middle East & Africa Spasticity Treatment Revenue Share (%), by Country 2024 & 2032
- Figure 26: Asia Pacific Spasticity Treatment Revenue (million), by Application 2024 & 2032
- Figure 27: Asia Pacific Spasticity Treatment Revenue Share (%), by Application 2024 & 2032
- Figure 28: Asia Pacific Spasticity Treatment Revenue (million), by Type 2024 & 2032
- Figure 29: Asia Pacific Spasticity Treatment Revenue Share (%), by Type 2024 & 2032
- Figure 30: Asia Pacific Spasticity Treatment Revenue (million), by Country 2024 & 2032
- Figure 31: Asia Pacific Spasticity Treatment Revenue Share (%), by Country 2024 & 2032
List of Tables
- Table 1: Global Spasticity Treatment Revenue million Forecast, by Region 2019 & 2032
- Table 2: Global Spasticity Treatment Revenue million Forecast, by Application 2019 & 2032
- Table 3: Global Spasticity Treatment Revenue million Forecast, by Type 2019 & 2032
- Table 4: Global Spasticity Treatment Revenue million Forecast, by Region 2019 & 2032
- Table 5: Global Spasticity Treatment Revenue million Forecast, by Application 2019 & 2032
- Table 6: Global Spasticity Treatment Revenue million Forecast, by Type 2019 & 2032
- Table 7: Global Spasticity Treatment Revenue million Forecast, by Country 2019 & 2032
- Table 8: United States Spasticity Treatment Revenue (million) Forecast, by Application 2019 & 2032
- Table 9: Canada Spasticity Treatment Revenue (million) Forecast, by Application 2019 & 2032
- Table 10: Mexico Spasticity Treatment Revenue (million) Forecast, by Application 2019 & 2032
- Table 11: Global Spasticity Treatment Revenue million Forecast, by Application 2019 & 2032
- Table 12: Global Spasticity Treatment Revenue million Forecast, by Type 2019 & 2032
- Table 13: Global Spasticity Treatment Revenue million Forecast, by Country 2019 & 2032
- Table 14: Brazil Spasticity Treatment Revenue (million) Forecast, by Application 2019 & 2032
- Table 15: Argentina Spasticity Treatment Revenue (million) Forecast, by Application 2019 & 2032
- Table 16: Rest of South America Spasticity Treatment Revenue (million) Forecast, by Application 2019 & 2032
- Table 17: Global Spasticity Treatment Revenue million Forecast, by Application 2019 & 2032
- Table 18: Global Spasticity Treatment Revenue million Forecast, by Type 2019 & 2032
- Table 19: Global Spasticity Treatment Revenue million Forecast, by Country 2019 & 2032
- Table 20: United Kingdom Spasticity Treatment Revenue (million) Forecast, by Application 2019 & 2032
- Table 21: Germany Spasticity Treatment Revenue (million) Forecast, by Application 2019 & 2032
- Table 22: France Spasticity Treatment Revenue (million) Forecast, by Application 2019 & 2032
- Table 23: Italy Spasticity Treatment Revenue (million) Forecast, by Application 2019 & 2032
- Table 24: Spain Spasticity Treatment Revenue (million) Forecast, by Application 2019 & 2032
- Table 25: Russia Spasticity Treatment Revenue (million) Forecast, by Application 2019 & 2032
- Table 26: Benelux Spasticity Treatment Revenue (million) Forecast, by Application 2019 & 2032
- Table 27: Nordics Spasticity Treatment Revenue (million) Forecast, by Application 2019 & 2032
- Table 28: Rest of Europe Spasticity Treatment Revenue (million) Forecast, by Application 2019 & 2032
- Table 29: Global Spasticity Treatment Revenue million Forecast, by Application 2019 & 2032
- Table 30: Global Spasticity Treatment Revenue million Forecast, by Type 2019 & 2032
- Table 31: Global Spasticity Treatment Revenue million Forecast, by Country 2019 & 2032
- Table 32: Turkey Spasticity Treatment Revenue (million) Forecast, by Application 2019 & 2032
- Table 33: Israel Spasticity Treatment Revenue (million) Forecast, by Application 2019 & 2032
- Table 34: GCC Spasticity Treatment Revenue (million) Forecast, by Application 2019 & 2032
- Table 35: North Africa Spasticity Treatment Revenue (million) Forecast, by Application 2019 & 2032
- Table 36: South Africa Spasticity Treatment Revenue (million) Forecast, by Application 2019 & 2032
- Table 37: Rest of Middle East & Africa Spasticity Treatment Revenue (million) Forecast, by Application 2019 & 2032
- Table 38: Global Spasticity Treatment Revenue million Forecast, by Application 2019 & 2032
- Table 39: Global Spasticity Treatment Revenue million Forecast, by Type 2019 & 2032
- Table 40: Global Spasticity Treatment Revenue million Forecast, by Country 2019 & 2032
- Table 41: China Spasticity Treatment Revenue (million) Forecast, by Application 2019 & 2032
- Table 42: India Spasticity Treatment Revenue (million) Forecast, by Application 2019 & 2032
- Table 43: Japan Spasticity Treatment Revenue (million) Forecast, by Application 2019 & 2032
- Table 44: South Korea Spasticity Treatment Revenue (million) Forecast, by Application 2019 & 2032
- Table 45: ASEAN Spasticity Treatment Revenue (million) Forecast, by Application 2019 & 2032
- Table 46: Oceania Spasticity Treatment Revenue (million) Forecast, by Application 2019 & 2032
- Table 47: Rest of Asia Pacific Spasticity Treatment Revenue (million) Forecast, by Application 2019 & 2032
Frequently Asked Questions
1. What is the projected Compound Annual Growth Rate (CAGR) of the Spasticity Treatment?
The projected CAGR is approximately XXX%.
2. Which companies are prominent players in the Spasticity Treatment?
Key companies in the market include Codman & Shurtleff, Medtronic, Sanofi, InMed Pharmaceuticals, Ipsen, Orient Pharma, Taj Pharmaceuticals, MediciNova, Genentech.
3. What are the main segments of the Spasticity Treatment?
The market segments include Application, Type.
4. Can you provide details about the market size?
The market size is estimated to be USD XXX million as of 2022.
5. What are some drivers contributing to market growth?
N/A
6. What are the notable trends driving market growth?
N/A
7. Are there any restraints impacting market growth?
N/A
8. Can you provide examples of recent developments in the market?
N/A
9. What pricing options are available for accessing the report?
Pricing options include single-user, multi-user, and enterprise licenses priced at USD 3950.00, USD 5925.00, and USD 7900.00 respectively.
10. Is the market size provided in terms of value or volume?
The market size is provided in terms of value, measured in million.
11. Are there any specific market keywords associated with the report?
Yes, the market keyword associated with the report is "Spasticity Treatment," which aids in identifying and referencing the specific market segment covered.
12. How do I determine which pricing option suits my needs best?
The pricing options vary based on user requirements and access needs. Individual users may opt for single-user licenses, while businesses requiring broader access may choose multi-user or enterprise licenses for cost-effective access to the report.
13. Are there any additional resources or data provided in the Spasticity Treatment report?
While the report offers comprehensive insights, it's advisable to review the specific contents or supplementary materials provided to ascertain if additional resources or data are available.
14. How can I stay updated on further developments or reports in the Spasticity Treatment?
To stay informed about further developments, trends, and reports in the Spasticity Treatment, consider subscribing to industry newsletters, following relevant companies and organizations, or regularly checking reputable industry news sources and publications.
Methodology
Step 1 - Identification of Relevant Samples Size from Population Database


Step 2 - Approaches for Defining Global Market Size (Value, Volume* & Price*)

Note*: In applicable scenarios
Step 3 - Data Sources
Primary Research
- Web Analytics
- Survey Reports
- Research Institute
- Latest Research Reports
- Opinion Leaders
Secondary Research
- Annual Reports
- White Paper
- Latest Press Release
- Industry Association
- Paid Database
- Investor Presentations

Step 4 - Data Triangulation
Involves using different sources of information in order to increase the validity of a study
These sources are likely to be stakeholders in a program - participants, other researchers, program staff, other community members, and so on.
Then we put all data in single framework & apply various statistical tools to find out the dynamic on the market.
During the analysis stage, feedback from the stakeholder groups would be compared to determine areas of agreement as well as areas of divergence


