
Key Insights
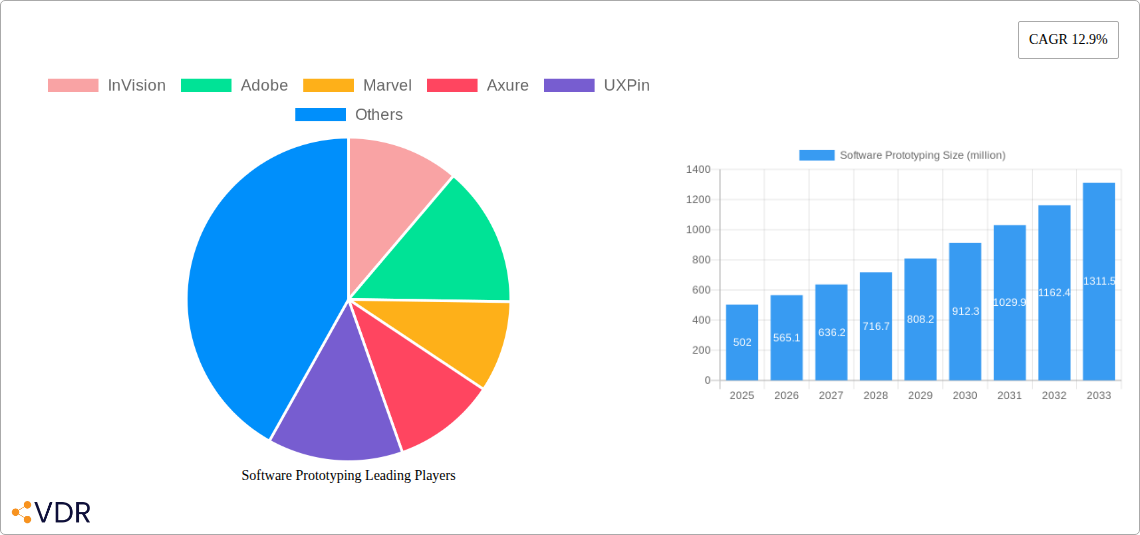
The software prototyping market, currently valued at $502 million in 2025, is experiencing robust growth, projected to expand significantly over the next decade. A compound annual growth rate (CAGR) of 12.9% indicates a substantial market expansion, driven primarily by the increasing demand for agile development methodologies, the rising adoption of DevOps practices, and the growing need for user-centric design across various industries. Businesses are increasingly relying on prototyping tools to validate design concepts early in the development lifecycle, reducing development costs and risks associated with launching products that don't meet user needs. This trend is further accelerated by the proliferation of digital products and services, requiring efficient and effective ways to design and test user interfaces. The market is segmented by various prototyping tools (including InVision, Adobe XD, Marvel, Axure, UXPin, and others), each catering to different needs and user preferences. Competition among providers is driving innovation, leading to the development of more advanced features such as real-time collaboration, AI-powered design assistance, and integration with other development tools. Geographical distribution shows varied adoption rates, with North America and Europe likely representing the largest markets due to higher levels of technological adoption and a mature software development ecosystem.
The projected growth is influenced by several factors. The continued emphasis on user experience (UX) design will necessitate the use of advanced prototyping tools. Moreover, the expanding adoption of cloud-based solutions facilitates seamless collaboration across geographically dispersed teams, boosting the demand for cloud-integrated prototyping software. However, the market might face challenges from factors such as the high initial investment costs associated with some prototyping tools and the need for specialized skills to effectively utilize these advanced platforms. Nevertheless, the overall positive trajectory indicates considerable future potential for the software prototyping market, making it an attractive investment opportunity for stakeholders.
Software Prototyping Market Report: 2019-2033
This comprehensive report provides an in-depth analysis of the Software Prototyping market, encompassing market dynamics, growth trends, regional analysis, competitive landscape, and future outlook. The study period spans from 2019 to 2033, with 2025 serving as both the base and estimated year. The report is crucial for industry professionals, investors, and strategists seeking a clear understanding of this rapidly evolving market, projected to reach xx million by 2033.
Software Prototyping Market Dynamics & Structure
The Software Prototyping market, valued at xx million in 2025, is characterized by a moderately concentrated landscape with key players like InVision, Adobe, and Axure holding significant market share. Technological innovation, particularly in AI-powered prototyping tools and collaborative platforms, is a major growth driver. Regulatory frameworks surrounding data privacy and security are increasingly influencing market practices. The market also faces competition from low-code/no-code development platforms, which offer simplified prototyping capabilities. End-user demographics are expanding beyond software engineers to include designers, product managers, and business stakeholders. M&A activity in the sector remains moderate, with xx deals recorded between 2019 and 2024, primarily focused on consolidating smaller players.
- Market Concentration: Moderately concentrated, with top 5 players holding approximately xx% market share in 2025.
- Innovation Drivers: AI-powered prototyping, collaborative platforms, low-code/no-code integration.
- Regulatory Framework: GDPR, CCPA, and other data privacy regulations influencing data handling practices.
- Competitive Substitutes: Low-code/no-code development platforms, simplified design tools.
- End-User Demographics: Expanding to include designers, product managers, and business stakeholders.
- M&A Trends: xx M&A deals between 2019-2024, focusing on consolidation and expansion.
Software Prototyping Growth Trends & Insights
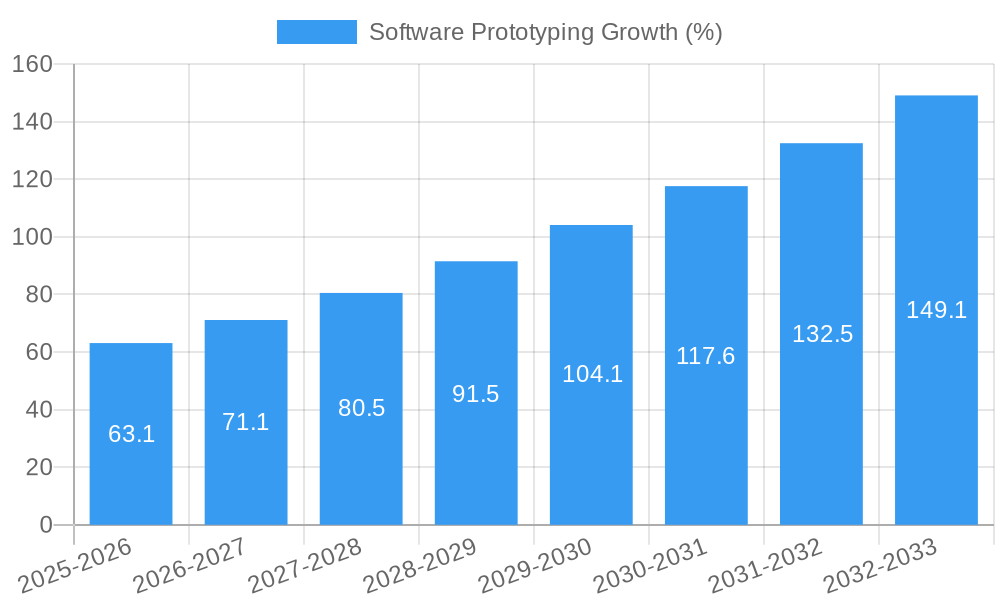
The Software Prototyping market experienced a Compound Annual Growth Rate (CAGR) of xx% during the historical period (2019-2024), driven by increased demand for faster and more efficient software development cycles. Market penetration is estimated at xx% in 2025, indicating significant untapped potential. Technological disruptions, such as the rise of AR/VR prototyping and the integration of AI in design processes, are further accelerating market growth. Consumer behavior shifts, including the preference for user-centric design approaches, are fueling demand for sophisticated prototyping tools. The market is projected to reach xx million by 2033, maintaining a CAGR of xx% during the forecast period (2025-2033).
Dominant Regions, Countries, or Segments in Software Prototyping
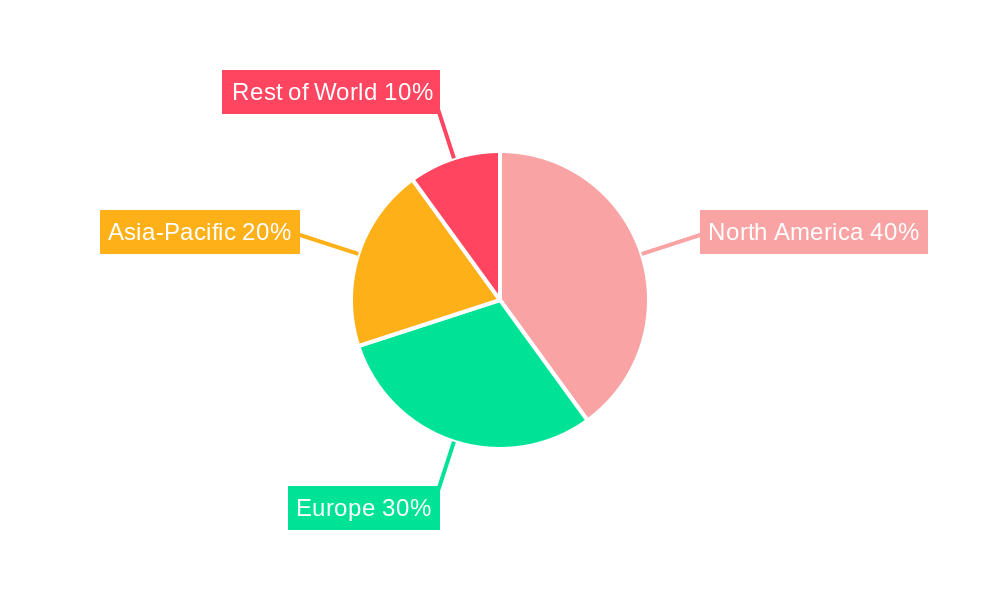
North America currently holds the largest market share in the Software Prototyping market, driven by factors including the high adoption of advanced technologies, a strong presence of tech giants, and a mature software development ecosystem. Strong venture capital investments and a robust startup culture also contribute to the region's dominance. Europe and Asia-Pacific are also exhibiting significant growth potential. The enterprise segment contributes the largest revenue share, followed by the SMB segment.
- North America Dominance: Strong presence of tech companies, high adoption of advanced technologies, and significant investments.
- European Growth: Increasing adoption in various industries, coupled with supportive government initiatives.
- Asia-Pacific Potential: Growing tech industry, rising digitalization, and expanding mobile market.
- Enterprise Segment Leadership: High demand for advanced prototyping tools and collaborative platforms.
Software Prototyping Product Landscape
The Software Prototyping market offers a diverse range of products, from low-fidelity wireframing tools to high-fidelity interactive prototypes. Products are characterized by features such as collaborative editing, real-time feedback mechanisms, version control, and integration with other design and development tools. Unique selling propositions include ease of use, advanced animation capabilities, and seamless integration with existing workflows. Continuous innovation in areas such as AI-assisted design and AR/VR prototyping are shaping the product landscape.
Key Drivers, Barriers & Challenges in Software Prototyping
Key Drivers:
- Increasing demand for agile software development methodologies.
- Growing adoption of user-centered design principles.
- Rise of low-code/no-code development platforms.
- Technological advancements in prototyping tools.
Challenges & Restraints:
- High cost of advanced prototyping tools.
- Complexity of integrating prototyping tools with existing workflows.
- Shortage of skilled professionals in prototyping and design.
- Security and data privacy concerns associated with cloud-based prototyping platforms.
Emerging Opportunities in Software Prototyping
- Expansion into niche markets like healthcare, education, and government.
- Development of AR/VR and immersive prototyping tools.
- Integration of AI and machine learning for intelligent design assistance.
- Growing demand for prototyping solutions for IoT and mobile applications.
Growth Accelerators in the Software Prototyping Industry
Technological breakthroughs in areas such as AI, AR/VR, and cloud computing are key growth accelerators. Strategic partnerships between prototyping tool vendors and software development companies are fostering market expansion. The increasing adoption of agile and DevOps methodologies, which heavily rely on prototyping, is driving demand. Expansion into new geographic markets and diversification of product offerings are also contributing to growth.
Key Players Shaping the Software Prototyping Market
- InVision
- Adobe
- Marvel
- Axure
- UXPin
- Fluid UI
- Moqups
- Proto.io
- Balsamiq
- Flinto
- iRise
- Framer
- Sketch
- Pidoco
Notable Milestones in Software Prototyping Sector
- 2020: InVision launches AI-powered design assistant.
- 2021: Adobe XD integrates with Figma.
- 2022: Axure releases updated collaboration features.
- 2023: Several mergers and acquisitions amongst smaller prototyping companies.
- 2024: UXPin integrates with leading project management platforms.
In-Depth Software Prototyping Market Outlook
The Software Prototyping market is poised for continued strong growth over the next decade, fueled by technological innovation and increasing demand for efficient software development processes. Strategic partnerships, expansion into new markets, and the emergence of innovative prototyping techniques will shape future market dynamics. The market offers significant opportunities for both established players and emerging companies to capitalize on the rising demand for user-centric design and agile development methodologies.
Software Prototyping Segmentation
-
1. Application
- 1.1. Large Enterprises
- 1.2. SMEs
-
2. Types
- 2.1. Cloud-Based
- 2.2. On-Premises
Software Prototyping Segmentation By Geography
-
1. North America
- 1.1. United States
- 1.2. Canada
- 1.3. Mexico
-
2. South America
- 2.1. Brazil
- 2.2. Argentina
- 2.3. Rest of South America
-
3. Europe
- 3.1. United Kingdom
- 3.2. Germany
- 3.3. France
- 3.4. Italy
- 3.5. Spain
- 3.6. Russia
- 3.7. Benelux
- 3.8. Nordics
- 3.9. Rest of Europe
-
4. Middle East & Africa
- 4.1. Turkey
- 4.2. Israel
- 4.3. GCC
- 4.4. North Africa
- 4.5. South Africa
- 4.6. Rest of Middle East & Africa
-
5. Asia Pacific
- 5.1. China
- 5.2. India
- 5.3. Japan
- 5.4. South Korea
- 5.5. ASEAN
- 5.6. Oceania
- 5.7. Rest of Asia Pacific
Software Prototyping REPORT HIGHLIGHTS
| Aspects | Details |
|---|---|
| Study Period | 2019-2033 |
| Base Year | 2024 |
| Estimated Year | 2025 |
| Forecast Period | 2025-2033 |
| Historical Period | 2019-2024 |
| Growth Rate | CAGR of 12.9% from 2019-2033 |
| Segmentation |
|
Table of Contents
- 1. Introduction
- 1.1. Research Scope
- 1.2. Market Segmentation
- 1.3. Research Methodology
- 1.4. Definitions and Assumptions
- 2. Executive Summary
- 2.1. Introduction
- 3. Market Dynamics
- 3.1. Introduction
- 3.2. Market Drivers
- 3.3. Market Restrains
- 3.4. Market Trends
- 4. Market Factor Analysis
- 4.1. Porters Five Forces
- 4.2. Supply/Value Chain
- 4.3. PESTEL analysis
- 4.4. Market Entropy
- 4.5. Patent/Trademark Analysis
- 5. Global Software Prototyping Analysis, Insights and Forecast, 2019-2031
- 5.1. Market Analysis, Insights and Forecast - by Application
- 5.1.1. Large Enterprises
- 5.1.2. SMEs
- 5.2. Market Analysis, Insights and Forecast - by Types
- 5.2.1. Cloud-Based
- 5.2.2. On-Premises
- 5.3. Market Analysis, Insights and Forecast - by Region
- 5.3.1. North America
- 5.3.2. South America
- 5.3.3. Europe
- 5.3.4. Middle East & Africa
- 5.3.5. Asia Pacific
- 5.1. Market Analysis, Insights and Forecast - by Application
- 6. North America Software Prototyping Analysis, Insights and Forecast, 2019-2031
- 6.1. Market Analysis, Insights and Forecast - by Application
- 6.1.1. Large Enterprises
- 6.1.2. SMEs
- 6.2. Market Analysis, Insights and Forecast - by Types
- 6.2.1. Cloud-Based
- 6.2.2. On-Premises
- 6.1. Market Analysis, Insights and Forecast - by Application
- 7. South America Software Prototyping Analysis, Insights and Forecast, 2019-2031
- 7.1. Market Analysis, Insights and Forecast - by Application
- 7.1.1. Large Enterprises
- 7.1.2. SMEs
- 7.2. Market Analysis, Insights and Forecast - by Types
- 7.2.1. Cloud-Based
- 7.2.2. On-Premises
- 7.1. Market Analysis, Insights and Forecast - by Application
- 8. Europe Software Prototyping Analysis, Insights and Forecast, 2019-2031
- 8.1. Market Analysis, Insights and Forecast - by Application
- 8.1.1. Large Enterprises
- 8.1.2. SMEs
- 8.2. Market Analysis, Insights and Forecast - by Types
- 8.2.1. Cloud-Based
- 8.2.2. On-Premises
- 8.1. Market Analysis, Insights and Forecast - by Application
- 9. Middle East & Africa Software Prototyping Analysis, Insights and Forecast, 2019-2031
- 9.1. Market Analysis, Insights and Forecast - by Application
- 9.1.1. Large Enterprises
- 9.1.2. SMEs
- 9.2. Market Analysis, Insights and Forecast - by Types
- 9.2.1. Cloud-Based
- 9.2.2. On-Premises
- 9.1. Market Analysis, Insights and Forecast - by Application
- 10. Asia Pacific Software Prototyping Analysis, Insights and Forecast, 2019-2031
- 10.1. Market Analysis, Insights and Forecast - by Application
- 10.1.1. Large Enterprises
- 10.1.2. SMEs
- 10.2. Market Analysis, Insights and Forecast - by Types
- 10.2.1. Cloud-Based
- 10.2.2. On-Premises
- 10.1. Market Analysis, Insights and Forecast - by Application
- 11. Competitive Analysis
- 11.1. Global Market Share Analysis 2024
- 11.2. Company Profiles
- 11.2.1 InVision
- 11.2.1.1. Overview
- 11.2.1.2. Products
- 11.2.1.3. SWOT Analysis
- 11.2.1.4. Recent Developments
- 11.2.1.5. Financials (Based on Availability)
- 11.2.2 Adobe
- 11.2.2.1. Overview
- 11.2.2.2. Products
- 11.2.2.3. SWOT Analysis
- 11.2.2.4. Recent Developments
- 11.2.2.5. Financials (Based on Availability)
- 11.2.3 Marvel
- 11.2.3.1. Overview
- 11.2.3.2. Products
- 11.2.3.3. SWOT Analysis
- 11.2.3.4. Recent Developments
- 11.2.3.5. Financials (Based on Availability)
- 11.2.4 Axure
- 11.2.4.1. Overview
- 11.2.4.2. Products
- 11.2.4.3. SWOT Analysis
- 11.2.4.4. Recent Developments
- 11.2.4.5. Financials (Based on Availability)
- 11.2.5 UXPin
- 11.2.5.1. Overview
- 11.2.5.2. Products
- 11.2.5.3. SWOT Analysis
- 11.2.5.4. Recent Developments
- 11.2.5.5. Financials (Based on Availability)
- 11.2.6 Fluid UI
- 11.2.6.1. Overview
- 11.2.6.2. Products
- 11.2.6.3. SWOT Analysis
- 11.2.6.4. Recent Developments
- 11.2.6.5. Financials (Based on Availability)
- 11.2.7 Moqups
- 11.2.7.1. Overview
- 11.2.7.2. Products
- 11.2.7.3. SWOT Analysis
- 11.2.7.4. Recent Developments
- 11.2.7.5. Financials (Based on Availability)
- 11.2.8 Proto.io
- 11.2.8.1. Overview
- 11.2.8.2. Products
- 11.2.8.3. SWOT Analysis
- 11.2.8.4. Recent Developments
- 11.2.8.5. Financials (Based on Availability)
- 11.2.9 Balsamiq
- 11.2.9.1. Overview
- 11.2.9.2. Products
- 11.2.9.3. SWOT Analysis
- 11.2.9.4. Recent Developments
- 11.2.9.5. Financials (Based on Availability)
- 11.2.10 Flinto
- 11.2.10.1. Overview
- 11.2.10.2. Products
- 11.2.10.3. SWOT Analysis
- 11.2.10.4. Recent Developments
- 11.2.10.5. Financials (Based on Availability)
- 11.2.11 iRise
- 11.2.11.1. Overview
- 11.2.11.2. Products
- 11.2.11.3. SWOT Analysis
- 11.2.11.4. Recent Developments
- 11.2.11.5. Financials (Based on Availability)
- 11.2.12 Framer
- 11.2.12.1. Overview
- 11.2.12.2. Products
- 11.2.12.3. SWOT Analysis
- 11.2.12.4. Recent Developments
- 11.2.12.5. Financials (Based on Availability)
- 11.2.13 Sketch
- 11.2.13.1. Overview
- 11.2.13.2. Products
- 11.2.13.3. SWOT Analysis
- 11.2.13.4. Recent Developments
- 11.2.13.5. Financials (Based on Availability)
- 11.2.14 Pidoco
- 11.2.14.1. Overview
- 11.2.14.2. Products
- 11.2.14.3. SWOT Analysis
- 11.2.14.4. Recent Developments
- 11.2.14.5. Financials (Based on Availability)
- 11.2.1 InVision
List of Figures
- Figure 1: Global Software Prototyping Revenue Breakdown (million, %) by Region 2024 & 2032
- Figure 2: North America Software Prototyping Revenue (million), by Application 2024 & 2032
- Figure 3: North America Software Prototyping Revenue Share (%), by Application 2024 & 2032
- Figure 4: North America Software Prototyping Revenue (million), by Types 2024 & 2032
- Figure 5: North America Software Prototyping Revenue Share (%), by Types 2024 & 2032
- Figure 6: North America Software Prototyping Revenue (million), by Country 2024 & 2032
- Figure 7: North America Software Prototyping Revenue Share (%), by Country 2024 & 2032
- Figure 8: South America Software Prototyping Revenue (million), by Application 2024 & 2032
- Figure 9: South America Software Prototyping Revenue Share (%), by Application 2024 & 2032
- Figure 10: South America Software Prototyping Revenue (million), by Types 2024 & 2032
- Figure 11: South America Software Prototyping Revenue Share (%), by Types 2024 & 2032
- Figure 12: South America Software Prototyping Revenue (million), by Country 2024 & 2032
- Figure 13: South America Software Prototyping Revenue Share (%), by Country 2024 & 2032
- Figure 14: Europe Software Prototyping Revenue (million), by Application 2024 & 2032
- Figure 15: Europe Software Prototyping Revenue Share (%), by Application 2024 & 2032
- Figure 16: Europe Software Prototyping Revenue (million), by Types 2024 & 2032
- Figure 17: Europe Software Prototyping Revenue Share (%), by Types 2024 & 2032
- Figure 18: Europe Software Prototyping Revenue (million), by Country 2024 & 2032
- Figure 19: Europe Software Prototyping Revenue Share (%), by Country 2024 & 2032
- Figure 20: Middle East & Africa Software Prototyping Revenue (million), by Application 2024 & 2032
- Figure 21: Middle East & Africa Software Prototyping Revenue Share (%), by Application 2024 & 2032
- Figure 22: Middle East & Africa Software Prototyping Revenue (million), by Types 2024 & 2032
- Figure 23: Middle East & Africa Software Prototyping Revenue Share (%), by Types 2024 & 2032
- Figure 24: Middle East & Africa Software Prototyping Revenue (million), by Country 2024 & 2032
- Figure 25: Middle East & Africa Software Prototyping Revenue Share (%), by Country 2024 & 2032
- Figure 26: Asia Pacific Software Prototyping Revenue (million), by Application 2024 & 2032
- Figure 27: Asia Pacific Software Prototyping Revenue Share (%), by Application 2024 & 2032
- Figure 28: Asia Pacific Software Prototyping Revenue (million), by Types 2024 & 2032
- Figure 29: Asia Pacific Software Prototyping Revenue Share (%), by Types 2024 & 2032
- Figure 30: Asia Pacific Software Prototyping Revenue (million), by Country 2024 & 2032
- Figure 31: Asia Pacific Software Prototyping Revenue Share (%), by Country 2024 & 2032
List of Tables
- Table 1: Global Software Prototyping Revenue million Forecast, by Region 2019 & 2032
- Table 2: Global Software Prototyping Revenue million Forecast, by Application 2019 & 2032
- Table 3: Global Software Prototyping Revenue million Forecast, by Types 2019 & 2032
- Table 4: Global Software Prototyping Revenue million Forecast, by Region 2019 & 2032
- Table 5: Global Software Prototyping Revenue million Forecast, by Application 2019 & 2032
- Table 6: Global Software Prototyping Revenue million Forecast, by Types 2019 & 2032
- Table 7: Global Software Prototyping Revenue million Forecast, by Country 2019 & 2032
- Table 8: United States Software Prototyping Revenue (million) Forecast, by Application 2019 & 2032
- Table 9: Canada Software Prototyping Revenue (million) Forecast, by Application 2019 & 2032
- Table 10: Mexico Software Prototyping Revenue (million) Forecast, by Application 2019 & 2032
- Table 11: Global Software Prototyping Revenue million Forecast, by Application 2019 & 2032
- Table 12: Global Software Prototyping Revenue million Forecast, by Types 2019 & 2032
- Table 13: Global Software Prototyping Revenue million Forecast, by Country 2019 & 2032
- Table 14: Brazil Software Prototyping Revenue (million) Forecast, by Application 2019 & 2032
- Table 15: Argentina Software Prototyping Revenue (million) Forecast, by Application 2019 & 2032
- Table 16: Rest of South America Software Prototyping Revenue (million) Forecast, by Application 2019 & 2032
- Table 17: Global Software Prototyping Revenue million Forecast, by Application 2019 & 2032
- Table 18: Global Software Prototyping Revenue million Forecast, by Types 2019 & 2032
- Table 19: Global Software Prototyping Revenue million Forecast, by Country 2019 & 2032
- Table 20: United Kingdom Software Prototyping Revenue (million) Forecast, by Application 2019 & 2032
- Table 21: Germany Software Prototyping Revenue (million) Forecast, by Application 2019 & 2032
- Table 22: France Software Prototyping Revenue (million) Forecast, by Application 2019 & 2032
- Table 23: Italy Software Prototyping Revenue (million) Forecast, by Application 2019 & 2032
- Table 24: Spain Software Prototyping Revenue (million) Forecast, by Application 2019 & 2032
- Table 25: Russia Software Prototyping Revenue (million) Forecast, by Application 2019 & 2032
- Table 26: Benelux Software Prototyping Revenue (million) Forecast, by Application 2019 & 2032
- Table 27: Nordics Software Prototyping Revenue (million) Forecast, by Application 2019 & 2032
- Table 28: Rest of Europe Software Prototyping Revenue (million) Forecast, by Application 2019 & 2032
- Table 29: Global Software Prototyping Revenue million Forecast, by Application 2019 & 2032
- Table 30: Global Software Prototyping Revenue million Forecast, by Types 2019 & 2032
- Table 31: Global Software Prototyping Revenue million Forecast, by Country 2019 & 2032
- Table 32: Turkey Software Prototyping Revenue (million) Forecast, by Application 2019 & 2032
- Table 33: Israel Software Prototyping Revenue (million) Forecast, by Application 2019 & 2032
- Table 34: GCC Software Prototyping Revenue (million) Forecast, by Application 2019 & 2032
- Table 35: North Africa Software Prototyping Revenue (million) Forecast, by Application 2019 & 2032
- Table 36: South Africa Software Prototyping Revenue (million) Forecast, by Application 2019 & 2032
- Table 37: Rest of Middle East & Africa Software Prototyping Revenue (million) Forecast, by Application 2019 & 2032
- Table 38: Global Software Prototyping Revenue million Forecast, by Application 2019 & 2032
- Table 39: Global Software Prototyping Revenue million Forecast, by Types 2019 & 2032
- Table 40: Global Software Prototyping Revenue million Forecast, by Country 2019 & 2032
- Table 41: China Software Prototyping Revenue (million) Forecast, by Application 2019 & 2032
- Table 42: India Software Prototyping Revenue (million) Forecast, by Application 2019 & 2032
- Table 43: Japan Software Prototyping Revenue (million) Forecast, by Application 2019 & 2032
- Table 44: South Korea Software Prototyping Revenue (million) Forecast, by Application 2019 & 2032
- Table 45: ASEAN Software Prototyping Revenue (million) Forecast, by Application 2019 & 2032
- Table 46: Oceania Software Prototyping Revenue (million) Forecast, by Application 2019 & 2032
- Table 47: Rest of Asia Pacific Software Prototyping Revenue (million) Forecast, by Application 2019 & 2032
Frequently Asked Questions
1. What is the projected Compound Annual Growth Rate (CAGR) of the Software Prototyping?
The projected CAGR is approximately 12.9%.
2. Which companies are prominent players in the Software Prototyping?
Key companies in the market include InVision, Adobe, Marvel, Axure, UXPin, Fluid UI, Moqups, Proto.io, Balsamiq, Flinto, iRise, Framer, Sketch, Pidoco.
3. What are the main segments of the Software Prototyping?
The market segments include Application, Types.
4. Can you provide details about the market size?
The market size is estimated to be USD 502 million as of 2022.
5. What are some drivers contributing to market growth?
N/A
6. What are the notable trends driving market growth?
N/A
7. Are there any restraints impacting market growth?
N/A
8. Can you provide examples of recent developments in the market?
N/A
9. What pricing options are available for accessing the report?
Pricing options include single-user, multi-user, and enterprise licenses priced at USD 3350.00, USD 5025.00, and USD 6700.00 respectively.
10. Is the market size provided in terms of value or volume?
The market size is provided in terms of value, measured in million.
11. Are there any specific market keywords associated with the report?
Yes, the market keyword associated with the report is "Software Prototyping," which aids in identifying and referencing the specific market segment covered.
12. How do I determine which pricing option suits my needs best?
The pricing options vary based on user requirements and access needs. Individual users may opt for single-user licenses, while businesses requiring broader access may choose multi-user or enterprise licenses for cost-effective access to the report.
13. Are there any additional resources or data provided in the Software Prototyping report?
While the report offers comprehensive insights, it's advisable to review the specific contents or supplementary materials provided to ascertain if additional resources or data are available.
14. How can I stay updated on further developments or reports in the Software Prototyping?
To stay informed about further developments, trends, and reports in the Software Prototyping, consider subscribing to industry newsletters, following relevant companies and organizations, or regularly checking reputable industry news sources and publications.
Methodology
Step 1 - Identification of Relevant Samples Size from Population Database


Step 2 - Approaches for Defining Global Market Size (Value, Volume* & Price*)

Note*: In applicable scenarios
Step 3 - Data Sources
Primary Research
- Web Analytics
- Survey Reports
- Research Institute
- Latest Research Reports
- Opinion Leaders
Secondary Research
- Annual Reports
- White Paper
- Latest Press Release
- Industry Association
- Paid Database
- Investor Presentations

Step 4 - Data Triangulation
Involves using different sources of information in order to increase the validity of a study
These sources are likely to be stakeholders in a program - participants, other researchers, program staff, other community members, and so on.
Then we put all data in single framework & apply various statistical tools to find out the dynamic on the market.
During the analysis stage, feedback from the stakeholder groups would be compared to determine areas of agreement as well as areas of divergence


