
Key Insights
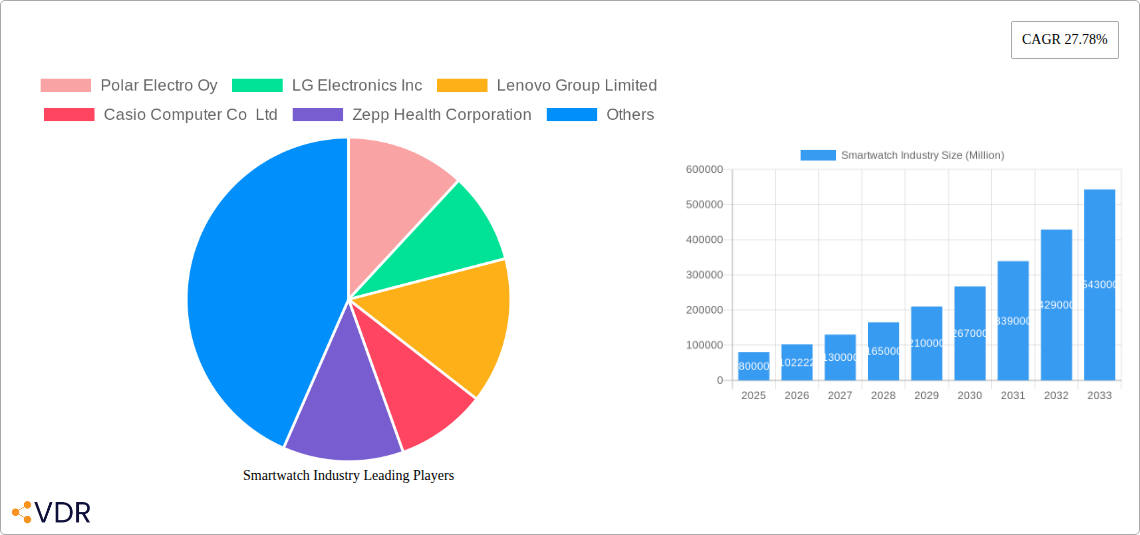
The global smartwatch market is experiencing robust growth, fueled by a confluence of factors. The market's Compound Annual Growth Rate (CAGR) of 27.78% from 2019-2033 indicates significant expansion, driven primarily by increasing consumer demand for fitness tracking, health monitoring capabilities, and seamless smartphone integration. Technological advancements, such as improved battery life, enhanced display technologies (AMOLED, PMOLED, TFT LCD), and the integration of advanced sensors, are further propelling market growth. The diversification of applications beyond fitness tracking—into areas like medical monitoring, personal assistance, and even fashion—broadens the market's appeal to a wider demographic. Key players like Apple, Samsung, Fitbit, and Garmin continue to dominate the market, leveraging brand recognition and technological prowess. However, the emergence of innovative startups and the entry of established electronics manufacturers into the smartwatch arena are fostering greater competition. Segment-wise, the AMOLED display type is expected to hold a significant market share due to its superior visual quality. Similarly, the health and fitness applications segment exhibits strong growth potential as consumers increasingly prioritize personal well-being.
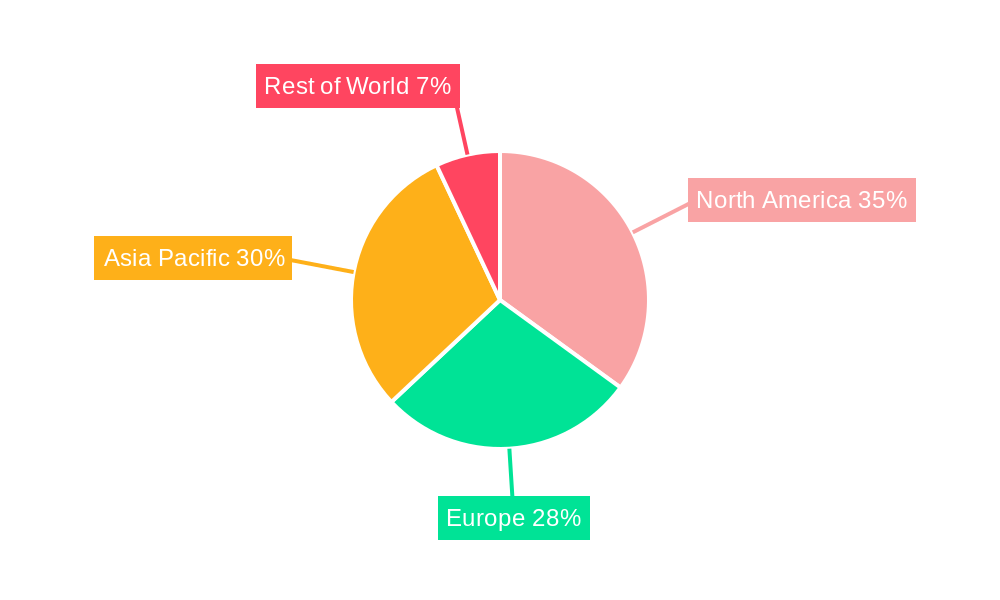
While the market displays promising growth trajectories, challenges remain. Pricing remains a barrier for certain segments of the population, particularly in developing economies. Concerns about data privacy and battery life continue to influence consumer purchasing decisions. Furthermore, the intense competition among established brands and emerging players necessitates continuous innovation and marketing efforts to maintain a competitive edge. Despite these challenges, the long-term outlook for the smartwatch market remains positive, with consistent growth expected throughout the forecast period, driven by ongoing technological advancements and increasing consumer adoption of wearable technology. The market's segmentation, across operating systems (WatchOS, WearOS, etc.), display types, and applications, offers significant opportunities for both established players and new entrants to carve out their niches. The Asia Pacific region, with its rapidly expanding middle class and increasing smartphone penetration, is anticipated to experience the most significant growth.
Smartwatch Industry Market Report: 2019-2033
This comprehensive report provides an in-depth analysis of the smartwatch industry, encompassing market dynamics, growth trends, dominant segments, competitive landscape, and future outlook. The study period covers 2019-2033, with a base year of 2025 and a forecast period of 2025-2033. This report is invaluable for industry professionals, investors, and anyone seeking a thorough understanding of this rapidly evolving market. The report leverages proprietary data and expert analysis to deliver actionable insights across various smartwatch segments including the parent market and child markets.
Smartwatch Industry Market Dynamics & Structure
The smartwatch market, valued at xx million units in 2024, is characterized by a moderately concentrated landscape with key players like Apple, Samsung, and Garmin holding significant market share. Technological innovation, driven by advancements in processing power, display technology (AMOLED, PMOLED, TFT LCD), and sensor integration, is a major growth driver. Regulatory frameworks concerning data privacy and health information are increasingly shaping market dynamics. Competitive substitutes include fitness trackers and basic smartbands, while the market also faces challenges from rising component costs and supply chain disruptions.
- Market Concentration: Highly concentrated with top 5 players holding approximately xx% market share in 2024.
- Technological Innovation: Focus on improved battery life, enhanced health monitoring features (ECG, SpO2), and seamless integration with smartphones.
- Regulatory Landscape: Increasing scrutiny on data privacy and security compliance impacting product development and market access.
- Competitive Landscape: Intense rivalry among major players, with strategic partnerships, product diversification, and aggressive marketing driving competition.
- M&A Activity: xx M&A deals recorded between 2019 and 2024, primarily focused on technology acquisitions and market expansion.
- End-User Demographics: Growing adoption among younger demographics (18-35), driven by lifestyle choices and technological affinity.
Smartwatch Industry Growth Trends & Insights
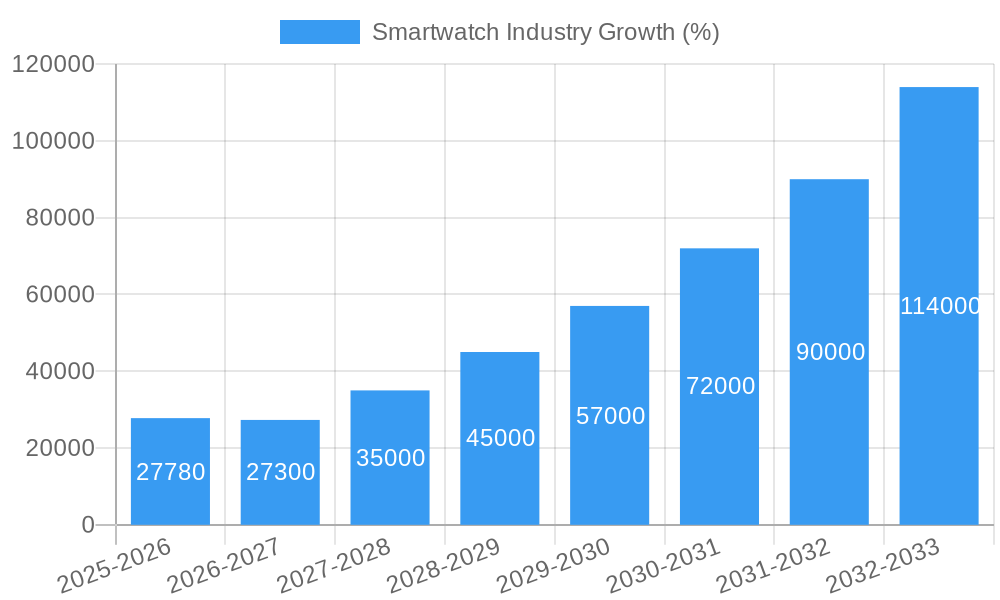
The smartwatch market witnessed significant growth during the historical period (2019-2024), driven by factors such as increasing smartphone penetration, rising consumer disposable incomes, and the growing popularity of fitness and health tracking. The market is projected to exhibit a CAGR of xx% during the forecast period (2025-2033), reaching xx million units by 2033. Technological disruptions, such as the introduction of advanced health sensors and improved battery technologies, are further fueling market expansion. Changing consumer preferences, including a shift towards personalized health management and connected fitness experiences, contribute to robust adoption rates. Market penetration is expected to reach xx% by 2033, indicating considerable growth potential.
Dominant Regions, Countries, or Segments in Smartwatch Industry
North America and Western Europe currently dominate the smartwatch market, driven by high consumer spending power and early adoption of technology. Within the product segments, the Watch OS operating system holds a significant market share, benefiting from Apple's strong brand recognition and ecosystem. AMOLED display technology is gaining traction due to its superior visual quality. The personal assistance application segment leads in terms of market size, highlighting the convenience and functionality smartwatches offer in daily life. Growth in Asia-Pacific is expected to accelerate in the coming years, fuelled by increasing smartphone penetration and rising middle-class income.
- By Operating System: Watch OS (xx million units), Wear OS (xx million units), Other Operating Systems (xx million units)
- By Display Type: AMOLED (xx million units), PMOLED (xx million units), TFT LCD (xx million units)
- By Application: Personal Assistance (xx million units), Medical (xx million units), Sports (xx million units), Other Applications (xx million units)
- Key Drivers: Rising disposable incomes, increased health consciousness, technological advancements, and supportive government policies.
Smartwatch Industry Product Landscape
Smartwatches are evolving beyond basic timekeeping, incorporating advanced features like contactless payments, health monitoring (heart rate, sleep tracking, ECG), GPS tracking, and cellular connectivity. Manufacturers are focusing on enhanced user interfaces, longer battery life, and more personalized experiences. The unique selling propositions include sophisticated health tracking capabilities, stylish designs, and seamless integration with existing ecosystems. Technological advancements in materials, battery technology, and sensor miniaturization are driving product innovation.
Key Drivers, Barriers & Challenges in Smartwatch Industry
Key Drivers:
- Increasing demand for wearable technology integrated into daily life.
- Enhanced health and fitness tracking functionalities.
- Advancements in battery technology and processing power.
- Growing adoption of smartphone-based health and fitness apps.
Key Challenges and Restraints:
- High manufacturing costs and fluctuating component prices.
- Intense competition and increasing market saturation.
- Concerns regarding data privacy and security.
- Limited battery life and durability concerns.
- Supply chain disruptions impacting production and availability.
Emerging Opportunities in Smartwatch Industry
- Expansion into niche markets: Targeting specific demographics (e.g., senior citizens, children).
- Development of specialized applications: Integration with healthcare systems for remote patient monitoring.
- Focus on sustainable and eco-friendly materials: Reducing environmental impact.
- Enhanced personalization and customization options: Tailoring smartwatch experiences to individual needs.
Growth Accelerators in the Smartwatch Industry
Technological breakthroughs in battery technology and sensor integration will play a critical role in driving long-term growth. Strategic partnerships among technology companies, healthcare providers, and fitness brands will expand market reach and functionalities. Market expansion into emerging economies and the development of affordable smartwatches will unlock significant growth opportunities.
Key Players Shaping the Smartwatch Industry Market
- Polar Electro Oy
- LG Electronics Inc
- Lenovo Group Limited
- Casio Computer Co Ltd
- Zepp Health Corporation
- Samsung Electronics Co Ltd
- Garmin Ltd
- Fitbit Inc
- Huawei Technologies Co Ltd
- Fossil Group Inc
- Apple Inc
- Sony Corporation
Notable Milestones in Smartwatch Industry Sector
- June 2022: Apple previewed watchOS 9, enhancing features and user experience.
- January 2022: Fossil and Razer launched a limited-edition smartwatch (1,337 units).
In-Depth Smartwatch Industry Market Outlook
The smartwatch market is poised for continued growth, fueled by technological advancements, expanding applications, and increasing consumer demand. Strategic partnerships and market expansion into new geographic regions will create significant opportunities for market players. The focus on personalized health and wellness solutions will drive innovation and further adoption. The market's future trajectory remains positive, indicating considerable potential for both established players and emerging entrants.
Smartwatch Industry Segmentation
-
1. Operating System
- 1.1. Watch OS
- 1.2. Wear OS
- 1.3. Other Operating Systems
-
2. Display Type
- 2.1. AMOLED
- 2.2. PMOLED
- 2.3. TFT LCD
-
3. Application
- 3.1. Personal Assistance
- 3.2. Medical
- 3.3. Sports
- 3.4. Other Applications
Smartwatch Industry Segmentation By Geography
- 1. North America: United States Canada Mexico
- 2. Europe: Germany: France: Italy: United Kingdom Netherlands Rest of Europe
- 3. Asia Pacific: China, Japan, India, South Korea, Taiwan, Australia, Rest of Asia-Pacific
- 4. South America : Brazil, Argentina, Rest of South America
- 5. MEA: Middle East, Africa
Smartwatch Industry REPORT HIGHLIGHTS
| Aspects | Details |
|---|---|
| Study Period | 2019-2033 |
| Base Year | 2024 |
| Estimated Year | 2025 |
| Forecast Period | 2025-2033 |
| Historical Period | 2019-2024 |
| Growth Rate | CAGR of 27.78% from 2019-2033 |
| Segmentation |
|
Table of Contents
- 1. Introduction
- 1.1. Research Scope
- 1.2. Market Segmentation
- 1.3. Research Methodology
- 1.4. Definitions and Assumptions
- 2. Executive Summary
- 2.1. Introduction
- 3. Market Dynamics
- 3.1. Introduction
- 3.2. Market Drivers
- 3.2.1. Increasing Technological Advancements in the Wearables Market; Increasing Health Awareness among the Consumers
- 3.3. Market Restrains
- 3.3.1 Growing Complexity of Wearable Devices
- 3.3.2 Limited Use of Features
- 3.3.3 and Security Risks
- 3.4. Market Trends
- 3.4.1. Sports Segment to Account for Significant Market Share
- 4. Market Factor Analysis
- 4.1. Porters Five Forces
- 4.2. Supply/Value Chain
- 4.3. PESTEL analysis
- 4.4. Market Entropy
- 4.5. Patent/Trademark Analysis
- 5. Global Smartwatch Industry Analysis, Insights and Forecast, 2019-2031
- 5.1. Market Analysis, Insights and Forecast - by Operating System
- 5.1.1. Watch OS
- 5.1.2. Wear OS
- 5.1.3. Other Operating Systems
- 5.2. Market Analysis, Insights and Forecast - by Display Type
- 5.2.1. AMOLED
- 5.2.2. PMOLED
- 5.2.3. TFT LCD
- 5.3. Market Analysis, Insights and Forecast - by Application
- 5.3.1. Personal Assistance
- 5.3.2. Medical
- 5.3.3. Sports
- 5.3.4. Other Applications
- 5.4. Market Analysis, Insights and Forecast - by Region
- 5.4.1. North America: United States Canada Mexico
- 5.4.2. Europe: Germany: France: Italy: United Kingdom Netherlands Rest of Europe
- 5.4.3. Asia Pacific: China, Japan, India, South Korea, Taiwan, Australia, Rest of Asia-Pacific
- 5.4.4. South America : Brazil, Argentina, Rest of South America
- 5.4.5. MEA: Middle East, Africa
- 5.1. Market Analysis, Insights and Forecast - by Operating System
- 6. North America: United States Canada Mexico Smartwatch Industry Analysis, Insights and Forecast, 2019-2031
- 6.1. Market Analysis, Insights and Forecast - by Operating System
- 6.1.1. Watch OS
- 6.1.2. Wear OS
- 6.1.3. Other Operating Systems
- 6.2. Market Analysis, Insights and Forecast - by Display Type
- 6.2.1. AMOLED
- 6.2.2. PMOLED
- 6.2.3. TFT LCD
- 6.3. Market Analysis, Insights and Forecast - by Application
- 6.3.1. Personal Assistance
- 6.3.2. Medical
- 6.3.3. Sports
- 6.3.4. Other Applications
- 6.1. Market Analysis, Insights and Forecast - by Operating System
- 7. Europe: Germany: France: Italy: United Kingdom Netherlands Rest of Europe Smartwatch Industry Analysis, Insights and Forecast, 2019-2031
- 7.1. Market Analysis, Insights and Forecast - by Operating System
- 7.1.1. Watch OS
- 7.1.2. Wear OS
- 7.1.3. Other Operating Systems
- 7.2. Market Analysis, Insights and Forecast - by Display Type
- 7.2.1. AMOLED
- 7.2.2. PMOLED
- 7.2.3. TFT LCD
- 7.3. Market Analysis, Insights and Forecast - by Application
- 7.3.1. Personal Assistance
- 7.3.2. Medical
- 7.3.3. Sports
- 7.3.4. Other Applications
- 7.1. Market Analysis, Insights and Forecast - by Operating System
- 8. Asia Pacific: China, Japan, India, South Korea, Taiwan, Australia, Rest of Asia-Pacific Smartwatch Industry Analysis, Insights and Forecast, 2019-2031
- 8.1. Market Analysis, Insights and Forecast - by Operating System
- 8.1.1. Watch OS
- 8.1.2. Wear OS
- 8.1.3. Other Operating Systems
- 8.2. Market Analysis, Insights and Forecast - by Display Type
- 8.2.1. AMOLED
- 8.2.2. PMOLED
- 8.2.3. TFT LCD
- 8.3. Market Analysis, Insights and Forecast - by Application
- 8.3.1. Personal Assistance
- 8.3.2. Medical
- 8.3.3. Sports
- 8.3.4. Other Applications
- 8.1. Market Analysis, Insights and Forecast - by Operating System
- 9. South America : Brazil, Argentina, Rest of South America Smartwatch Industry Analysis, Insights and Forecast, 2019-2031
- 9.1. Market Analysis, Insights and Forecast - by Operating System
- 9.1.1. Watch OS
- 9.1.2. Wear OS
- 9.1.3. Other Operating Systems
- 9.2. Market Analysis, Insights and Forecast - by Display Type
- 9.2.1. AMOLED
- 9.2.2. PMOLED
- 9.2.3. TFT LCD
- 9.3. Market Analysis, Insights and Forecast - by Application
- 9.3.1. Personal Assistance
- 9.3.2. Medical
- 9.3.3. Sports
- 9.3.4. Other Applications
- 9.1. Market Analysis, Insights and Forecast - by Operating System
- 10. MEA: Middle East, Africa Smartwatch Industry Analysis, Insights and Forecast, 2019-2031
- 10.1. Market Analysis, Insights and Forecast - by Operating System
- 10.1.1. Watch OS
- 10.1.2. Wear OS
- 10.1.3. Other Operating Systems
- 10.2. Market Analysis, Insights and Forecast - by Display Type
- 10.2.1. AMOLED
- 10.2.2. PMOLED
- 10.2.3. TFT LCD
- 10.3. Market Analysis, Insights and Forecast - by Application
- 10.3.1. Personal Assistance
- 10.3.2. Medical
- 10.3.3. Sports
- 10.3.4. Other Applications
- 10.1. Market Analysis, Insights and Forecast - by Operating System
- 11. North America Smartwatch Industry Analysis, Insights and Forecast, 2019-2031
- 11.1. Market Analysis, Insights and Forecast - By Country/Sub-region
- 11.1.1.
- 12. Europe Smartwatch Industry Analysis, Insights and Forecast, 2019-2031
- 12.1. Market Analysis, Insights and Forecast - By Country/Sub-region
- 12.1.1.
- 13. Asia Pacific Smartwatch Industry Analysis, Insights and Forecast, 2019-2031
- 13.1. Market Analysis, Insights and Forecast - By Country/Sub-region
- 13.1.1.
- 14. Rest of the World Smartwatch Industry Analysis, Insights and Forecast, 2019-2031
- 14.1. Market Analysis, Insights and Forecast - By Country/Sub-region
- 14.1.1.
- 15. Competitive Analysis
- 15.1. Global Market Share Analysis 2024
- 15.2. Company Profiles
- 15.2.1 Polar Electro Oy
- 15.2.1.1. Overview
- 15.2.1.2. Products
- 15.2.1.3. SWOT Analysis
- 15.2.1.4. Recent Developments
- 15.2.1.5. Financials (Based on Availability)
- 15.2.2 LG Electronics Inc
- 15.2.2.1. Overview
- 15.2.2.2. Products
- 15.2.2.3. SWOT Analysis
- 15.2.2.4. Recent Developments
- 15.2.2.5. Financials (Based on Availability)
- 15.2.3 Lenovo Group Limited
- 15.2.3.1. Overview
- 15.2.3.2. Products
- 15.2.3.3. SWOT Analysis
- 15.2.3.4. Recent Developments
- 15.2.3.5. Financials (Based on Availability)
- 15.2.4 Casio Computer Co Ltd
- 15.2.4.1. Overview
- 15.2.4.2. Products
- 15.2.4.3. SWOT Analysis
- 15.2.4.4. Recent Developments
- 15.2.4.5. Financials (Based on Availability)
- 15.2.5 Zepp Health Corporation
- 15.2.5.1. Overview
- 15.2.5.2. Products
- 15.2.5.3. SWOT Analysis
- 15.2.5.4. Recent Developments
- 15.2.5.5. Financials (Based on Availability)
- 15.2.6 Samsung Electronics Co Ltd
- 15.2.6.1. Overview
- 15.2.6.2. Products
- 15.2.6.3. SWOT Analysis
- 15.2.6.4. Recent Developments
- 15.2.6.5. Financials (Based on Availability)
- 15.2.7 Garmin Ltd
- 15.2.7.1. Overview
- 15.2.7.2. Products
- 15.2.7.3. SWOT Analysis
- 15.2.7.4. Recent Developments
- 15.2.7.5. Financials (Based on Availability)
- 15.2.8 Fitbit Inc
- 15.2.8.1. Overview
- 15.2.8.2. Products
- 15.2.8.3. SWOT Analysis
- 15.2.8.4. Recent Developments
- 15.2.8.5. Financials (Based on Availability)
- 15.2.9 Huawei Technologies Co Ltd
- 15.2.9.1. Overview
- 15.2.9.2. Products
- 15.2.9.3. SWOT Analysis
- 15.2.9.4. Recent Developments
- 15.2.9.5. Financials (Based on Availability)
- 15.2.10 Fossil Group Inc
- 15.2.10.1. Overview
- 15.2.10.2. Products
- 15.2.10.3. SWOT Analysis
- 15.2.10.4. Recent Developments
- 15.2.10.5. Financials (Based on Availability)
- 15.2.11 Apple Inc
- 15.2.11.1. Overview
- 15.2.11.2. Products
- 15.2.11.3. SWOT Analysis
- 15.2.11.4. Recent Developments
- 15.2.11.5. Financials (Based on Availability)
- 15.2.12 Sony Corporation
- 15.2.12.1. Overview
- 15.2.12.2. Products
- 15.2.12.3. SWOT Analysis
- 15.2.12.4. Recent Developments
- 15.2.12.5. Financials (Based on Availability)
- 15.2.1 Polar Electro Oy
List of Figures
- Figure 1: Global Smartwatch Industry Revenue Breakdown (Million, %) by Region 2024 & 2032
- Figure 2: Global Smartwatch Industry Volume Breakdown (Million, %) by Region 2024 & 2032
- Figure 3: North America Smartwatch Industry Revenue (Million), by Country 2024 & 2032
- Figure 4: North America Smartwatch Industry Volume (Million), by Country 2024 & 2032
- Figure 5: North America Smartwatch Industry Revenue Share (%), by Country 2024 & 2032
- Figure 6: North America Smartwatch Industry Volume Share (%), by Country 2024 & 2032
- Figure 7: Europe Smartwatch Industry Revenue (Million), by Country 2024 & 2032
- Figure 8: Europe Smartwatch Industry Volume (Million), by Country 2024 & 2032
- Figure 9: Europe Smartwatch Industry Revenue Share (%), by Country 2024 & 2032
- Figure 10: Europe Smartwatch Industry Volume Share (%), by Country 2024 & 2032
- Figure 11: Asia Pacific Smartwatch Industry Revenue (Million), by Country 2024 & 2032
- Figure 12: Asia Pacific Smartwatch Industry Volume (Million), by Country 2024 & 2032
- Figure 13: Asia Pacific Smartwatch Industry Revenue Share (%), by Country 2024 & 2032
- Figure 14: Asia Pacific Smartwatch Industry Volume Share (%), by Country 2024 & 2032
- Figure 15: Rest of the World Smartwatch Industry Revenue (Million), by Country 2024 & 2032
- Figure 16: Rest of the World Smartwatch Industry Volume (Million), by Country 2024 & 2032
- Figure 17: Rest of the World Smartwatch Industry Revenue Share (%), by Country 2024 & 2032
- Figure 18: Rest of the World Smartwatch Industry Volume Share (%), by Country 2024 & 2032
- Figure 19: North America: United States Canada Mexico Smartwatch Industry Revenue (Million), by Operating System 2024 & 2032
- Figure 20: North America: United States Canada Mexico Smartwatch Industry Volume (Million), by Operating System 2024 & 2032
- Figure 21: North America: United States Canada Mexico Smartwatch Industry Revenue Share (%), by Operating System 2024 & 2032
- Figure 22: North America: United States Canada Mexico Smartwatch Industry Volume Share (%), by Operating System 2024 & 2032
- Figure 23: North America: United States Canada Mexico Smartwatch Industry Revenue (Million), by Display Type 2024 & 2032
- Figure 24: North America: United States Canada Mexico Smartwatch Industry Volume (Million), by Display Type 2024 & 2032
- Figure 25: North America: United States Canada Mexico Smartwatch Industry Revenue Share (%), by Display Type 2024 & 2032
- Figure 26: North America: United States Canada Mexico Smartwatch Industry Volume Share (%), by Display Type 2024 & 2032
- Figure 27: North America: United States Canada Mexico Smartwatch Industry Revenue (Million), by Application 2024 & 2032
- Figure 28: North America: United States Canada Mexico Smartwatch Industry Volume (Million), by Application 2024 & 2032
- Figure 29: North America: United States Canada Mexico Smartwatch Industry Revenue Share (%), by Application 2024 & 2032
- Figure 30: North America: United States Canada Mexico Smartwatch Industry Volume Share (%), by Application 2024 & 2032
- Figure 31: North America: United States Canada Mexico Smartwatch Industry Revenue (Million), by Country 2024 & 2032
- Figure 32: North America: United States Canada Mexico Smartwatch Industry Volume (Million), by Country 2024 & 2032
- Figure 33: North America: United States Canada Mexico Smartwatch Industry Revenue Share (%), by Country 2024 & 2032
- Figure 34: North America: United States Canada Mexico Smartwatch Industry Volume Share (%), by Country 2024 & 2032
- Figure 35: Europe: Germany: France: Italy: United Kingdom Netherlands Rest of Europe Smartwatch Industry Revenue (Million), by Operating System 2024 & 2032
- Figure 36: Europe: Germany: France: Italy: United Kingdom Netherlands Rest of Europe Smartwatch Industry Volume (Million), by Operating System 2024 & 2032
- Figure 37: Europe: Germany: France: Italy: United Kingdom Netherlands Rest of Europe Smartwatch Industry Revenue Share (%), by Operating System 2024 & 2032
- Figure 38: Europe: Germany: France: Italy: United Kingdom Netherlands Rest of Europe Smartwatch Industry Volume Share (%), by Operating System 2024 & 2032
- Figure 39: Europe: Germany: France: Italy: United Kingdom Netherlands Rest of Europe Smartwatch Industry Revenue (Million), by Display Type 2024 & 2032
- Figure 40: Europe: Germany: France: Italy: United Kingdom Netherlands Rest of Europe Smartwatch Industry Volume (Million), by Display Type 2024 & 2032
- Figure 41: Europe: Germany: France: Italy: United Kingdom Netherlands Rest of Europe Smartwatch Industry Revenue Share (%), by Display Type 2024 & 2032
- Figure 42: Europe: Germany: France: Italy: United Kingdom Netherlands Rest of Europe Smartwatch Industry Volume Share (%), by Display Type 2024 & 2032
- Figure 43: Europe: Germany: France: Italy: United Kingdom Netherlands Rest of Europe Smartwatch Industry Revenue (Million), by Application 2024 & 2032
- Figure 44: Europe: Germany: France: Italy: United Kingdom Netherlands Rest of Europe Smartwatch Industry Volume (Million), by Application 2024 & 2032
- Figure 45: Europe: Germany: France: Italy: United Kingdom Netherlands Rest of Europe Smartwatch Industry Revenue Share (%), by Application 2024 & 2032
- Figure 46: Europe: Germany: France: Italy: United Kingdom Netherlands Rest of Europe Smartwatch Industry Volume Share (%), by Application 2024 & 2032
- Figure 47: Europe: Germany: France: Italy: United Kingdom Netherlands Rest of Europe Smartwatch Industry Revenue (Million), by Country 2024 & 2032
- Figure 48: Europe: Germany: France: Italy: United Kingdom Netherlands Rest of Europe Smartwatch Industry Volume (Million), by Country 2024 & 2032
- Figure 49: Europe: Germany: France: Italy: United Kingdom Netherlands Rest of Europe Smartwatch Industry Revenue Share (%), by Country 2024 & 2032
- Figure 50: Europe: Germany: France: Italy: United Kingdom Netherlands Rest of Europe Smartwatch Industry Volume Share (%), by Country 2024 & 2032
- Figure 51: Asia Pacific: China, Japan, India, South Korea, Taiwan, Australia, Rest of Asia-Pacific Smartwatch Industry Revenue (Million), by Operating System 2024 & 2032
- Figure 52: Asia Pacific: China, Japan, India, South Korea, Taiwan, Australia, Rest of Asia-Pacific Smartwatch Industry Volume (Million), by Operating System 2024 & 2032
- Figure 53: Asia Pacific: China, Japan, India, South Korea, Taiwan, Australia, Rest of Asia-Pacific Smartwatch Industry Revenue Share (%), by Operating System 2024 & 2032
- Figure 54: Asia Pacific: China, Japan, India, South Korea, Taiwan, Australia, Rest of Asia-Pacific Smartwatch Industry Volume Share (%), by Operating System 2024 & 2032
- Figure 55: Asia Pacific: China, Japan, India, South Korea, Taiwan, Australia, Rest of Asia-Pacific Smartwatch Industry Revenue (Million), by Display Type 2024 & 2032
- Figure 56: Asia Pacific: China, Japan, India, South Korea, Taiwan, Australia, Rest of Asia-Pacific Smartwatch Industry Volume (Million), by Display Type 2024 & 2032
- Figure 57: Asia Pacific: China, Japan, India, South Korea, Taiwan, Australia, Rest of Asia-Pacific Smartwatch Industry Revenue Share (%), by Display Type 2024 & 2032
- Figure 58: Asia Pacific: China, Japan, India, South Korea, Taiwan, Australia, Rest of Asia-Pacific Smartwatch Industry Volume Share (%), by Display Type 2024 & 2032
- Figure 59: Asia Pacific: China, Japan, India, South Korea, Taiwan, Australia, Rest of Asia-Pacific Smartwatch Industry Revenue (Million), by Application 2024 & 2032
- Figure 60: Asia Pacific: China, Japan, India, South Korea, Taiwan, Australia, Rest of Asia-Pacific Smartwatch Industry Volume (Million), by Application 2024 & 2032
- Figure 61: Asia Pacific: China, Japan, India, South Korea, Taiwan, Australia, Rest of Asia-Pacific Smartwatch Industry Revenue Share (%), by Application 2024 & 2032
- Figure 62: Asia Pacific: China, Japan, India, South Korea, Taiwan, Australia, Rest of Asia-Pacific Smartwatch Industry Volume Share (%), by Application 2024 & 2032
- Figure 63: Asia Pacific: China, Japan, India, South Korea, Taiwan, Australia, Rest of Asia-Pacific Smartwatch Industry Revenue (Million), by Country 2024 & 2032
- Figure 64: Asia Pacific: China, Japan, India, South Korea, Taiwan, Australia, Rest of Asia-Pacific Smartwatch Industry Volume (Million), by Country 2024 & 2032
- Figure 65: Asia Pacific: China, Japan, India, South Korea, Taiwan, Australia, Rest of Asia-Pacific Smartwatch Industry Revenue Share (%), by Country 2024 & 2032
- Figure 66: Asia Pacific: China, Japan, India, South Korea, Taiwan, Australia, Rest of Asia-Pacific Smartwatch Industry Volume Share (%), by Country 2024 & 2032
- Figure 67: South America : Brazil, Argentina, Rest of South America Smartwatch Industry Revenue (Million), by Operating System 2024 & 2032
- Figure 68: South America : Brazil, Argentina, Rest of South America Smartwatch Industry Volume (Million), by Operating System 2024 & 2032
- Figure 69: South America : Brazil, Argentina, Rest of South America Smartwatch Industry Revenue Share (%), by Operating System 2024 & 2032
- Figure 70: South America : Brazil, Argentina, Rest of South America Smartwatch Industry Volume Share (%), by Operating System 2024 & 2032
- Figure 71: South America : Brazil, Argentina, Rest of South America Smartwatch Industry Revenue (Million), by Display Type 2024 & 2032
- Figure 72: South America : Brazil, Argentina, Rest of South America Smartwatch Industry Volume (Million), by Display Type 2024 & 2032
- Figure 73: South America : Brazil, Argentina, Rest of South America Smartwatch Industry Revenue Share (%), by Display Type 2024 & 2032
- Figure 74: South America : Brazil, Argentina, Rest of South America Smartwatch Industry Volume Share (%), by Display Type 2024 & 2032
- Figure 75: South America : Brazil, Argentina, Rest of South America Smartwatch Industry Revenue (Million), by Application 2024 & 2032
- Figure 76: South America : Brazil, Argentina, Rest of South America Smartwatch Industry Volume (Million), by Application 2024 & 2032
- Figure 77: South America : Brazil, Argentina, Rest of South America Smartwatch Industry Revenue Share (%), by Application 2024 & 2032
- Figure 78: South America : Brazil, Argentina, Rest of South America Smartwatch Industry Volume Share (%), by Application 2024 & 2032
- Figure 79: South America : Brazil, Argentina, Rest of South America Smartwatch Industry Revenue (Million), by Country 2024 & 2032
- Figure 80: South America : Brazil, Argentina, Rest of South America Smartwatch Industry Volume (Million), by Country 2024 & 2032
- Figure 81: South America : Brazil, Argentina, Rest of South America Smartwatch Industry Revenue Share (%), by Country 2024 & 2032
- Figure 82: South America : Brazil, Argentina, Rest of South America Smartwatch Industry Volume Share (%), by Country 2024 & 2032
- Figure 83: MEA: Middle East, Africa Smartwatch Industry Revenue (Million), by Operating System 2024 & 2032
- Figure 84: MEA: Middle East, Africa Smartwatch Industry Volume (Million), by Operating System 2024 & 2032
- Figure 85: MEA: Middle East, Africa Smartwatch Industry Revenue Share (%), by Operating System 2024 & 2032
- Figure 86: MEA: Middle East, Africa Smartwatch Industry Volume Share (%), by Operating System 2024 & 2032
- Figure 87: MEA: Middle East, Africa Smartwatch Industry Revenue (Million), by Display Type 2024 & 2032
- Figure 88: MEA: Middle East, Africa Smartwatch Industry Volume (Million), by Display Type 2024 & 2032
- Figure 89: MEA: Middle East, Africa Smartwatch Industry Revenue Share (%), by Display Type 2024 & 2032
- Figure 90: MEA: Middle East, Africa Smartwatch Industry Volume Share (%), by Display Type 2024 & 2032
- Figure 91: MEA: Middle East, Africa Smartwatch Industry Revenue (Million), by Application 2024 & 2032
- Figure 92: MEA: Middle East, Africa Smartwatch Industry Volume (Million), by Application 2024 & 2032
- Figure 93: MEA: Middle East, Africa Smartwatch Industry Revenue Share (%), by Application 2024 & 2032
- Figure 94: MEA: Middle East, Africa Smartwatch Industry Volume Share (%), by Application 2024 & 2032
- Figure 95: MEA: Middle East, Africa Smartwatch Industry Revenue (Million), by Country 2024 & 2032
- Figure 96: MEA: Middle East, Africa Smartwatch Industry Volume (Million), by Country 2024 & 2032
- Figure 97: MEA: Middle East, Africa Smartwatch Industry Revenue Share (%), by Country 2024 & 2032
- Figure 98: MEA: Middle East, Africa Smartwatch Industry Volume Share (%), by Country 2024 & 2032
List of Tables
- Table 1: Global Smartwatch Industry Revenue Million Forecast, by Region 2019 & 2032
- Table 2: Global Smartwatch Industry Volume Million Forecast, by Region 2019 & 2032
- Table 3: Global Smartwatch Industry Revenue Million Forecast, by Operating System 2019 & 2032
- Table 4: Global Smartwatch Industry Volume Million Forecast, by Operating System 2019 & 2032
- Table 5: Global Smartwatch Industry Revenue Million Forecast, by Display Type 2019 & 2032
- Table 6: Global Smartwatch Industry Volume Million Forecast, by Display Type 2019 & 2032
- Table 7: Global Smartwatch Industry Revenue Million Forecast, by Application 2019 & 2032
- Table 8: Global Smartwatch Industry Volume Million Forecast, by Application 2019 & 2032
- Table 9: Global Smartwatch Industry Revenue Million Forecast, by Region 2019 & 2032
- Table 10: Global Smartwatch Industry Volume Million Forecast, by Region 2019 & 2032
- Table 11: Global Smartwatch Industry Revenue Million Forecast, by Country 2019 & 2032
- Table 12: Global Smartwatch Industry Volume Million Forecast, by Country 2019 & 2032
- Table 13: Smartwatch Industry Revenue (Million) Forecast, by Application 2019 & 2032
- Table 14: Smartwatch Industry Volume (Million) Forecast, by Application 2019 & 2032
- Table 15: Global Smartwatch Industry Revenue Million Forecast, by Country 2019 & 2032
- Table 16: Global Smartwatch Industry Volume Million Forecast, by Country 2019 & 2032
- Table 17: Smartwatch Industry Revenue (Million) Forecast, by Application 2019 & 2032
- Table 18: Smartwatch Industry Volume (Million) Forecast, by Application 2019 & 2032
- Table 19: Global Smartwatch Industry Revenue Million Forecast, by Country 2019 & 2032
- Table 20: Global Smartwatch Industry Volume Million Forecast, by Country 2019 & 2032
- Table 21: Smartwatch Industry Revenue (Million) Forecast, by Application 2019 & 2032
- Table 22: Smartwatch Industry Volume (Million) Forecast, by Application 2019 & 2032
- Table 23: Global Smartwatch Industry Revenue Million Forecast, by Country 2019 & 2032
- Table 24: Global Smartwatch Industry Volume Million Forecast, by Country 2019 & 2032
- Table 25: Smartwatch Industry Revenue (Million) Forecast, by Application 2019 & 2032
- Table 26: Smartwatch Industry Volume (Million) Forecast, by Application 2019 & 2032
- Table 27: Global Smartwatch Industry Revenue Million Forecast, by Operating System 2019 & 2032
- Table 28: Global Smartwatch Industry Volume Million Forecast, by Operating System 2019 & 2032
- Table 29: Global Smartwatch Industry Revenue Million Forecast, by Display Type 2019 & 2032
- Table 30: Global Smartwatch Industry Volume Million Forecast, by Display Type 2019 & 2032
- Table 31: Global Smartwatch Industry Revenue Million Forecast, by Application 2019 & 2032
- Table 32: Global Smartwatch Industry Volume Million Forecast, by Application 2019 & 2032
- Table 33: Global Smartwatch Industry Revenue Million Forecast, by Country 2019 & 2032
- Table 34: Global Smartwatch Industry Volume Million Forecast, by Country 2019 & 2032
- Table 35: Global Smartwatch Industry Revenue Million Forecast, by Operating System 2019 & 2032
- Table 36: Global Smartwatch Industry Volume Million Forecast, by Operating System 2019 & 2032
- Table 37: Global Smartwatch Industry Revenue Million Forecast, by Display Type 2019 & 2032
- Table 38: Global Smartwatch Industry Volume Million Forecast, by Display Type 2019 & 2032
- Table 39: Global Smartwatch Industry Revenue Million Forecast, by Application 2019 & 2032
- Table 40: Global Smartwatch Industry Volume Million Forecast, by Application 2019 & 2032
- Table 41: Global Smartwatch Industry Revenue Million Forecast, by Country 2019 & 2032
- Table 42: Global Smartwatch Industry Volume Million Forecast, by Country 2019 & 2032
- Table 43: Global Smartwatch Industry Revenue Million Forecast, by Operating System 2019 & 2032
- Table 44: Global Smartwatch Industry Volume Million Forecast, by Operating System 2019 & 2032
- Table 45: Global Smartwatch Industry Revenue Million Forecast, by Display Type 2019 & 2032
- Table 46: Global Smartwatch Industry Volume Million Forecast, by Display Type 2019 & 2032
- Table 47: Global Smartwatch Industry Revenue Million Forecast, by Application 2019 & 2032
- Table 48: Global Smartwatch Industry Volume Million Forecast, by Application 2019 & 2032
- Table 49: Global Smartwatch Industry Revenue Million Forecast, by Country 2019 & 2032
- Table 50: Global Smartwatch Industry Volume Million Forecast, by Country 2019 & 2032
- Table 51: Global Smartwatch Industry Revenue Million Forecast, by Operating System 2019 & 2032
- Table 52: Global Smartwatch Industry Volume Million Forecast, by Operating System 2019 & 2032
- Table 53: Global Smartwatch Industry Revenue Million Forecast, by Display Type 2019 & 2032
- Table 54: Global Smartwatch Industry Volume Million Forecast, by Display Type 2019 & 2032
- Table 55: Global Smartwatch Industry Revenue Million Forecast, by Application 2019 & 2032
- Table 56: Global Smartwatch Industry Volume Million Forecast, by Application 2019 & 2032
- Table 57: Global Smartwatch Industry Revenue Million Forecast, by Country 2019 & 2032
- Table 58: Global Smartwatch Industry Volume Million Forecast, by Country 2019 & 2032
- Table 59: Global Smartwatch Industry Revenue Million Forecast, by Operating System 2019 & 2032
- Table 60: Global Smartwatch Industry Volume Million Forecast, by Operating System 2019 & 2032
- Table 61: Global Smartwatch Industry Revenue Million Forecast, by Display Type 2019 & 2032
- Table 62: Global Smartwatch Industry Volume Million Forecast, by Display Type 2019 & 2032
- Table 63: Global Smartwatch Industry Revenue Million Forecast, by Application 2019 & 2032
- Table 64: Global Smartwatch Industry Volume Million Forecast, by Application 2019 & 2032
- Table 65: Global Smartwatch Industry Revenue Million Forecast, by Country 2019 & 2032
- Table 66: Global Smartwatch Industry Volume Million Forecast, by Country 2019 & 2032
Frequently Asked Questions
1. What is the projected Compound Annual Growth Rate (CAGR) of the Smartwatch Industry?
The projected CAGR is approximately 27.78%.
2. Which companies are prominent players in the Smartwatch Industry?
Key companies in the market include Polar Electro Oy, LG Electronics Inc, Lenovo Group Limited, Casio Computer Co Ltd, Zepp Health Corporation, Samsung Electronics Co Ltd, Garmin Ltd, Fitbit Inc, Huawei Technologies Co Ltd, Fossil Group Inc, Apple Inc, Sony Corporation.
3. What are the main segments of the Smartwatch Industry?
The market segments include Operating System, Display Type, Application.
4. Can you provide details about the market size?
The market size is estimated to be USD XX Million as of 2022.
5. What are some drivers contributing to market growth?
Increasing Technological Advancements in the Wearables Market; Increasing Health Awareness among the Consumers.
6. What are the notable trends driving market growth?
Sports Segment to Account for Significant Market Share.
7. Are there any restraints impacting market growth?
Growing Complexity of Wearable Devices. Limited Use of Features. and Security Risks.
8. Can you provide examples of recent developments in the market?
June 2022 - Apple previewed watch OS 9, which brings the latest features and improved experiences to the wearable operating system. Apple Watch users can now have more watch faces to choose from, with richer complications that offer more information and opportunity for personalization. In the updated Workout app, advanced metrics, views, and training experiences inspired by high-performing athletes help users take their workouts to the next level.
9. What pricing options are available for accessing the report?
Pricing options include single-user, multi-user, and enterprise licenses priced at USD 3800, USD 4500, and USD 5800 respectively.
10. Is the market size provided in terms of value or volume?
The market size is provided in terms of value, measured in Million and volume, measured in Million.
11. Are there any specific market keywords associated with the report?
Yes, the market keyword associated with the report is "Smartwatch Industry," which aids in identifying and referencing the specific market segment covered.
12. How do I determine which pricing option suits my needs best?
The pricing options vary based on user requirements and access needs. Individual users may opt for single-user licenses, while businesses requiring broader access may choose multi-user or enterprise licenses for cost-effective access to the report.
13. Are there any additional resources or data provided in the Smartwatch Industry report?
While the report offers comprehensive insights, it's advisable to review the specific contents or supplementary materials provided to ascertain if additional resources or data are available.
14. How can I stay updated on further developments or reports in the Smartwatch Industry?
To stay informed about further developments, trends, and reports in the Smartwatch Industry, consider subscribing to industry newsletters, following relevant companies and organizations, or regularly checking reputable industry news sources and publications.
Methodology
Step 1 - Identification of Relevant Samples Size from Population Database


Step 2 - Approaches for Defining Global Market Size (Value, Volume* & Price*)

Note*: In applicable scenarios
Step 3 - Data Sources
Primary Research
- Web Analytics
- Survey Reports
- Research Institute
- Latest Research Reports
- Opinion Leaders
Secondary Research
- Annual Reports
- White Paper
- Latest Press Release
- Industry Association
- Paid Database
- Investor Presentations

Step 4 - Data Triangulation
Involves using different sources of information in order to increase the validity of a study
These sources are likely to be stakeholders in a program - participants, other researchers, program staff, other community members, and so on.
Then we put all data in single framework & apply various statistical tools to find out the dynamic on the market.
During the analysis stage, feedback from the stakeholder groups would be compared to determine areas of agreement as well as areas of divergence


