
Key Insights
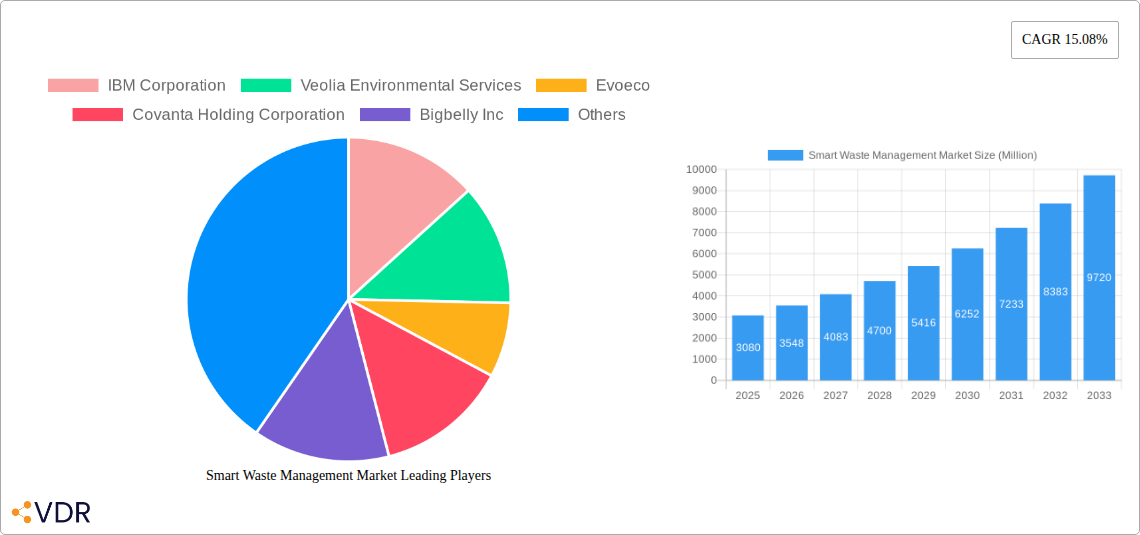
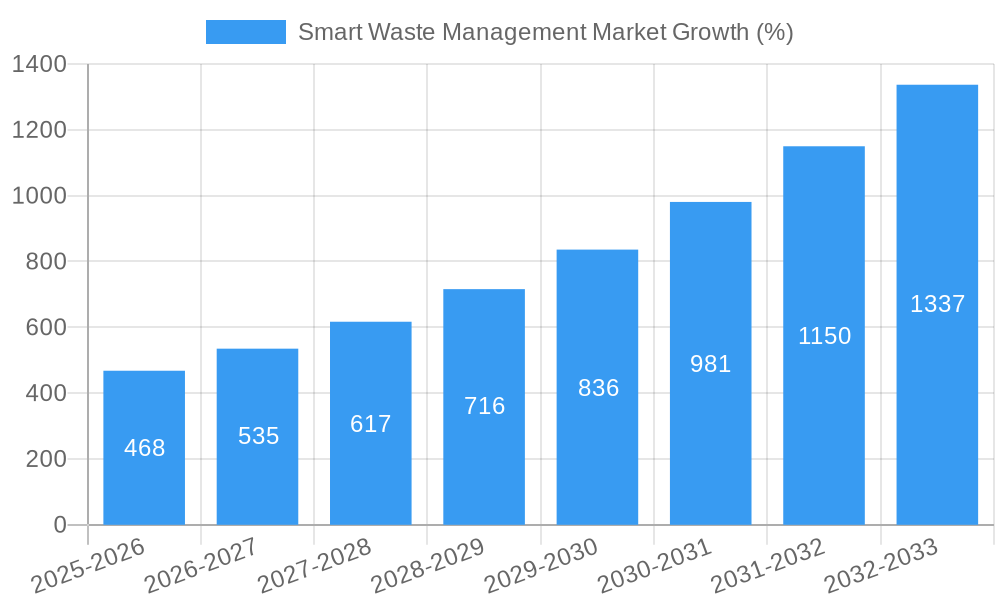
The global smart waste management market is experiencing robust growth, projected to reach $3.08 billion in 2025 and maintain a Compound Annual Growth Rate (CAGR) of 15.08% from 2025 to 2033. This expansion is driven by increasing urbanization leading to escalating waste generation, coupled with growing environmental concerns and stringent government regulations promoting sustainable waste management practices. Smart solutions, including fleet management systems, remote monitoring technologies, and advanced analytics, offer significant efficiency gains, cost reductions, and improved environmental outcomes. The market is segmented by waste type (industrial and residential) and solution type (fleet management, remote monitoring, analytics). Industrial waste management currently holds a larger market share due to higher volumes and the need for optimized logistics and resource allocation. However, the residential waste segment is projected to experience faster growth due to increasing adoption of smart bins and improved waste collection strategies in residential areas. The integration of IoT sensors, AI-powered analytics, and cloud computing is transforming traditional waste management practices, enabling real-time monitoring of waste levels, optimized routing for collection vehicles, and predictive maintenance for equipment.
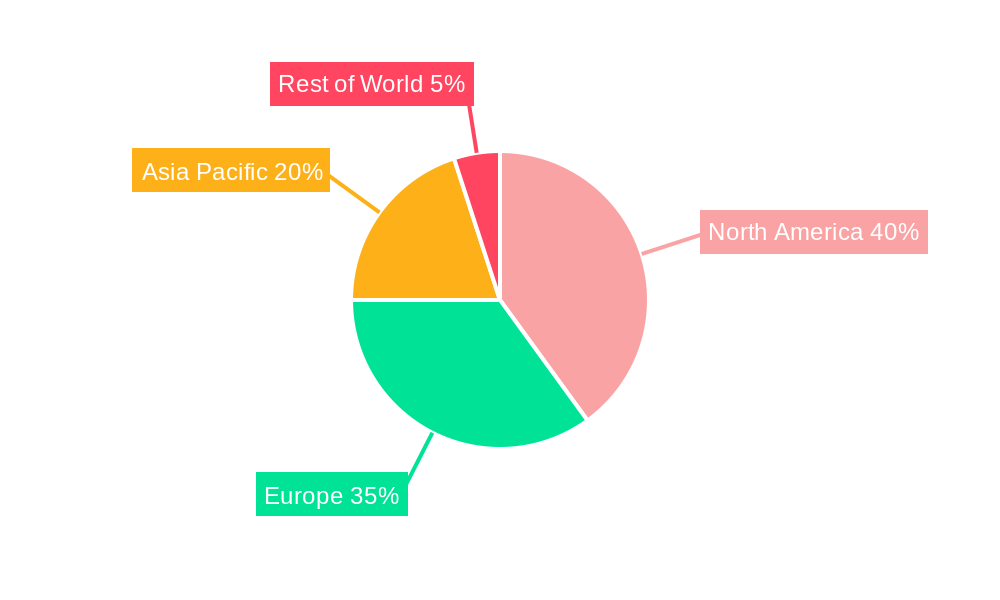
North America and Europe currently dominate the market, with high levels of technological adoption and robust infrastructure. However, the Asia-Pacific region is poised for significant growth, fueled by rapid urbanization, rising disposable incomes, and increasing awareness of environmental sustainability. Key players in the market, such as IBM, Veolia, and Waste Management, are investing heavily in research and development to enhance their offerings and expand their market reach. Competitive strategies include mergers and acquisitions, strategic partnerships, and the development of innovative technologies. While challenges remain, including high initial investment costs and the need for robust data security measures, the long-term outlook for the smart waste management market remains exceptionally positive, driven by the increasing need for efficient, sustainable, and cost-effective waste management solutions globally.
Smart Waste Management Market: A Comprehensive Report (2019-2033)
This in-depth report provides a comprehensive analysis of the Smart Waste Management Market, encompassing market dynamics, growth trends, regional dominance, product landscape, key players, and future outlook. The study period covers 2019-2033, with 2025 as the base and estimated year. The report segments the market by waste type (Industrial Waste, Residential Waste) and solution (Fleet Management, Remote Monitoring, Analytics), offering granular insights for informed decision-making. The market is expected to reach xx Million units by 2033.
Smart Waste Management Market Dynamics & Structure
The Smart Waste Management Market is characterized by moderate concentration, with key players like IBM Corporation, Veolia Environmental Services, and Waste Management Inc. holding significant market share. However, the market exhibits a dynamic landscape due to continuous technological innovation, evolving regulatory frameworks, and increasing adoption of smart solutions across various sectors. The market is witnessing a rise in mergers and acquisitions (M&A) activity, with an estimated xx deals closed in the last five years.
- Market Concentration: Moderately concentrated, with top 5 players holding approximately xx% market share (2024).
- Technological Innovation: Significant advancements in sensor technology, IoT, AI, and data analytics are driving market growth. However, interoperability challenges and high initial investment costs remain barriers.
- Regulatory Frameworks: Stringent environmental regulations and government initiatives promoting sustainable waste management are key drivers. Variations in regulations across regions create complexities for market players.
- Competitive Product Substitutes: Traditional waste management methods pose a competitive challenge, but the increasing focus on efficiency and sustainability is favoring smart solutions.
- End-User Demographics: Municipal corporations, industrial facilities, and commercial entities are the primary end-users, with growing adoption in developing economies.
- M&A Trends: Increased M&A activity reflects consolidation and expansion strategies among key players.
Smart Waste Management Market Growth Trends & Insights
The Smart Waste Management Market has experienced substantial growth over the past few years, driven by increasing urbanization, rising environmental concerns, and the need for efficient waste management solutions. The market size grew from xx Million units in 2019 to xx Million units in 2024, registering a CAGR of xx%. This growth is expected to continue, with a projected CAGR of xx% during the forecast period (2025-2033), reaching xx Million units by 2033. Market penetration remains relatively low, particularly in emerging markets, indicating significant growth potential. Technological advancements, such as AI-powered waste optimization and predictive analytics, are further accelerating market adoption. Consumer behavior is shifting towards eco-friendly practices, further fueling demand for smart waste solutions.
Dominant Regions, Countries, or Segments in Smart Waste Management Market
North America currently dominates the Smart Waste Management Market, driven by strong government support for smart city initiatives and high adoption rates in developed economies. Europe follows closely, with significant investments in smart waste management infrastructure. Within the segment breakdown:
By Waste Type: Industrial waste management currently holds a larger market share than residential waste due to higher volumes and stricter regulations. However, the residential waste segment is witnessing faster growth due to increasing awareness about environmental sustainability.
By Solution: Remote monitoring solutions currently dominate due to their cost-effectiveness and ease of implementation. However, the analytics segment is experiencing rapid growth due to its ability to optimize waste collection routes and improve efficiency.
Key Drivers (North America): Strong regulatory framework, advanced technological infrastructure, high environmental awareness.
Key Drivers (Europe): Government funding for smart city projects, focus on circular economy principles.
Growth Potential: Emerging markets in Asia-Pacific and Latin America present significant growth opportunities.
Smart Waste Management Market Product Landscape
The Smart Waste Management Market offers a diverse range of products, including smart bins with sensors for waste level monitoring, GPS-enabled waste collection vehicles, and advanced data analytics platforms for route optimization and predictive maintenance. These solutions incorporate IoT, AI, and cloud computing technologies to enhance efficiency, reduce operational costs, and improve environmental sustainability. Unique selling propositions include real-time monitoring, automated alerts, and data-driven insights for informed decision-making. Technological advancements focus on enhancing sensor accuracy, improving data analytics capabilities, and integrating with existing waste management infrastructure.
Key Drivers, Barriers & Challenges in Smart Waste Management Market
Key Drivers:
- Increasing urbanization and rising waste generation.
- Growing environmental awareness and stricter regulations.
- Technological advancements in IoT, AI, and data analytics.
- Government initiatives promoting smart city development.
Challenges & Restraints:
- High initial investment costs for smart waste management systems.
- Interoperability issues between different systems and platforms.
- Data security and privacy concerns related to the collection and use of sensitive data.
- Lack of awareness and technical expertise in some regions. This results in a xx% lower adoption rate in developing nations compared to developed nations.
Emerging Opportunities in Smart Waste Management Market
Untapped markets in developing economies present significant opportunities for growth. The integration of smart waste management systems with other smart city initiatives, such as traffic management and energy optimization, is a key emerging trend. The development of innovative applications, such as waste-to-energy solutions and improved recycling processes, offers further growth potential. Evolving consumer preferences towards environmentally friendly waste disposal practices fuel demand for smart waste solutions.
Growth Accelerators in the Smart Waste Management Market Industry
Technological breakthroughs in sensor technology, AI, and data analytics are driving market growth. Strategic partnerships between technology providers and waste management companies are accelerating innovation and market penetration. Market expansion strategies focusing on emerging markets and underserved regions are key drivers of long-term growth.
Key Players Shaping the Smart Waste Management Market Market
- IBM Corporation
- Veolia Environmental Services
- Evoeco
- Covanta Holding Corporation
- Bigbelly Inc
- Waste Management Inc
- Enevo
- Pepperl+Fuchs GmbH
- BIN-
- SAP SE
Notable Milestones in Smart Waste Management Market Sector
- July 2023: WM opened a USD 35 million renewable natural gas plant, enhancing its waste-to-energy capabilities.
- June 2023: The Indian government launched CITIIS 2.0, promoting blended waste management in 18 cities.
In-Depth Smart Waste Management Market Market Outlook
The Smart Waste Management Market is poised for significant growth in the coming years, driven by technological advancements, increasing environmental awareness, and supportive government policies. Strategic partnerships and market expansion initiatives will further accelerate growth. The market offers lucrative opportunities for companies that can leverage technological innovation, deliver cost-effective solutions, and address the challenges associated with data security and interoperability. Focus on sustainable practices and circular economy principles will be key differentiators in the future.
Smart Waste Management Market Segmentation
-
1. Solution
- 1.1. Fleet Management
- 1.2. Remote Monitoring
- 1.3. Analytics
-
2. Waste Type
- 2.1. Industrial Waste
- 2.2. Residential Waste
Smart Waste Management Market Segmentation By Geography
-
1. North America
- 1.1. United States
- 1.2. Canada
-
2. Europe
- 2.1. Germany
- 2.2. United Kingdom
- 2.3. France
- 2.4. Spain
- 2.5. Italy
-
3. Asia
- 3.1. India
- 3.2. China
- 3.3. Australia
- 3.4. Japan
- 3.5. Australia and New Zealand
- 4. Latin America
- 5. Middle East and Africa
Smart Waste Management Market REPORT HIGHLIGHTS
| Aspects | Details |
|---|---|
| Study Period | 2019-2033 |
| Base Year | 2024 |
| Estimated Year | 2025 |
| Forecast Period | 2025-2033 |
| Historical Period | 2019-2024 |
| Growth Rate | CAGR of 15.08% from 2019-2033 |
| Segmentation |
|
Table of Contents
- 1. Introduction
- 1.1. Research Scope
- 1.2. Market Segmentation
- 1.3. Research Methodology
- 1.4. Definitions and Assumptions
- 2. Executive Summary
- 2.1. Introduction
- 3. Market Dynamics
- 3.1. Introduction
- 3.2. Market Drivers
- 3.2.1. Increasing Volumes of Waste to Boost the Market; Rising Adoption of Smart Cities to Flourish the Market
- 3.3. Market Restrains
- 3.3.1. Cybersecurity Concerns and Data Security Breaches
- 3.4. Market Trends
- 3.4.1. Analytics Sector to Witness Major Growth
- 4. Market Factor Analysis
- 4.1. Porters Five Forces
- 4.2. Supply/Value Chain
- 4.3. PESTEL analysis
- 4.4. Market Entropy
- 4.5. Patent/Trademark Analysis
- 5. Global Smart Waste Management Market Analysis, Insights and Forecast, 2019-2031
- 5.1. Market Analysis, Insights and Forecast - by Solution
- 5.1.1. Fleet Management
- 5.1.2. Remote Monitoring
- 5.1.3. Analytics
- 5.2. Market Analysis, Insights and Forecast - by Waste Type
- 5.2.1. Industrial Waste
- 5.2.2. Residential Waste
- 5.3. Market Analysis, Insights and Forecast - by Region
- 5.3.1. North America
- 5.3.2. Europe
- 5.3.3. Asia
- 5.3.4. Latin America
- 5.3.5. Middle East and Africa
- 5.1. Market Analysis, Insights and Forecast - by Solution
- 6. North America Smart Waste Management Market Analysis, Insights and Forecast, 2019-2031
- 6.1. Market Analysis, Insights and Forecast - by Solution
- 6.1.1. Fleet Management
- 6.1.2. Remote Monitoring
- 6.1.3. Analytics
- 6.2. Market Analysis, Insights and Forecast - by Waste Type
- 6.2.1. Industrial Waste
- 6.2.2. Residential Waste
- 6.1. Market Analysis, Insights and Forecast - by Solution
- 7. Europe Smart Waste Management Market Analysis, Insights and Forecast, 2019-2031
- 7.1. Market Analysis, Insights and Forecast - by Solution
- 7.1.1. Fleet Management
- 7.1.2. Remote Monitoring
- 7.1.3. Analytics
- 7.2. Market Analysis, Insights and Forecast - by Waste Type
- 7.2.1. Industrial Waste
- 7.2.2. Residential Waste
- 7.1. Market Analysis, Insights and Forecast - by Solution
- 8. Asia Smart Waste Management Market Analysis, Insights and Forecast, 2019-2031
- 8.1. Market Analysis, Insights and Forecast - by Solution
- 8.1.1. Fleet Management
- 8.1.2. Remote Monitoring
- 8.1.3. Analytics
- 8.2. Market Analysis, Insights and Forecast - by Waste Type
- 8.2.1. Industrial Waste
- 8.2.2. Residential Waste
- 8.1. Market Analysis, Insights and Forecast - by Solution
- 9. Latin America Smart Waste Management Market Analysis, Insights and Forecast, 2019-2031
- 9.1. Market Analysis, Insights and Forecast - by Solution
- 9.1.1. Fleet Management
- 9.1.2. Remote Monitoring
- 9.1.3. Analytics
- 9.2. Market Analysis, Insights and Forecast - by Waste Type
- 9.2.1. Industrial Waste
- 9.2.2. Residential Waste
- 9.1. Market Analysis, Insights and Forecast - by Solution
- 10. Middle East and Africa Smart Waste Management Market Analysis, Insights and Forecast, 2019-2031
- 10.1. Market Analysis, Insights and Forecast - by Solution
- 10.1.1. Fleet Management
- 10.1.2. Remote Monitoring
- 10.1.3. Analytics
- 10.2. Market Analysis, Insights and Forecast - by Waste Type
- 10.2.1. Industrial Waste
- 10.2.2. Residential Waste
- 10.1. Market Analysis, Insights and Forecast - by Solution
- 11. North America Smart Waste Management Market Analysis, Insights and Forecast, 2019-2031
- 11.1. Market Analysis, Insights and Forecast - By Country/Sub-region
- 11.1.1 United States
- 11.1.2 Canada
- 12. Europe Smart Waste Management Market Analysis, Insights and Forecast, 2019-2031
- 12.1. Market Analysis, Insights and Forecast - By Country/Sub-region
- 12.1.1 Germany
- 12.1.2 United Kingdom
- 12.1.3 France
- 12.1.4 Spain
- 12.1.5 Italy
- 12.1.6 Rest of Europe
- 13. Asia Pacific Smart Waste Management Market Analysis, Insights and Forecast, 2019-2031
- 13.1. Market Analysis, Insights and Forecast - By Country/Sub-region
- 13.1.1 India
- 13.1.2 China
- 13.1.3 Australia
- 13.1.4 Japan
- 13.1.5 Rest of Asia Pacific
- 14. Rest of the World Smart Waste Management Market Analysis, Insights and Forecast, 2019-2031
- 14.1. Market Analysis, Insights and Forecast - By Country/Sub-region
- 14.1.1.
- 15. Competitive Analysis
- 15.1. Global Market Share Analysis 2024
- 15.2. Company Profiles
- 15.2.1 IBM Corporation
- 15.2.1.1. Overview
- 15.2.1.2. Products
- 15.2.1.3. SWOT Analysis
- 15.2.1.4. Recent Developments
- 15.2.1.5. Financials (Based on Availability)
- 15.2.2 Veolia Environmental Services
- 15.2.2.1. Overview
- 15.2.2.2. Products
- 15.2.2.3. SWOT Analysis
- 15.2.2.4. Recent Developments
- 15.2.2.5. Financials (Based on Availability)
- 15.2.3 Evoeco
- 15.2.3.1. Overview
- 15.2.3.2. Products
- 15.2.3.3. SWOT Analysis
- 15.2.3.4. Recent Developments
- 15.2.3.5. Financials (Based on Availability)
- 15.2.4 Covanta Holding Corporation
- 15.2.4.1. Overview
- 15.2.4.2. Products
- 15.2.4.3. SWOT Analysis
- 15.2.4.4. Recent Developments
- 15.2.4.5. Financials (Based on Availability)
- 15.2.5 Bigbelly Inc
- 15.2.5.1. Overview
- 15.2.5.2. Products
- 15.2.5.3. SWOT Analysis
- 15.2.5.4. Recent Developments
- 15.2.5.5. Financials (Based on Availability)
- 15.2.6 Waste Management Inc
- 15.2.6.1. Overview
- 15.2.6.2. Products
- 15.2.6.3. SWOT Analysis
- 15.2.6.4. Recent Developments
- 15.2.6.5. Financials (Based on Availability)
- 15.2.7 Enevo
- 15.2.7.1. Overview
- 15.2.7.2. Products
- 15.2.7.3. SWOT Analysis
- 15.2.7.4. Recent Developments
- 15.2.7.5. Financials (Based on Availability)
- 15.2.8 Pepperl+Fuchs GmbH
- 15.2.8.1. Overview
- 15.2.8.2. Products
- 15.2.8.3. SWOT Analysis
- 15.2.8.4. Recent Developments
- 15.2.8.5. Financials (Based on Availability)
- 15.2.9 BIN-
- 15.2.9.1. Overview
- 15.2.9.2. Products
- 15.2.9.3. SWOT Analysis
- 15.2.9.4. Recent Developments
- 15.2.9.5. Financials (Based on Availability)
- 15.2.10 SAP SE
- 15.2.10.1. Overview
- 15.2.10.2. Products
- 15.2.10.3. SWOT Analysis
- 15.2.10.4. Recent Developments
- 15.2.10.5. Financials (Based on Availability)
- 15.2.1 IBM Corporation
List of Figures
- Figure 1: Global Smart Waste Management Market Revenue Breakdown (Million, %) by Region 2024 & 2032
- Figure 2: North America Smart Waste Management Market Revenue (Million), by Country 2024 & 2032
- Figure 3: North America Smart Waste Management Market Revenue Share (%), by Country 2024 & 2032
- Figure 4: Europe Smart Waste Management Market Revenue (Million), by Country 2024 & 2032
- Figure 5: Europe Smart Waste Management Market Revenue Share (%), by Country 2024 & 2032
- Figure 6: Asia Pacific Smart Waste Management Market Revenue (Million), by Country 2024 & 2032
- Figure 7: Asia Pacific Smart Waste Management Market Revenue Share (%), by Country 2024 & 2032
- Figure 8: Rest of the World Smart Waste Management Market Revenue (Million), by Country 2024 & 2032
- Figure 9: Rest of the World Smart Waste Management Market Revenue Share (%), by Country 2024 & 2032
- Figure 10: North America Smart Waste Management Market Revenue (Million), by Solution 2024 & 2032
- Figure 11: North America Smart Waste Management Market Revenue Share (%), by Solution 2024 & 2032
- Figure 12: North America Smart Waste Management Market Revenue (Million), by Waste Type 2024 & 2032
- Figure 13: North America Smart Waste Management Market Revenue Share (%), by Waste Type 2024 & 2032
- Figure 14: North America Smart Waste Management Market Revenue (Million), by Country 2024 & 2032
- Figure 15: North America Smart Waste Management Market Revenue Share (%), by Country 2024 & 2032
- Figure 16: Europe Smart Waste Management Market Revenue (Million), by Solution 2024 & 2032
- Figure 17: Europe Smart Waste Management Market Revenue Share (%), by Solution 2024 & 2032
- Figure 18: Europe Smart Waste Management Market Revenue (Million), by Waste Type 2024 & 2032
- Figure 19: Europe Smart Waste Management Market Revenue Share (%), by Waste Type 2024 & 2032
- Figure 20: Europe Smart Waste Management Market Revenue (Million), by Country 2024 & 2032
- Figure 21: Europe Smart Waste Management Market Revenue Share (%), by Country 2024 & 2032
- Figure 22: Asia Smart Waste Management Market Revenue (Million), by Solution 2024 & 2032
- Figure 23: Asia Smart Waste Management Market Revenue Share (%), by Solution 2024 & 2032
- Figure 24: Asia Smart Waste Management Market Revenue (Million), by Waste Type 2024 & 2032
- Figure 25: Asia Smart Waste Management Market Revenue Share (%), by Waste Type 2024 & 2032
- Figure 26: Asia Smart Waste Management Market Revenue (Million), by Country 2024 & 2032
- Figure 27: Asia Smart Waste Management Market Revenue Share (%), by Country 2024 & 2032
- Figure 28: Latin America Smart Waste Management Market Revenue (Million), by Solution 2024 & 2032
- Figure 29: Latin America Smart Waste Management Market Revenue Share (%), by Solution 2024 & 2032
- Figure 30: Latin America Smart Waste Management Market Revenue (Million), by Waste Type 2024 & 2032
- Figure 31: Latin America Smart Waste Management Market Revenue Share (%), by Waste Type 2024 & 2032
- Figure 32: Latin America Smart Waste Management Market Revenue (Million), by Country 2024 & 2032
- Figure 33: Latin America Smart Waste Management Market Revenue Share (%), by Country 2024 & 2032
- Figure 34: Middle East and Africa Smart Waste Management Market Revenue (Million), by Solution 2024 & 2032
- Figure 35: Middle East and Africa Smart Waste Management Market Revenue Share (%), by Solution 2024 & 2032
- Figure 36: Middle East and Africa Smart Waste Management Market Revenue (Million), by Waste Type 2024 & 2032
- Figure 37: Middle East and Africa Smart Waste Management Market Revenue Share (%), by Waste Type 2024 & 2032
- Figure 38: Middle East and Africa Smart Waste Management Market Revenue (Million), by Country 2024 & 2032
- Figure 39: Middle East and Africa Smart Waste Management Market Revenue Share (%), by Country 2024 & 2032
List of Tables
- Table 1: Global Smart Waste Management Market Revenue Million Forecast, by Region 2019 & 2032
- Table 2: Global Smart Waste Management Market Revenue Million Forecast, by Solution 2019 & 2032
- Table 3: Global Smart Waste Management Market Revenue Million Forecast, by Waste Type 2019 & 2032
- Table 4: Global Smart Waste Management Market Revenue Million Forecast, by Region 2019 & 2032
- Table 5: Global Smart Waste Management Market Revenue Million Forecast, by Country 2019 & 2032
- Table 6: United States Smart Waste Management Market Revenue (Million) Forecast, by Application 2019 & 2032
- Table 7: Canada Smart Waste Management Market Revenue (Million) Forecast, by Application 2019 & 2032
- Table 8: Global Smart Waste Management Market Revenue Million Forecast, by Country 2019 & 2032
- Table 9: Germany Smart Waste Management Market Revenue (Million) Forecast, by Application 2019 & 2032
- Table 10: United Kingdom Smart Waste Management Market Revenue (Million) Forecast, by Application 2019 & 2032
- Table 11: France Smart Waste Management Market Revenue (Million) Forecast, by Application 2019 & 2032
- Table 12: Spain Smart Waste Management Market Revenue (Million) Forecast, by Application 2019 & 2032
- Table 13: Italy Smart Waste Management Market Revenue (Million) Forecast, by Application 2019 & 2032
- Table 14: Rest of Europe Smart Waste Management Market Revenue (Million) Forecast, by Application 2019 & 2032
- Table 15: Global Smart Waste Management Market Revenue Million Forecast, by Country 2019 & 2032
- Table 16: India Smart Waste Management Market Revenue (Million) Forecast, by Application 2019 & 2032
- Table 17: China Smart Waste Management Market Revenue (Million) Forecast, by Application 2019 & 2032
- Table 18: Australia Smart Waste Management Market Revenue (Million) Forecast, by Application 2019 & 2032
- Table 19: Japan Smart Waste Management Market Revenue (Million) Forecast, by Application 2019 & 2032
- Table 20: Rest of Asia Pacific Smart Waste Management Market Revenue (Million) Forecast, by Application 2019 & 2032
- Table 21: Global Smart Waste Management Market Revenue Million Forecast, by Country 2019 & 2032
- Table 22: Smart Waste Management Market Revenue (Million) Forecast, by Application 2019 & 2032
- Table 23: Global Smart Waste Management Market Revenue Million Forecast, by Solution 2019 & 2032
- Table 24: Global Smart Waste Management Market Revenue Million Forecast, by Waste Type 2019 & 2032
- Table 25: Global Smart Waste Management Market Revenue Million Forecast, by Country 2019 & 2032
- Table 26: United States Smart Waste Management Market Revenue (Million) Forecast, by Application 2019 & 2032
- Table 27: Canada Smart Waste Management Market Revenue (Million) Forecast, by Application 2019 & 2032
- Table 28: Global Smart Waste Management Market Revenue Million Forecast, by Solution 2019 & 2032
- Table 29: Global Smart Waste Management Market Revenue Million Forecast, by Waste Type 2019 & 2032
- Table 30: Global Smart Waste Management Market Revenue Million Forecast, by Country 2019 & 2032
- Table 31: Germany Smart Waste Management Market Revenue (Million) Forecast, by Application 2019 & 2032
- Table 32: United Kingdom Smart Waste Management Market Revenue (Million) Forecast, by Application 2019 & 2032
- Table 33: France Smart Waste Management Market Revenue (Million) Forecast, by Application 2019 & 2032
- Table 34: Spain Smart Waste Management Market Revenue (Million) Forecast, by Application 2019 & 2032
- Table 35: Italy Smart Waste Management Market Revenue (Million) Forecast, by Application 2019 & 2032
- Table 36: Global Smart Waste Management Market Revenue Million Forecast, by Solution 2019 & 2032
- Table 37: Global Smart Waste Management Market Revenue Million Forecast, by Waste Type 2019 & 2032
- Table 38: Global Smart Waste Management Market Revenue Million Forecast, by Country 2019 & 2032
- Table 39: India Smart Waste Management Market Revenue (Million) Forecast, by Application 2019 & 2032
- Table 40: China Smart Waste Management Market Revenue (Million) Forecast, by Application 2019 & 2032
- Table 41: Australia Smart Waste Management Market Revenue (Million) Forecast, by Application 2019 & 2032
- Table 42: Japan Smart Waste Management Market Revenue (Million) Forecast, by Application 2019 & 2032
- Table 43: Australia and New Zealand Smart Waste Management Market Revenue (Million) Forecast, by Application 2019 & 2032
- Table 44: Global Smart Waste Management Market Revenue Million Forecast, by Solution 2019 & 2032
- Table 45: Global Smart Waste Management Market Revenue Million Forecast, by Waste Type 2019 & 2032
- Table 46: Global Smart Waste Management Market Revenue Million Forecast, by Country 2019 & 2032
- Table 47: Global Smart Waste Management Market Revenue Million Forecast, by Solution 2019 & 2032
- Table 48: Global Smart Waste Management Market Revenue Million Forecast, by Waste Type 2019 & 2032
- Table 49: Global Smart Waste Management Market Revenue Million Forecast, by Country 2019 & 2032
Frequently Asked Questions
1. What is the projected Compound Annual Growth Rate (CAGR) of the Smart Waste Management Market?
The projected CAGR is approximately 15.08%.
2. Which companies are prominent players in the Smart Waste Management Market?
Key companies in the market include IBM Corporation, Veolia Environmental Services, Evoeco, Covanta Holding Corporation, Bigbelly Inc, Waste Management Inc, Enevo, Pepperl+Fuchs GmbH, BIN-, SAP SE.
3. What are the main segments of the Smart Waste Management Market?
The market segments include Solution, Waste Type.
4. Can you provide details about the market size?
The market size is estimated to be USD 3.08 Million as of 2022.
5. What are some drivers contributing to market growth?
Increasing Volumes of Waste to Boost the Market; Rising Adoption of Smart Cities to Flourish the Market.
6. What are the notable trends driving market growth?
Analytics Sector to Witness Major Growth.
7. Are there any restraints impacting market growth?
Cybersecurity Concerns and Data Security Breaches.
8. Can you provide examples of recent developments in the market?
July 2023 - WM began operations at its new USD 35 million, 14,500 square foot renewable natural gas plant located at the Texas-based company’s Eco Vista landfill, the company said in a news release. Construction on the new facility began two years ago, and the company plans to employ 125 construction workers and four workers to manage the facility, which will have a capacity of 14,500 square feet. The company said the new facility is expected to be fully operational by the end of May.
9. What pricing options are available for accessing the report?
Pricing options include single-user, multi-user, and enterprise licenses priced at USD 4750, USD 5250, and USD 8750 respectively.
10. Is the market size provided in terms of value or volume?
The market size is provided in terms of value, measured in Million.
11. Are there any specific market keywords associated with the report?
Yes, the market keyword associated with the report is "Smart Waste Management Market," which aids in identifying and referencing the specific market segment covered.
12. How do I determine which pricing option suits my needs best?
The pricing options vary based on user requirements and access needs. Individual users may opt for single-user licenses, while businesses requiring broader access may choose multi-user or enterprise licenses for cost-effective access to the report.
13. Are there any additional resources or data provided in the Smart Waste Management Market report?
While the report offers comprehensive insights, it's advisable to review the specific contents or supplementary materials provided to ascertain if additional resources or data are available.
14. How can I stay updated on further developments or reports in the Smart Waste Management Market?
To stay informed about further developments, trends, and reports in the Smart Waste Management Market, consider subscribing to industry newsletters, following relevant companies and organizations, or regularly checking reputable industry news sources and publications.
Methodology
Step 1 - Identification of Relevant Samples Size from Population Database


Step 2 - Approaches for Defining Global Market Size (Value, Volume* & Price*)

Note*: In applicable scenarios
Step 3 - Data Sources
Primary Research
- Web Analytics
- Survey Reports
- Research Institute
- Latest Research Reports
- Opinion Leaders
Secondary Research
- Annual Reports
- White Paper
- Latest Press Release
- Industry Association
- Paid Database
- Investor Presentations

Step 4 - Data Triangulation
Involves using different sources of information in order to increase the validity of a study
These sources are likely to be stakeholders in a program - participants, other researchers, program staff, other community members, and so on.
Then we put all data in single framework & apply various statistical tools to find out the dynamic on the market.
During the analysis stage, feedback from the stakeholder groups would be compared to determine areas of agreement as well as areas of divergence


