
Key Insights
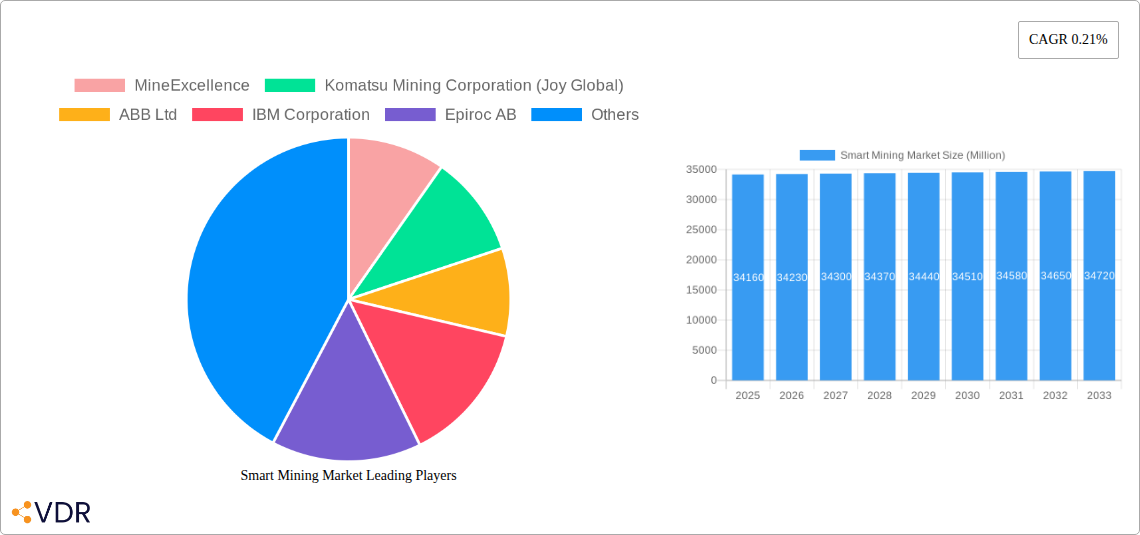
The global smart mining market, valued at $34.16 billion in 2025, is projected to experience steady growth driven by the increasing demand for enhanced efficiency, safety, and sustainability in mining operations. A compound annual growth rate (CAGR) of 0.21% from 2025 to 2033 suggests a relatively stable yet maturing market. Key drivers include the rising adoption of automation and digitalization technologies to optimize resource extraction, improve productivity, and reduce operational costs. This trend is particularly evident in underground mining, where the challenges of remote monitoring and worker safety are amplified. The integration of smart control systems, asset management solutions, and data analytics software is streamlining workflows, enhancing decision-making, and creating opportunities for predictive maintenance, thereby minimizing downtime and maximizing output. Furthermore, stringent safety regulations and the need to minimize environmental impact are fueling the adoption of advanced safety and security systems within the sector.
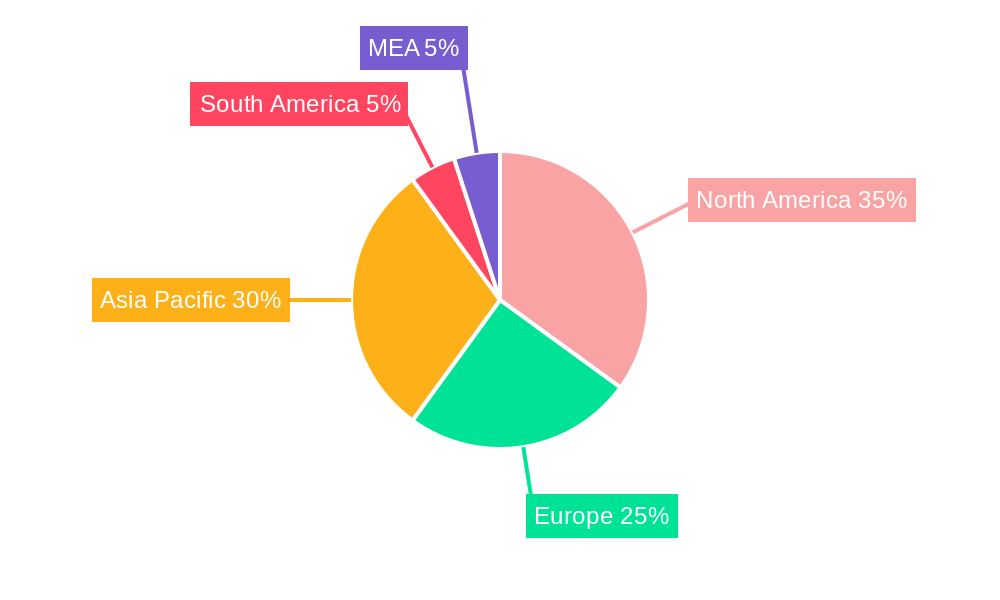
Market segmentation reveals a diverse landscape. Smart control systems and data management and analytics software are leading solution segments, reflecting the increasing emphasis on real-time monitoring and data-driven insights. System integration services are a significant portion of the service market, emphasizing the complexity of integrating disparate technologies across mining operations. Geographically, North America and Asia-Pacific are expected to dominate the market due to their established mining industries and high levels of technological adoption. However, growth is also anticipated in regions like South America and the Middle East and Africa, as mining operations in these regions increasingly embrace digital transformation initiatives. Competitive landscape analysis reveals a mix of established technology vendors, mining equipment manufacturers, and specialized software providers, indicating a dynamic and evolving market with ample opportunities for innovation and expansion. The relatively low CAGR suggests a level of market saturation in specific segments, but ongoing technological advancements and the continued focus on operational optimization will likely drive further growth in niche applications.
Smart Mining Market: A Comprehensive Market Report (2019-2033)
This in-depth report provides a comprehensive analysis of the Smart Mining market, encompassing market dynamics, growth trends, regional dominance, product landscape, key players, and future outlook. The report covers the period from 2019 to 2033, with 2025 as the base year and a forecast period of 2025-2033. The parent market is the Mining industry, with the child market being Smart Mining solutions and services. The total market value in 2025 is estimated at XX Million, projected to reach YY Million by 2033.
Smart Mining Market Dynamics & Structure
The Smart Mining market is characterized by moderate concentration, with several key players holding significant market share. Technological innovation, particularly in AI, IoT, and data analytics, is a major driver. Stringent safety regulations and environmental concerns are shaping market growth. Competitive pressures exist from traditional mining equipment providers diversifying into smart solutions. The market is segmented by solution (Smart Control System, Smart Asset Management, Safety and Security System, Data Management and Analytics Software, Monitoring System, Other Solutions), service type (System Integration, Consulting Service, Engineering and Maintenance), and mining type (Underground Mining, Surface Mining). M&A activity has been relatively low in recent years, with a total of xx deals recorded between 2019 and 2024 (an average of xx deals per year).
- Market Concentration: Moderately concentrated, with top 5 players holding approximately xx% market share in 2024.
- Technological Innovation: AI, IoT, and cloud computing are driving significant advancements.
- Regulatory Landscape: Stringent safety and environmental regulations are influencing adoption rates.
- Competitive Substitutes: Traditional mining equipment and manual processes pose competition.
- End-User Demographics: Primarily large-scale mining operations, with increasing adoption among mid-sized companies.
- M&A Trends: Low levels of M&A activity observed recently, indicating potential for future consolidation.
Smart Mining Market Growth Trends & Insights
The Smart Mining market has witnessed substantial growth over the past few years, driven by the increasing need for enhanced efficiency, safety, and productivity in mining operations. The market size expanded from approximately XX Million in 2019 to XX Million in 2024, exhibiting a CAGR of xx%. This growth is fueled by the rising adoption of smart technologies like AI-powered predictive maintenance and autonomous haulage systems. The market penetration of smart mining solutions is increasing across various mining types, with underground mining showing faster adoption due to the inherent safety risks. Technological disruptions, such as the advancement of 5G connectivity and the development of more sophisticated sensors, are further accelerating market expansion. Shifting consumer behavior towards data-driven decision-making and sustainable practices is also contributing to market growth. The market is expected to maintain a healthy CAGR of xx% during the forecast period (2025-2033).
Dominant Regions, Countries, or Segments in Smart Mining Market
North America currently holds the largest market share in the Smart Mining sector, followed by Europe and Asia-Pacific. The dominance of North America is attributed to the early adoption of advanced technologies, substantial investments in R&D, and the presence of major mining companies and technology providers. Within the segment breakdown:
- By Solution: Smart Control Systems and Data Management & Analytics Software segments demonstrate the highest growth potential due to their ability to optimize operations and enhance decision-making.
- By Service Type: System Integration services are currently dominating due to the complex nature of implementing smart mining solutions.
- By Mining Type: Underground mining is showing higher adoption than surface mining due to safety and efficiency needs in challenging environments.
Key drivers for regional growth include:
- North America: Strong government support for technological innovation and significant investment in mining operations.
- Europe: Focus on sustainable mining practices and stringent environmental regulations.
- Asia-Pacific: Rapid industrialization and increasing mining activities.
Smart Mining Market Product Landscape
Smart mining solutions are increasingly incorporating advanced technologies like AI, machine learning, and IoT. Products range from autonomous vehicles and robotic systems to sophisticated data analytics platforms. These products offer unique selling propositions such as improved safety, reduced operational costs, and enhanced productivity. Recent innovations include real-time monitoring systems, predictive maintenance algorithms, and advanced process control solutions. Key performance indicators include increased efficiency, reduced downtime, improved safety records, and optimized resource utilization.
Key Drivers, Barriers & Challenges in Smart Mining Market
Key Drivers:
- Technological advancements in AI, IoT, and data analytics are leading to the development of more efficient and productive mining solutions.
- Growing demand for enhanced safety and improved environmental sustainability in mining operations.
- Increasing need for real-time data monitoring and analysis to optimize resource allocation and reduce operational costs.
Key Challenges & Restraints:
- High initial investment costs associated with implementing smart mining solutions.
- Lack of skilled workforce capable of operating and maintaining advanced technologies.
- Concerns regarding data security and cyber threats in interconnected systems. This represents a potential xx% loss in productivity for companies not prioritizing cybersecurity.
Emerging Opportunities in Smart Mining Market
- Untapped markets in developing countries with significant mining activities present substantial growth opportunities.
- The integration of blockchain technology to enhance transparency and traceability in the supply chain is emerging as a significant opportunity.
- Growing demand for customized smart mining solutions tailored to the specific needs of individual mining operations.
Growth Accelerators in the Smart Mining Market Industry
Strategic partnerships between technology providers and mining companies are accelerating market growth. Technological breakthroughs, such as the development of more robust and reliable sensors and improved connectivity, are further fueling the market. Expanding into new geographic markets and developing innovative applications for smart mining solutions are also crucial growth drivers.
Key Players Shaping the Smart Mining Market Market
- MineExcellence
- Komatsu Mining Corporation (Joy Global)
- ABB Ltd
- IBM Corporation
- Epiroc AB
- Cisco Systems Inc
- Wenco International Mining Systems Ltd
- Metso Outotec OYJ
- Rockwell Automation Inc
- Trimble Inc
- Symboticware Inc
- SAP SE
Notable Milestones in Smart Mining Market Sector
- June 2022: Metso Outotec collaborated with Dynamox on condition monitoring, enhancing digital solutions.
- May 2022: Epiroc launched the Boomer S10 S, boosting mine development productivity by up to 25%.
In-Depth Smart Mining Market Market Outlook
The Smart Mining market is poised for significant growth in the coming years, driven by ongoing technological advancements, increasing adoption rates, and the growing focus on efficiency and sustainability in the mining industry. Strategic partnerships and expansion into new markets will further enhance market potential. The long-term outlook remains positive, with opportunities for innovation and growth across various segments and regions.
Smart Mining Market Segmentation
-
1. Solution
- 1.1. Smart Control System
- 1.2. Smart Asset Management
- 1.3. Safety and Security System
- 1.4. Data Management and Analytics Software
- 1.5. Monitoring System
- 1.6. Other Solutions
-
2. Service Type
- 2.1. System Integration
- 2.2. Consulting Service
- 2.3. Engineering and Maintenance
-
3. Mining Type
- 3.1. Underground Mining
- 3.2. Surface Mining
Smart Mining Market Segmentation By Geography
- 1. North America
- 2. Europe
- 3. Asia Pacific
- 4. Latin America
- 5. Middle East and Africa
Smart Mining Market REPORT HIGHLIGHTS
| Aspects | Details |
|---|---|
| Study Period | 2019-2033 |
| Base Year | 2024 |
| Estimated Year | 2025 |
| Forecast Period | 2025-2033 |
| Historical Period | 2019-2024 |
| Growth Rate | CAGR of 0.21% from 2019-2033 |
| Segmentation |
|
Table of Contents
- 1. Introduction
- 1.1. Research Scope
- 1.2. Market Segmentation
- 1.3. Research Methodology
- 1.4. Definitions and Assumptions
- 2. Executive Summary
- 2.1. Introduction
- 3. Market Dynamics
- 3.1. Introduction
- 3.2. Market Drivers
- 3.2.1. Rising Adoption of Wireless Monitoring and Centralized Solutions among Several Large Mining Installations; Technological Advancements and Convergence of Various Digital Transformation Practices
- 3.3. Market Restrains
- 3.3.1. Operational and Cost Challenges Remain a Concern in Emerging Regions; Workers Safety and Health
- 3.4. Market Trends
- 3.4.1. Data Management and Analytics Software is Expected to Show Highest Growth
- 4. Market Factor Analysis
- 4.1. Porters Five Forces
- 4.2. Supply/Value Chain
- 4.3. PESTEL analysis
- 4.4. Market Entropy
- 4.5. Patent/Trademark Analysis
- 5. Global Smart Mining Market Analysis, Insights and Forecast, 2019-2031
- 5.1. Market Analysis, Insights and Forecast - by Solution
- 5.1.1. Smart Control System
- 5.1.2. Smart Asset Management
- 5.1.3. Safety and Security System
- 5.1.4. Data Management and Analytics Software
- 5.1.5. Monitoring System
- 5.1.6. Other Solutions
- 5.2. Market Analysis, Insights and Forecast - by Service Type
- 5.2.1. System Integration
- 5.2.2. Consulting Service
- 5.2.3. Engineering and Maintenance
- 5.3. Market Analysis, Insights and Forecast - by Mining Type
- 5.3.1. Underground Mining
- 5.3.2. Surface Mining
- 5.4. Market Analysis, Insights and Forecast - by Region
- 5.4.1. North America
- 5.4.2. Europe
- 5.4.3. Asia Pacific
- 5.4.4. Latin America
- 5.4.5. Middle East and Africa
- 5.1. Market Analysis, Insights and Forecast - by Solution
- 6. North America Smart Mining Market Analysis, Insights and Forecast, 2019-2031
- 6.1. Market Analysis, Insights and Forecast - by Solution
- 6.1.1. Smart Control System
- 6.1.2. Smart Asset Management
- 6.1.3. Safety and Security System
- 6.1.4. Data Management and Analytics Software
- 6.1.5. Monitoring System
- 6.1.6. Other Solutions
- 6.2. Market Analysis, Insights and Forecast - by Service Type
- 6.2.1. System Integration
- 6.2.2. Consulting Service
- 6.2.3. Engineering and Maintenance
- 6.3. Market Analysis, Insights and Forecast - by Mining Type
- 6.3.1. Underground Mining
- 6.3.2. Surface Mining
- 6.1. Market Analysis, Insights and Forecast - by Solution
- 7. Europe Smart Mining Market Analysis, Insights and Forecast, 2019-2031
- 7.1. Market Analysis, Insights and Forecast - by Solution
- 7.1.1. Smart Control System
- 7.1.2. Smart Asset Management
- 7.1.3. Safety and Security System
- 7.1.4. Data Management and Analytics Software
- 7.1.5. Monitoring System
- 7.1.6. Other Solutions
- 7.2. Market Analysis, Insights and Forecast - by Service Type
- 7.2.1. System Integration
- 7.2.2. Consulting Service
- 7.2.3. Engineering and Maintenance
- 7.3. Market Analysis, Insights and Forecast - by Mining Type
- 7.3.1. Underground Mining
- 7.3.2. Surface Mining
- 7.1. Market Analysis, Insights and Forecast - by Solution
- 8. Asia Pacific Smart Mining Market Analysis, Insights and Forecast, 2019-2031
- 8.1. Market Analysis, Insights and Forecast - by Solution
- 8.1.1. Smart Control System
- 8.1.2. Smart Asset Management
- 8.1.3. Safety and Security System
- 8.1.4. Data Management and Analytics Software
- 8.1.5. Monitoring System
- 8.1.6. Other Solutions
- 8.2. Market Analysis, Insights and Forecast - by Service Type
- 8.2.1. System Integration
- 8.2.2. Consulting Service
- 8.2.3. Engineering and Maintenance
- 8.3. Market Analysis, Insights and Forecast - by Mining Type
- 8.3.1. Underground Mining
- 8.3.2. Surface Mining
- 8.1. Market Analysis, Insights and Forecast - by Solution
- 9. Latin America Smart Mining Market Analysis, Insights and Forecast, 2019-2031
- 9.1. Market Analysis, Insights and Forecast - by Solution
- 9.1.1. Smart Control System
- 9.1.2. Smart Asset Management
- 9.1.3. Safety and Security System
- 9.1.4. Data Management and Analytics Software
- 9.1.5. Monitoring System
- 9.1.6. Other Solutions
- 9.2. Market Analysis, Insights and Forecast - by Service Type
- 9.2.1. System Integration
- 9.2.2. Consulting Service
- 9.2.3. Engineering and Maintenance
- 9.3. Market Analysis, Insights and Forecast - by Mining Type
- 9.3.1. Underground Mining
- 9.3.2. Surface Mining
- 9.1. Market Analysis, Insights and Forecast - by Solution
- 10. Middle East and Africa Smart Mining Market Analysis, Insights and Forecast, 2019-2031
- 10.1. Market Analysis, Insights and Forecast - by Solution
- 10.1.1. Smart Control System
- 10.1.2. Smart Asset Management
- 10.1.3. Safety and Security System
- 10.1.4. Data Management and Analytics Software
- 10.1.5. Monitoring System
- 10.1.6. Other Solutions
- 10.2. Market Analysis, Insights and Forecast - by Service Type
- 10.2.1. System Integration
- 10.2.2. Consulting Service
- 10.2.3. Engineering and Maintenance
- 10.3. Market Analysis, Insights and Forecast - by Mining Type
- 10.3.1. Underground Mining
- 10.3.2. Surface Mining
- 10.1. Market Analysis, Insights and Forecast - by Solution
- 11. North America Smart Mining Market Analysis, Insights and Forecast, 2019-2031
- 11.1. Market Analysis, Insights and Forecast - By Country/Sub-region
- 11.1.1 United States
- 11.1.2 Canada
- 11.1.3 Mexico
- 12. Europe Smart Mining Market Analysis, Insights and Forecast, 2019-2031
- 12.1. Market Analysis, Insights and Forecast - By Country/Sub-region
- 12.1.1 Germany
- 12.1.2 United Kingdom
- 12.1.3 France
- 12.1.4 Spain
- 12.1.5 Italy
- 12.1.6 Spain
- 12.1.7 Belgium
- 12.1.8 Netherland
- 12.1.9 Nordics
- 12.1.10 Rest of Europe
- 13. Asia Pacific Smart Mining Market Analysis, Insights and Forecast, 2019-2031
- 13.1. Market Analysis, Insights and Forecast - By Country/Sub-region
- 13.1.1 China
- 13.1.2 Japan
- 13.1.3 India
- 13.1.4 South Korea
- 13.1.5 Southeast Asia
- 13.1.6 Australia
- 13.1.7 Indonesia
- 13.1.8 Phillipes
- 13.1.9 Singapore
- 13.1.10 Thailandc
- 13.1.11 Rest of Asia Pacific
- 14. South America Smart Mining Market Analysis, Insights and Forecast, 2019-2031
- 14.1. Market Analysis, Insights and Forecast - By Country/Sub-region
- 14.1.1 Brazil
- 14.1.2 Argentina
- 14.1.3 Peru
- 14.1.4 Chile
- 14.1.5 Colombia
- 14.1.6 Ecuador
- 14.1.7 Venezuela
- 14.1.8 Rest of South America
- 15. North America Smart Mining Market Analysis, Insights and Forecast, 2019-2031
- 15.1. Market Analysis, Insights and Forecast - By Country/Sub-region
- 15.1.1 United States
- 15.1.2 Canada
- 15.1.3 Mexico
- 16. MEA Smart Mining Market Analysis, Insights and Forecast, 2019-2031
- 16.1. Market Analysis, Insights and Forecast - By Country/Sub-region
- 16.1.1 United Arab Emirates
- 16.1.2 Saudi Arabia
- 16.1.3 South Africa
- 16.1.4 Rest of Middle East and Africa
- 17. Competitive Analysis
- 17.1. Global Market Share Analysis 2024
- 17.2. Company Profiles
- 17.2.1 MineExcellence
- 17.2.1.1. Overview
- 17.2.1.2. Products
- 17.2.1.3. SWOT Analysis
- 17.2.1.4. Recent Developments
- 17.2.1.5. Financials (Based on Availability)
- 17.2.2 Komatsu Mining Corporation (Joy Global)
- 17.2.2.1. Overview
- 17.2.2.2. Products
- 17.2.2.3. SWOT Analysis
- 17.2.2.4. Recent Developments
- 17.2.2.5. Financials (Based on Availability)
- 17.2.3 ABB Ltd
- 17.2.3.1. Overview
- 17.2.3.2. Products
- 17.2.3.3. SWOT Analysis
- 17.2.3.4. Recent Developments
- 17.2.3.5. Financials (Based on Availability)
- 17.2.4 IBM Corporation
- 17.2.4.1. Overview
- 17.2.4.2. Products
- 17.2.4.3. SWOT Analysis
- 17.2.4.4. Recent Developments
- 17.2.4.5. Financials (Based on Availability)
- 17.2.5 Epiroc AB
- 17.2.5.1. Overview
- 17.2.5.2. Products
- 17.2.5.3. SWOT Analysis
- 17.2.5.4. Recent Developments
- 17.2.5.5. Financials (Based on Availability)
- 17.2.6 Cisco Systems Inc
- 17.2.6.1. Overview
- 17.2.6.2. Products
- 17.2.6.3. SWOT Analysis
- 17.2.6.4. Recent Developments
- 17.2.6.5. Financials (Based on Availability)
- 17.2.7 Wenco International Mining Systems Ltd
- 17.2.7.1. Overview
- 17.2.7.2. Products
- 17.2.7.3. SWOT Analysis
- 17.2.7.4. Recent Developments
- 17.2.7.5. Financials (Based on Availability)
- 17.2.8 Metso Outotec OYJ
- 17.2.8.1. Overview
- 17.2.8.2. Products
- 17.2.8.3. SWOT Analysis
- 17.2.8.4. Recent Developments
- 17.2.8.5. Financials (Based on Availability)
- 17.2.9 Rockwell Automation Inc
- 17.2.9.1. Overview
- 17.2.9.2. Products
- 17.2.9.3. SWOT Analysis
- 17.2.9.4. Recent Developments
- 17.2.9.5. Financials (Based on Availability)
- 17.2.10 Trimble Inc
- 17.2.10.1. Overview
- 17.2.10.2. Products
- 17.2.10.3. SWOT Analysis
- 17.2.10.4. Recent Developments
- 17.2.10.5. Financials (Based on Availability)
- 17.2.11 Symboticware Inc
- 17.2.11.1. Overview
- 17.2.11.2. Products
- 17.2.11.3. SWOT Analysis
- 17.2.11.4. Recent Developments
- 17.2.11.5. Financials (Based on Availability)
- 17.2.12 SAP SE
- 17.2.12.1. Overview
- 17.2.12.2. Products
- 17.2.12.3. SWOT Analysis
- 17.2.12.4. Recent Developments
- 17.2.12.5. Financials (Based on Availability)
- 17.2.1 MineExcellence
List of Figures
- Figure 1: Global Smart Mining Market Revenue Breakdown (Million, %) by Region 2024 & 2032
- Figure 2: North America Smart Mining Market Revenue (Million), by Country 2024 & 2032
- Figure 3: North America Smart Mining Market Revenue Share (%), by Country 2024 & 2032
- Figure 4: Europe Smart Mining Market Revenue (Million), by Country 2024 & 2032
- Figure 5: Europe Smart Mining Market Revenue Share (%), by Country 2024 & 2032
- Figure 6: Asia Pacific Smart Mining Market Revenue (Million), by Country 2024 & 2032
- Figure 7: Asia Pacific Smart Mining Market Revenue Share (%), by Country 2024 & 2032
- Figure 8: South America Smart Mining Market Revenue (Million), by Country 2024 & 2032
- Figure 9: South America Smart Mining Market Revenue Share (%), by Country 2024 & 2032
- Figure 10: North America Smart Mining Market Revenue (Million), by Country 2024 & 2032
- Figure 11: North America Smart Mining Market Revenue Share (%), by Country 2024 & 2032
- Figure 12: MEA Smart Mining Market Revenue (Million), by Country 2024 & 2032
- Figure 13: MEA Smart Mining Market Revenue Share (%), by Country 2024 & 2032
- Figure 14: North America Smart Mining Market Revenue (Million), by Solution 2024 & 2032
- Figure 15: North America Smart Mining Market Revenue Share (%), by Solution 2024 & 2032
- Figure 16: North America Smart Mining Market Revenue (Million), by Service Type 2024 & 2032
- Figure 17: North America Smart Mining Market Revenue Share (%), by Service Type 2024 & 2032
- Figure 18: North America Smart Mining Market Revenue (Million), by Mining Type 2024 & 2032
- Figure 19: North America Smart Mining Market Revenue Share (%), by Mining Type 2024 & 2032
- Figure 20: North America Smart Mining Market Revenue (Million), by Country 2024 & 2032
- Figure 21: North America Smart Mining Market Revenue Share (%), by Country 2024 & 2032
- Figure 22: Europe Smart Mining Market Revenue (Million), by Solution 2024 & 2032
- Figure 23: Europe Smart Mining Market Revenue Share (%), by Solution 2024 & 2032
- Figure 24: Europe Smart Mining Market Revenue (Million), by Service Type 2024 & 2032
- Figure 25: Europe Smart Mining Market Revenue Share (%), by Service Type 2024 & 2032
- Figure 26: Europe Smart Mining Market Revenue (Million), by Mining Type 2024 & 2032
- Figure 27: Europe Smart Mining Market Revenue Share (%), by Mining Type 2024 & 2032
- Figure 28: Europe Smart Mining Market Revenue (Million), by Country 2024 & 2032
- Figure 29: Europe Smart Mining Market Revenue Share (%), by Country 2024 & 2032
- Figure 30: Asia Pacific Smart Mining Market Revenue (Million), by Solution 2024 & 2032
- Figure 31: Asia Pacific Smart Mining Market Revenue Share (%), by Solution 2024 & 2032
- Figure 32: Asia Pacific Smart Mining Market Revenue (Million), by Service Type 2024 & 2032
- Figure 33: Asia Pacific Smart Mining Market Revenue Share (%), by Service Type 2024 & 2032
- Figure 34: Asia Pacific Smart Mining Market Revenue (Million), by Mining Type 2024 & 2032
- Figure 35: Asia Pacific Smart Mining Market Revenue Share (%), by Mining Type 2024 & 2032
- Figure 36: Asia Pacific Smart Mining Market Revenue (Million), by Country 2024 & 2032
- Figure 37: Asia Pacific Smart Mining Market Revenue Share (%), by Country 2024 & 2032
- Figure 38: Latin America Smart Mining Market Revenue (Million), by Solution 2024 & 2032
- Figure 39: Latin America Smart Mining Market Revenue Share (%), by Solution 2024 & 2032
- Figure 40: Latin America Smart Mining Market Revenue (Million), by Service Type 2024 & 2032
- Figure 41: Latin America Smart Mining Market Revenue Share (%), by Service Type 2024 & 2032
- Figure 42: Latin America Smart Mining Market Revenue (Million), by Mining Type 2024 & 2032
- Figure 43: Latin America Smart Mining Market Revenue Share (%), by Mining Type 2024 & 2032
- Figure 44: Latin America Smart Mining Market Revenue (Million), by Country 2024 & 2032
- Figure 45: Latin America Smart Mining Market Revenue Share (%), by Country 2024 & 2032
- Figure 46: Middle East and Africa Smart Mining Market Revenue (Million), by Solution 2024 & 2032
- Figure 47: Middle East and Africa Smart Mining Market Revenue Share (%), by Solution 2024 & 2032
- Figure 48: Middle East and Africa Smart Mining Market Revenue (Million), by Service Type 2024 & 2032
- Figure 49: Middle East and Africa Smart Mining Market Revenue Share (%), by Service Type 2024 & 2032
- Figure 50: Middle East and Africa Smart Mining Market Revenue (Million), by Mining Type 2024 & 2032
- Figure 51: Middle East and Africa Smart Mining Market Revenue Share (%), by Mining Type 2024 & 2032
- Figure 52: Middle East and Africa Smart Mining Market Revenue (Million), by Country 2024 & 2032
- Figure 53: Middle East and Africa Smart Mining Market Revenue Share (%), by Country 2024 & 2032
List of Tables
- Table 1: Global Smart Mining Market Revenue Million Forecast, by Region 2019 & 2032
- Table 2: Global Smart Mining Market Revenue Million Forecast, by Solution 2019 & 2032
- Table 3: Global Smart Mining Market Revenue Million Forecast, by Service Type 2019 & 2032
- Table 4: Global Smart Mining Market Revenue Million Forecast, by Mining Type 2019 & 2032
- Table 5: Global Smart Mining Market Revenue Million Forecast, by Region 2019 & 2032
- Table 6: Global Smart Mining Market Revenue Million Forecast, by Country 2019 & 2032
- Table 7: United States Smart Mining Market Revenue (Million) Forecast, by Application 2019 & 2032
- Table 8: Canada Smart Mining Market Revenue (Million) Forecast, by Application 2019 & 2032
- Table 9: Mexico Smart Mining Market Revenue (Million) Forecast, by Application 2019 & 2032
- Table 10: Global Smart Mining Market Revenue Million Forecast, by Country 2019 & 2032
- Table 11: Germany Smart Mining Market Revenue (Million) Forecast, by Application 2019 & 2032
- Table 12: United Kingdom Smart Mining Market Revenue (Million) Forecast, by Application 2019 & 2032
- Table 13: France Smart Mining Market Revenue (Million) Forecast, by Application 2019 & 2032
- Table 14: Spain Smart Mining Market Revenue (Million) Forecast, by Application 2019 & 2032
- Table 15: Italy Smart Mining Market Revenue (Million) Forecast, by Application 2019 & 2032
- Table 16: Spain Smart Mining Market Revenue (Million) Forecast, by Application 2019 & 2032
- Table 17: Belgium Smart Mining Market Revenue (Million) Forecast, by Application 2019 & 2032
- Table 18: Netherland Smart Mining Market Revenue (Million) Forecast, by Application 2019 & 2032
- Table 19: Nordics Smart Mining Market Revenue (Million) Forecast, by Application 2019 & 2032
- Table 20: Rest of Europe Smart Mining Market Revenue (Million) Forecast, by Application 2019 & 2032
- Table 21: Global Smart Mining Market Revenue Million Forecast, by Country 2019 & 2032
- Table 22: China Smart Mining Market Revenue (Million) Forecast, by Application 2019 & 2032
- Table 23: Japan Smart Mining Market Revenue (Million) Forecast, by Application 2019 & 2032
- Table 24: India Smart Mining Market Revenue (Million) Forecast, by Application 2019 & 2032
- Table 25: South Korea Smart Mining Market Revenue (Million) Forecast, by Application 2019 & 2032
- Table 26: Southeast Asia Smart Mining Market Revenue (Million) Forecast, by Application 2019 & 2032
- Table 27: Australia Smart Mining Market Revenue (Million) Forecast, by Application 2019 & 2032
- Table 28: Indonesia Smart Mining Market Revenue (Million) Forecast, by Application 2019 & 2032
- Table 29: Phillipes Smart Mining Market Revenue (Million) Forecast, by Application 2019 & 2032
- Table 30: Singapore Smart Mining Market Revenue (Million) Forecast, by Application 2019 & 2032
- Table 31: Thailandc Smart Mining Market Revenue (Million) Forecast, by Application 2019 & 2032
- Table 32: Rest of Asia Pacific Smart Mining Market Revenue (Million) Forecast, by Application 2019 & 2032
- Table 33: Global Smart Mining Market Revenue Million Forecast, by Country 2019 & 2032
- Table 34: Brazil Smart Mining Market Revenue (Million) Forecast, by Application 2019 & 2032
- Table 35: Argentina Smart Mining Market Revenue (Million) Forecast, by Application 2019 & 2032
- Table 36: Peru Smart Mining Market Revenue (Million) Forecast, by Application 2019 & 2032
- Table 37: Chile Smart Mining Market Revenue (Million) Forecast, by Application 2019 & 2032
- Table 38: Colombia Smart Mining Market Revenue (Million) Forecast, by Application 2019 & 2032
- Table 39: Ecuador Smart Mining Market Revenue (Million) Forecast, by Application 2019 & 2032
- Table 40: Venezuela Smart Mining Market Revenue (Million) Forecast, by Application 2019 & 2032
- Table 41: Rest of South America Smart Mining Market Revenue (Million) Forecast, by Application 2019 & 2032
- Table 42: Global Smart Mining Market Revenue Million Forecast, by Country 2019 & 2032
- Table 43: United States Smart Mining Market Revenue (Million) Forecast, by Application 2019 & 2032
- Table 44: Canada Smart Mining Market Revenue (Million) Forecast, by Application 2019 & 2032
- Table 45: Mexico Smart Mining Market Revenue (Million) Forecast, by Application 2019 & 2032
- Table 46: Global Smart Mining Market Revenue Million Forecast, by Country 2019 & 2032
- Table 47: United Arab Emirates Smart Mining Market Revenue (Million) Forecast, by Application 2019 & 2032
- Table 48: Saudi Arabia Smart Mining Market Revenue (Million) Forecast, by Application 2019 & 2032
- Table 49: South Africa Smart Mining Market Revenue (Million) Forecast, by Application 2019 & 2032
- Table 50: Rest of Middle East and Africa Smart Mining Market Revenue (Million) Forecast, by Application 2019 & 2032
- Table 51: Global Smart Mining Market Revenue Million Forecast, by Solution 2019 & 2032
- Table 52: Global Smart Mining Market Revenue Million Forecast, by Service Type 2019 & 2032
- Table 53: Global Smart Mining Market Revenue Million Forecast, by Mining Type 2019 & 2032
- Table 54: Global Smart Mining Market Revenue Million Forecast, by Country 2019 & 2032
- Table 55: Global Smart Mining Market Revenue Million Forecast, by Solution 2019 & 2032
- Table 56: Global Smart Mining Market Revenue Million Forecast, by Service Type 2019 & 2032
- Table 57: Global Smart Mining Market Revenue Million Forecast, by Mining Type 2019 & 2032
- Table 58: Global Smart Mining Market Revenue Million Forecast, by Country 2019 & 2032
- Table 59: Global Smart Mining Market Revenue Million Forecast, by Solution 2019 & 2032
- Table 60: Global Smart Mining Market Revenue Million Forecast, by Service Type 2019 & 2032
- Table 61: Global Smart Mining Market Revenue Million Forecast, by Mining Type 2019 & 2032
- Table 62: Global Smart Mining Market Revenue Million Forecast, by Country 2019 & 2032
- Table 63: Global Smart Mining Market Revenue Million Forecast, by Solution 2019 & 2032
- Table 64: Global Smart Mining Market Revenue Million Forecast, by Service Type 2019 & 2032
- Table 65: Global Smart Mining Market Revenue Million Forecast, by Mining Type 2019 & 2032
- Table 66: Global Smart Mining Market Revenue Million Forecast, by Country 2019 & 2032
- Table 67: Global Smart Mining Market Revenue Million Forecast, by Solution 2019 & 2032
- Table 68: Global Smart Mining Market Revenue Million Forecast, by Service Type 2019 & 2032
- Table 69: Global Smart Mining Market Revenue Million Forecast, by Mining Type 2019 & 2032
- Table 70: Global Smart Mining Market Revenue Million Forecast, by Country 2019 & 2032
Frequently Asked Questions
1. What is the projected Compound Annual Growth Rate (CAGR) of the Smart Mining Market?
The projected CAGR is approximately 0.21%.
2. Which companies are prominent players in the Smart Mining Market?
Key companies in the market include MineExcellence, Komatsu Mining Corporation (Joy Global), ABB Ltd, IBM Corporation, Epiroc AB, Cisco Systems Inc, Wenco International Mining Systems Ltd, Metso Outotec OYJ, Rockwell Automation Inc, Trimble Inc, Symboticware Inc, SAP SE.
3. What are the main segments of the Smart Mining Market?
The market segments include Solution, Service Type, Mining Type.
4. Can you provide details about the market size?
The market size is estimated to be USD 34.16 Million as of 2022.
5. What are some drivers contributing to market growth?
Rising Adoption of Wireless Monitoring and Centralized Solutions among Several Large Mining Installations; Technological Advancements and Convergence of Various Digital Transformation Practices.
6. What are the notable trends driving market growth?
Data Management and Analytics Software is Expected to Show Highest Growth.
7. Are there any restraints impacting market growth?
Operational and Cost Challenges Remain a Concern in Emerging Regions; Workers Safety and Health.
8. Can you provide examples of recent developments in the market?
June 2022 - Metso Outotec collaborated with Dynamox on using Dynamox's condition monitoring platform in mining and aggregating processes. Metso Outotec is offering the solution to the company's installed equipment base. Dynamox is an addition to Metso Outotec's partner ecosystem and helps develop and provide easy-to-use and sustainable digital solutions to customers. The company is further upgrading in mining using AI and analytics solutions.
9. What pricing options are available for accessing the report?
Pricing options include single-user, multi-user, and enterprise licenses priced at USD 4750, USD 5250, and USD 8750 respectively.
10. Is the market size provided in terms of value or volume?
The market size is provided in terms of value, measured in Million.
11. Are there any specific market keywords associated with the report?
Yes, the market keyword associated with the report is "Smart Mining Market," which aids in identifying and referencing the specific market segment covered.
12. How do I determine which pricing option suits my needs best?
The pricing options vary based on user requirements and access needs. Individual users may opt for single-user licenses, while businesses requiring broader access may choose multi-user or enterprise licenses for cost-effective access to the report.
13. Are there any additional resources or data provided in the Smart Mining Market report?
While the report offers comprehensive insights, it's advisable to review the specific contents or supplementary materials provided to ascertain if additional resources or data are available.
14. How can I stay updated on further developments or reports in the Smart Mining Market?
To stay informed about further developments, trends, and reports in the Smart Mining Market, consider subscribing to industry newsletters, following relevant companies and organizations, or regularly checking reputable industry news sources and publications.
Methodology
Step 1 - Identification of Relevant Samples Size from Population Database


Step 2 - Approaches for Defining Global Market Size (Value, Volume* & Price*)

Note*: In applicable scenarios
Step 3 - Data Sources
Primary Research
- Web Analytics
- Survey Reports
- Research Institute
- Latest Research Reports
- Opinion Leaders
Secondary Research
- Annual Reports
- White Paper
- Latest Press Release
- Industry Association
- Paid Database
- Investor Presentations

Step 4 - Data Triangulation
Involves using different sources of information in order to increase the validity of a study
These sources are likely to be stakeholders in a program - participants, other researchers, program staff, other community members, and so on.
Then we put all data in single framework & apply various statistical tools to find out the dynamic on the market.
During the analysis stage, feedback from the stakeholder groups would be compared to determine areas of agreement as well as areas of divergence


