
Key Insights
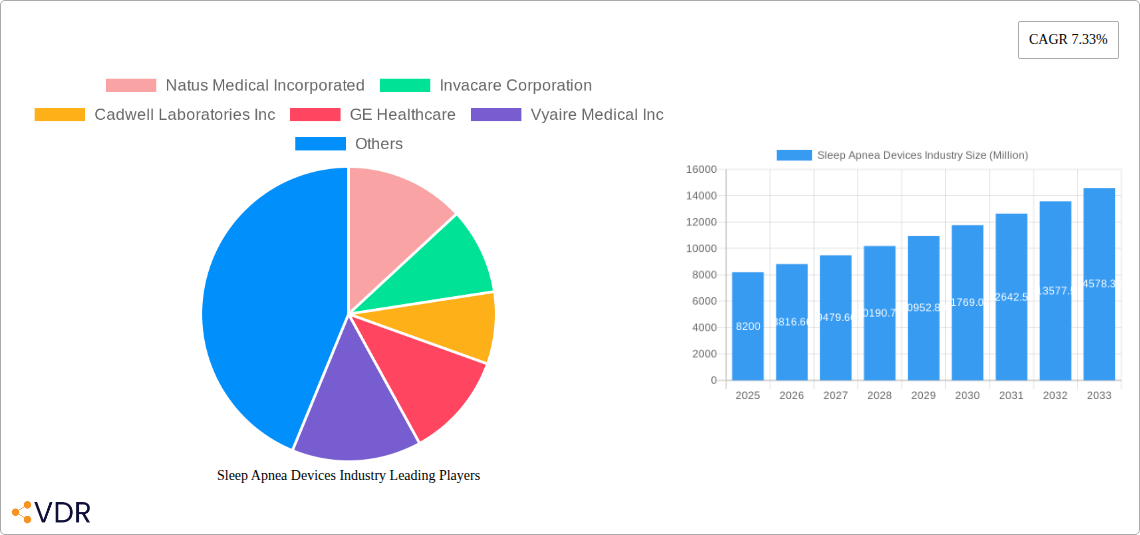
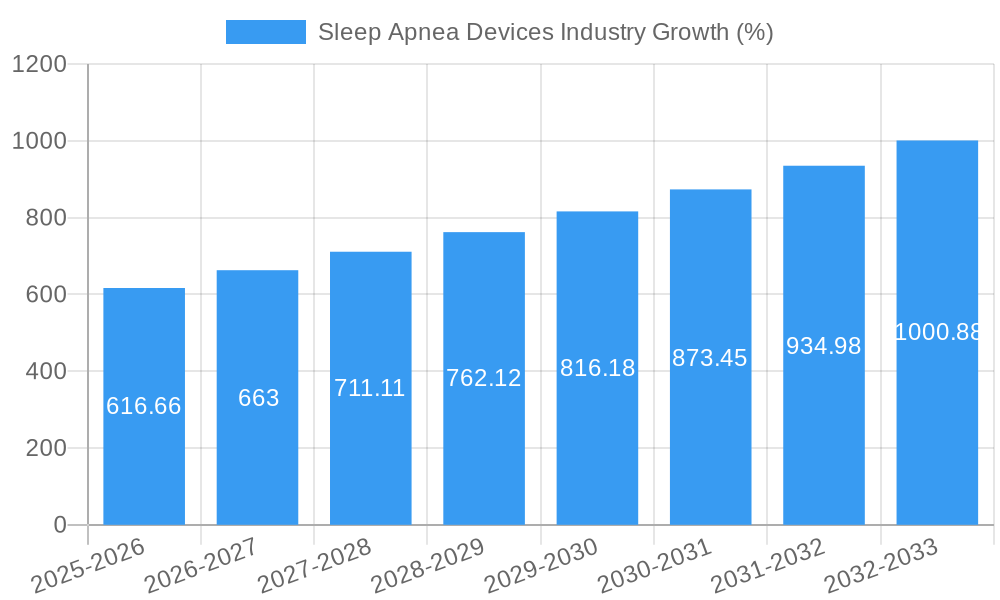
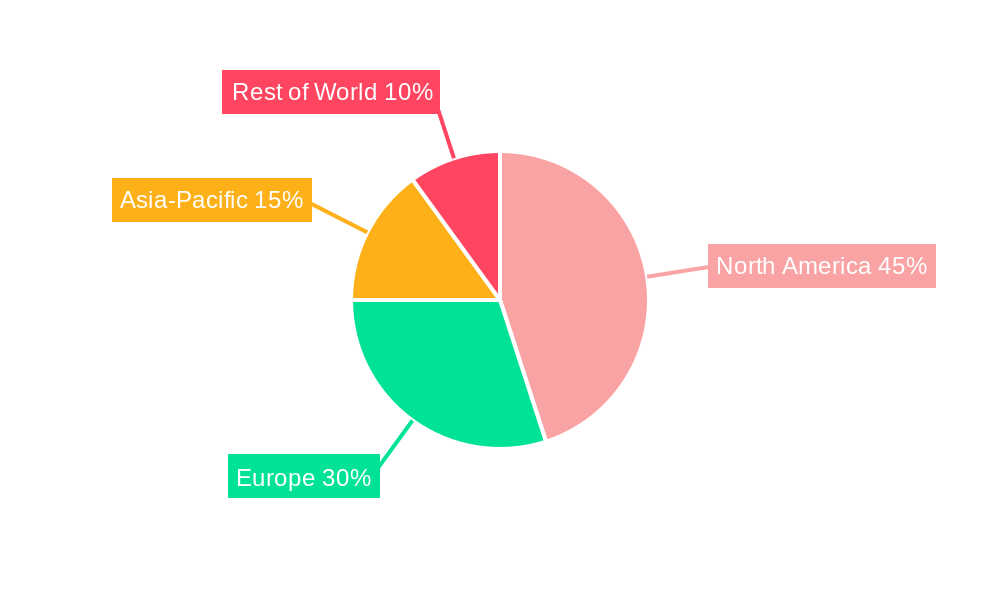
The global sleep apnea devices market, valued at $8.20 billion in 2025, is projected to experience robust growth, driven by rising prevalence of sleep apnea, increasing awareness about the condition and its associated health risks, and technological advancements leading to the development of more comfortable and effective treatment options. The market's Compound Annual Growth Rate (CAGR) of 7.33% from 2025 to 2033 indicates a significant expansion. Key drivers include a growing aging population (increasing susceptibility to sleep apnea), rising healthcare expenditure, and improved reimbursement policies facilitating wider access to treatment. Market segmentation reveals PAP (Positive Airway Pressure) devices, including BiPAP (Bilevel Positive Airway Pressure) machines, as the dominant product type, followed by oxygen devices and oral appliances. North America and Europe currently hold significant market shares, reflecting high healthcare infrastructure and awareness levels, but the Asia-Pacific region is anticipated to exhibit strong growth due to expanding healthcare facilities and rising disposable incomes. The competitive landscape is characterized by both established players like ResMed and Philips, and emerging companies specializing in innovative device technologies.
Continued growth will depend on several factors. The market's success hinges on addressing challenges such as high device costs, potential side effects of certain therapies, and variations in healthcare infrastructure across different regions. Further advancements in device miniaturization, improved patient compliance strategies, and development of non-invasive treatment options will shape future market dynamics. Expansion into underserved markets through increased awareness campaigns and targeted marketing initiatives is critical for sustained growth. A focus on developing user-friendly devices and integrating digital health technologies for remote patient monitoring will also contribute to overall market expansion. The focus on improving diagnostic methods to aid in early detection and increased access to healthcare in emerging economies will further stimulate this market.
Sleep Apnea Devices Industry Market Report: 2019-2033
This comprehensive report provides an in-depth analysis of the Sleep Apnea Devices market, encompassing market dynamics, growth trends, regional segmentation, product landscape, and key players. The study period spans from 2019 to 2033, with 2025 as the base and estimated year. The forecast period covers 2025-2033, and the historical period encompasses 2019-2024. The report caters to industry professionals, investors, and strategic decision-makers seeking a detailed understanding of this rapidly evolving market. The parent market is the Medical Devices industry, and the child market is specifically Sleep Apnea Devices. Market values are presented in million units.
Sleep Apnea Devices Industry Market Dynamics & Structure
The sleep apnea devices market is characterized by a moderately concentrated landscape with key players vying for market share. Technological innovation, particularly in areas like sensor technology and AI-driven diagnostics, is a significant driver. Stringent regulatory frameworks governing medical device approval and safety standards present both challenges and opportunities. Competitive substitutes, such as lifestyle modifications and surgical interventions, exert pressure on market growth. The end-user demographics are expanding, driven by aging populations and increasing awareness of sleep disorders. The market has witnessed a moderate level of M&A activity, with strategic partnerships and acquisitions aiming to consolidate market share and expand product portfolios.
- Market Concentration: Moderately concentrated, with top 5 players holding approximately xx% market share in 2024.
- Technological Innovation: Focus on smaller, quieter, and more comfortable devices, along with improved data analytics and remote patient monitoring.
- Regulatory Framework: Stringent FDA (US) and CE (EU) approvals impact time to market but enhance safety and reliability.
- Competitive Substitutes: Lifestyle changes, CPAP therapy alternatives, and surgical procedures pose competition.
- End-User Demographics: Aging populations and increasing awareness of sleep disorders fuel market growth.
- M&A Trends: xx M&A deals in the last 5 years, primarily focused on expanding product portfolios and geographical reach.
Sleep Apnea Devices Industry Growth Trends & Insights
The global sleep apnea devices market exhibits significant growth, driven by increasing prevalence of sleep apnea, rising healthcare expenditure, and technological advancements. The market witnessed a CAGR of xx% during the historical period (2019-2024) and is projected to maintain a CAGR of xx% during the forecast period (2025-2033), reaching a market size of xx million units by 2033. This growth is fueled by factors such as increased awareness of sleep apnea, technological advancements leading to improved device efficacy and comfort, and rising healthcare expenditure. The adoption rate of sleep apnea devices is increasing gradually, driven by better access to diagnosis and treatment and a growing understanding of the health consequences of untreated sleep apnea. However, challenges such as high device costs and potential side effects can impact market penetration. Consumer behavior is shifting towards preference for user-friendly, technologically advanced devices with enhanced comfort and remote monitoring capabilities.
Dominant Regions, Countries, or Segments in Sleep Apnea Devices Industry
North America currently dominates the sleep apnea devices market, driven by high prevalence of sleep apnea, robust healthcare infrastructure, and high disposable incomes. Within North America, the United States holds the largest market share. Europe follows as the second-largest market, driven by growing awareness of sleep disorders and increasing adoption of advanced therapies. The Asia-Pacific region shows significant growth potential, driven by rising disposable incomes, improving healthcare infrastructure, and increasing prevalence of sleep apnea.
- Leading Region: North America (holds approximately xx% market share in 2024)
- Key Country: United States
- Dominant Product Type: PAP devices (holds approximately xx% market share in 2024)
- Dominant Application: Sleep apnea (holds approximately xx% market share in 2024)
- Growth Drivers: Increasing prevalence of sleep apnea, rising healthcare expenditure, improved access to diagnostics and treatment, and technological advancements.
Sleep Apnea Devices Industry Product Landscape
The sleep apnea devices market offers a diverse range of products, including PAP (Positive Airway Pressure) devices (CPAP and BiPAP), oral appliances, oxygen devices, and ASV (Adaptive Servo-Ventilation) devices, along with masks and accessories. Recent innovations focus on smaller, quieter, and more comfortable devices, incorporating features like heated humidification, automatic pressure adjustments, and data connectivity for remote monitoring. These advancements enhance patient compliance and treatment efficacy. Unique selling propositions include improved comfort, data-driven insights for personalized treatment, and seamless integration with telehealth platforms.
Key Drivers, Barriers & Challenges in Sleep Apnea Devices Industry
Key Drivers:
- Rising prevalence of sleep apnea globally.
- Technological advancements leading to more comfortable and effective devices.
- Growing awareness and increased diagnosis rates.
- Rising healthcare expenditure and insurance coverage.
Key Challenges:
- High cost of devices, limiting affordability and accessibility.
- Potential side effects associated with some devices (e.g., claustrophobia with CPAP).
- Complex regulatory pathways and reimbursement challenges.
- Competition from alternative treatment options.
Emerging Opportunities in Sleep Apnea Devices Industry
Emerging opportunities lie in untapped markets (e.g., developing economies), innovative applications (e.g., integration with smart home technology), and evolving consumer preferences (e.g., demand for personalized and convenient treatment). The development of AI-powered diagnostic tools and the integration of telehealth platforms offer significant potential for improved patient care and market expansion. Furthermore, focus on pediatric sleep apnea devices presents a significant growth opportunity.
Growth Accelerators in the Sleep Apnea Devices Industry
Technological breakthroughs in areas like sensor technology, AI-driven diagnostics, and miniaturization are key growth accelerators. Strategic partnerships between device manufacturers and healthcare providers are vital to improve access and affordability. Market expansion strategies targeting underserved populations and regions are also critical for long-term growth.
Key Players Shaping the Sleep Apnea Devices Industry Market
- Natus Medical Incorporated
- Invacare Corporation
- Cadwell Laboratories Inc
- GE Healthcare
- Vyaire Medical Inc
- Resmed
- Oventus Medical
- Fisher & Paykel Healthcare Limited
- Koninklijke Philips NV
- Somnomed
- Teleflex Incorporated
- Nihon Kohden Corporation
Notable Milestones in Sleep Apnea Devices Industry Sector
- November 2022: ResMed and Verily announced the formation of Primasun, focusing on early identification of sleep disorders.
- October 2022: Airway Management launched flexTAP, a premium oral appliance for snoring and mild to moderate sleep apnea.
In-Depth Sleep Apnea Devices Industry Market Outlook
The sleep apnea devices market is poised for continued growth, driven by technological advancements, increasing awareness, and expanding healthcare access. Strategic partnerships and innovative product development will be crucial for success in this dynamic market. Focus on improving affordability and accessibility, especially in developing economies, will be key to unlocking the full market potential. The emergence of new diagnostic tools and personalized treatment options will further propel market growth in the coming years.
Sleep Apnea Devices Industry Segmentation
-
1. Diagnostic Devices
- 1.1. Polysomnography Devices (PSG)
- 1.2. Pulse Oximeters
- 1.3. Actigraphy Devices
-
2. Therapeutic Devices
-
2.1. Positive Airway Pressure (PAP) Devices
- 2.1.1. Continuous Positive Airway Pressure (CPAP) Devices
- 2.1.2. Bi-level Positive Airway Pressure (BiPAP) Devices
-
2.2. Oxygen Devices
- 2.2.1. Oxygen Concentrators
- 2.2.2. Portable Oxygen Concentrators
- 2.2.3. Liquid Portable Oxygen
- 2.3. Oral Appliances
- 2.4. Adaptive Servo Ventilation (ASV) Devices
- 2.5. Masks and Accessories
-
2.1. Positive Airway Pressure (PAP) Devices
Sleep Apnea Devices Industry Segmentation By Geography
-
1. North America
- 1.1. United States
- 1.2. Canada
- 1.3. Mexico
-
2. Europe
- 2.1. Germany
- 2.2. United Kingdom
- 2.3. France
- 2.4. Italy
- 2.5. Spain
- 2.6. Rest of Europe
-
3. Asia Pacific
- 3.1. China
- 3.2. Japan
- 3.3. India
- 3.4. Australia
- 3.5. South Korea
- 3.6. Rest of Asia Pacific
-
4. Middle East and Africa
- 4.1. GCC
- 4.2. South Africa
- 4.3. Rest of Middle East and Africa
-
5. South America
- 5.1. Brazil
- 5.2. Argentina
- 5.3. Rest of South America
Sleep Apnea Devices Industry REPORT HIGHLIGHTS
| Aspects | Details |
|---|---|
| Study Period | 2019-2033 |
| Base Year | 2024 |
| Estimated Year | 2025 |
| Forecast Period | 2025-2033 |
| Historical Period | 2019-2024 |
| Growth Rate | CAGR of 7.33% from 2019-2033 |
| Segmentation |
|
Table of Contents
- 1. Introduction
- 1.1. Research Scope
- 1.2. Market Segmentation
- 1.3. Research Methodology
- 1.4. Definitions and Assumptions
- 2. Executive Summary
- 2.1. Introduction
- 3. Market Dynamics
- 3.1. Introduction
- 3.2. Market Drivers
- 3.2.1. Increasing Awareness Among the Patient Population in the Developing Countries; Increase in Prevalence of Obesity and Hypertension; Upcoming Technological Advancements
- 3.3. Market Restrains
- 3.3.1. High Cost of Cpap Machines
- 3.4. Market Trends
- 3.4.1. Pulse Oximeters are Expected to Register the Highest CAGR in the Diagnostic Devices Category
- 4. Market Factor Analysis
- 4.1. Porters Five Forces
- 4.2. Supply/Value Chain
- 4.3. PESTEL analysis
- 4.4. Market Entropy
- 4.5. Patent/Trademark Analysis
- 5. Global Sleep Apnea Devices Industry Analysis, Insights and Forecast, 2019-2031
- 5.1. Market Analysis, Insights and Forecast - by Diagnostic Devices
- 5.1.1. Polysomnography Devices (PSG)
- 5.1.2. Pulse Oximeters
- 5.1.3. Actigraphy Devices
- 5.2. Market Analysis, Insights and Forecast - by Therapeutic Devices
- 5.2.1. Positive Airway Pressure (PAP) Devices
- 5.2.1.1. Continuous Positive Airway Pressure (CPAP) Devices
- 5.2.1.2. Bi-level Positive Airway Pressure (BiPAP) Devices
- 5.2.2. Oxygen Devices
- 5.2.2.1. Oxygen Concentrators
- 5.2.2.2. Portable Oxygen Concentrators
- 5.2.2.3. Liquid Portable Oxygen
- 5.2.3. Oral Appliances
- 5.2.4. Adaptive Servo Ventilation (ASV) Devices
- 5.2.5. Masks and Accessories
- 5.2.1. Positive Airway Pressure (PAP) Devices
- 5.3. Market Analysis, Insights and Forecast - by Region
- 5.3.1. North America
- 5.3.2. Europe
- 5.3.3. Asia Pacific
- 5.3.4. Middle East and Africa
- 5.3.5. South America
- 5.1. Market Analysis, Insights and Forecast - by Diagnostic Devices
- 6. North America Sleep Apnea Devices Industry Analysis, Insights and Forecast, 2019-2031
- 6.1. Market Analysis, Insights and Forecast - by Diagnostic Devices
- 6.1.1. Polysomnography Devices (PSG)
- 6.1.2. Pulse Oximeters
- 6.1.3. Actigraphy Devices
- 6.2. Market Analysis, Insights and Forecast - by Therapeutic Devices
- 6.2.1. Positive Airway Pressure (PAP) Devices
- 6.2.1.1. Continuous Positive Airway Pressure (CPAP) Devices
- 6.2.1.2. Bi-level Positive Airway Pressure (BiPAP) Devices
- 6.2.2. Oxygen Devices
- 6.2.2.1. Oxygen Concentrators
- 6.2.2.2. Portable Oxygen Concentrators
- 6.2.2.3. Liquid Portable Oxygen
- 6.2.3. Oral Appliances
- 6.2.4. Adaptive Servo Ventilation (ASV) Devices
- 6.2.5. Masks and Accessories
- 6.2.1. Positive Airway Pressure (PAP) Devices
- 6.1. Market Analysis, Insights and Forecast - by Diagnostic Devices
- 7. Europe Sleep Apnea Devices Industry Analysis, Insights and Forecast, 2019-2031
- 7.1. Market Analysis, Insights and Forecast - by Diagnostic Devices
- 7.1.1. Polysomnography Devices (PSG)
- 7.1.2. Pulse Oximeters
- 7.1.3. Actigraphy Devices
- 7.2. Market Analysis, Insights and Forecast - by Therapeutic Devices
- 7.2.1. Positive Airway Pressure (PAP) Devices
- 7.2.1.1. Continuous Positive Airway Pressure (CPAP) Devices
- 7.2.1.2. Bi-level Positive Airway Pressure (BiPAP) Devices
- 7.2.2. Oxygen Devices
- 7.2.2.1. Oxygen Concentrators
- 7.2.2.2. Portable Oxygen Concentrators
- 7.2.2.3. Liquid Portable Oxygen
- 7.2.3. Oral Appliances
- 7.2.4. Adaptive Servo Ventilation (ASV) Devices
- 7.2.5. Masks and Accessories
- 7.2.1. Positive Airway Pressure (PAP) Devices
- 7.1. Market Analysis, Insights and Forecast - by Diagnostic Devices
- 8. Asia Pacific Sleep Apnea Devices Industry Analysis, Insights and Forecast, 2019-2031
- 8.1. Market Analysis, Insights and Forecast - by Diagnostic Devices
- 8.1.1. Polysomnography Devices (PSG)
- 8.1.2. Pulse Oximeters
- 8.1.3. Actigraphy Devices
- 8.2. Market Analysis, Insights and Forecast - by Therapeutic Devices
- 8.2.1. Positive Airway Pressure (PAP) Devices
- 8.2.1.1. Continuous Positive Airway Pressure (CPAP) Devices
- 8.2.1.2. Bi-level Positive Airway Pressure (BiPAP) Devices
- 8.2.2. Oxygen Devices
- 8.2.2.1. Oxygen Concentrators
- 8.2.2.2. Portable Oxygen Concentrators
- 8.2.2.3. Liquid Portable Oxygen
- 8.2.3. Oral Appliances
- 8.2.4. Adaptive Servo Ventilation (ASV) Devices
- 8.2.5. Masks and Accessories
- 8.2.1. Positive Airway Pressure (PAP) Devices
- 8.1. Market Analysis, Insights and Forecast - by Diagnostic Devices
- 9. Middle East and Africa Sleep Apnea Devices Industry Analysis, Insights and Forecast, 2019-2031
- 9.1. Market Analysis, Insights and Forecast - by Diagnostic Devices
- 9.1.1. Polysomnography Devices (PSG)
- 9.1.2. Pulse Oximeters
- 9.1.3. Actigraphy Devices
- 9.2. Market Analysis, Insights and Forecast - by Therapeutic Devices
- 9.2.1. Positive Airway Pressure (PAP) Devices
- 9.2.1.1. Continuous Positive Airway Pressure (CPAP) Devices
- 9.2.1.2. Bi-level Positive Airway Pressure (BiPAP) Devices
- 9.2.2. Oxygen Devices
- 9.2.2.1. Oxygen Concentrators
- 9.2.2.2. Portable Oxygen Concentrators
- 9.2.2.3. Liquid Portable Oxygen
- 9.2.3. Oral Appliances
- 9.2.4. Adaptive Servo Ventilation (ASV) Devices
- 9.2.5. Masks and Accessories
- 9.2.1. Positive Airway Pressure (PAP) Devices
- 9.1. Market Analysis, Insights and Forecast - by Diagnostic Devices
- 10. South America Sleep Apnea Devices Industry Analysis, Insights and Forecast, 2019-2031
- 10.1. Market Analysis, Insights and Forecast - by Diagnostic Devices
- 10.1.1. Polysomnography Devices (PSG)
- 10.1.2. Pulse Oximeters
- 10.1.3. Actigraphy Devices
- 10.2. Market Analysis, Insights and Forecast - by Therapeutic Devices
- 10.2.1. Positive Airway Pressure (PAP) Devices
- 10.2.1.1. Continuous Positive Airway Pressure (CPAP) Devices
- 10.2.1.2. Bi-level Positive Airway Pressure (BiPAP) Devices
- 10.2.2. Oxygen Devices
- 10.2.2.1. Oxygen Concentrators
- 10.2.2.2. Portable Oxygen Concentrators
- 10.2.2.3. Liquid Portable Oxygen
- 10.2.3. Oral Appliances
- 10.2.4. Adaptive Servo Ventilation (ASV) Devices
- 10.2.5. Masks and Accessories
- 10.2.1. Positive Airway Pressure (PAP) Devices
- 10.1. Market Analysis, Insights and Forecast - by Diagnostic Devices
- 11. North America Sleep Apnea Devices Industry Analysis, Insights and Forecast, 2019-2031
- 11.1. Market Analysis, Insights and Forecast - By Country/Sub-region
- 11.1.1 United States
- 11.1.2 Canada
- 11.1.3 Mexico
- 12. Europe Sleep Apnea Devices Industry Analysis, Insights and Forecast, 2019-2031
- 12.1. Market Analysis, Insights and Forecast - By Country/Sub-region
- 12.1.1 Germany
- 12.1.2 United Kingdom
- 12.1.3 France
- 12.1.4 Italy
- 12.1.5 Spain
- 12.1.6 Rest of Europe
- 13. Asia Pacific Sleep Apnea Devices Industry Analysis, Insights and Forecast, 2019-2031
- 13.1. Market Analysis, Insights and Forecast - By Country/Sub-region
- 13.1.1 China
- 13.1.2 Japan
- 13.1.3 India
- 13.1.4 Australia
- 13.1.5 South Korea
- 13.1.6 Rest of Asia Pacific
- 14. Middle East and Africa Sleep Apnea Devices Industry Analysis, Insights and Forecast, 2019-2031
- 14.1. Market Analysis, Insights and Forecast - By Country/Sub-region
- 14.1.1 GCC
- 14.1.2 South Africa
- 14.1.3 Rest of Middle East and Africa
- 15. South America Sleep Apnea Devices Industry Analysis, Insights and Forecast, 2019-2031
- 15.1. Market Analysis, Insights and Forecast - By Country/Sub-region
- 15.1.1 Brazil
- 15.1.2 Argentina
- 15.1.3 Rest of South America
- 16. Competitive Analysis
- 16.1. Global Market Share Analysis 2024
- 16.2. Company Profiles
- 16.2.1 Natus Medical Incorporated
- 16.2.1.1. Overview
- 16.2.1.2. Products
- 16.2.1.3. SWOT Analysis
- 16.2.1.4. Recent Developments
- 16.2.1.5. Financials (Based on Availability)
- 16.2.2 Invacare Corporation
- 16.2.2.1. Overview
- 16.2.2.2. Products
- 16.2.2.3. SWOT Analysis
- 16.2.2.4. Recent Developments
- 16.2.2.5. Financials (Based on Availability)
- 16.2.3 Cadwell Laboratories Inc
- 16.2.3.1. Overview
- 16.2.3.2. Products
- 16.2.3.3. SWOT Analysis
- 16.2.3.4. Recent Developments
- 16.2.3.5. Financials (Based on Availability)
- 16.2.4 GE Healthcare
- 16.2.4.1. Overview
- 16.2.4.2. Products
- 16.2.4.3. SWOT Analysis
- 16.2.4.4. Recent Developments
- 16.2.4.5. Financials (Based on Availability)
- 16.2.5 Vyaire Medical Inc
- 16.2.5.1. Overview
- 16.2.5.2. Products
- 16.2.5.3. SWOT Analysis
- 16.2.5.4. Recent Developments
- 16.2.5.5. Financials (Based on Availability)
- 16.2.6 Resmed
- 16.2.6.1. Overview
- 16.2.6.2. Products
- 16.2.6.3. SWOT Analysis
- 16.2.6.4. Recent Developments
- 16.2.6.5. Financials (Based on Availability)
- 16.2.7 Oventus Medical
- 16.2.7.1. Overview
- 16.2.7.2. Products
- 16.2.7.3. SWOT Analysis
- 16.2.7.4. Recent Developments
- 16.2.7.5. Financials (Based on Availability)
- 16.2.8 Fisher & Paykel Healthcare Limited
- 16.2.8.1. Overview
- 16.2.8.2. Products
- 16.2.8.3. SWOT Analysis
- 16.2.8.4. Recent Developments
- 16.2.8.5. Financials (Based on Availability)
- 16.2.9 Koninklijke Philips NV
- 16.2.9.1. Overview
- 16.2.9.2. Products
- 16.2.9.3. SWOT Analysis
- 16.2.9.4. Recent Developments
- 16.2.9.5. Financials (Based on Availability)
- 16.2.10 Somnomed
- 16.2.10.1. Overview
- 16.2.10.2. Products
- 16.2.10.3. SWOT Analysis
- 16.2.10.4. Recent Developments
- 16.2.10.5. Financials (Based on Availability)
- 16.2.11 Teleflex Incorporated
- 16.2.11.1. Overview
- 16.2.11.2. Products
- 16.2.11.3. SWOT Analysis
- 16.2.11.4. Recent Developments
- 16.2.11.5. Financials (Based on Availability)
- 16.2.12 Nihon Kohden Corporation
- 16.2.12.1. Overview
- 16.2.12.2. Products
- 16.2.12.3. SWOT Analysis
- 16.2.12.4. Recent Developments
- 16.2.12.5. Financials (Based on Availability)
- 16.2.1 Natus Medical Incorporated
List of Figures
- Figure 1: Global Sleep Apnea Devices Industry Revenue Breakdown (Million, %) by Region 2024 & 2032
- Figure 2: Global Sleep Apnea Devices Industry Volume Breakdown (K Unit, %) by Region 2024 & 2032
- Figure 3: North America Sleep Apnea Devices Industry Revenue (Million), by Country 2024 & 2032
- Figure 4: North America Sleep Apnea Devices Industry Volume (K Unit), by Country 2024 & 2032
- Figure 5: North America Sleep Apnea Devices Industry Revenue Share (%), by Country 2024 & 2032
- Figure 6: North America Sleep Apnea Devices Industry Volume Share (%), by Country 2024 & 2032
- Figure 7: Europe Sleep Apnea Devices Industry Revenue (Million), by Country 2024 & 2032
- Figure 8: Europe Sleep Apnea Devices Industry Volume (K Unit), by Country 2024 & 2032
- Figure 9: Europe Sleep Apnea Devices Industry Revenue Share (%), by Country 2024 & 2032
- Figure 10: Europe Sleep Apnea Devices Industry Volume Share (%), by Country 2024 & 2032
- Figure 11: Asia Pacific Sleep Apnea Devices Industry Revenue (Million), by Country 2024 & 2032
- Figure 12: Asia Pacific Sleep Apnea Devices Industry Volume (K Unit), by Country 2024 & 2032
- Figure 13: Asia Pacific Sleep Apnea Devices Industry Revenue Share (%), by Country 2024 & 2032
- Figure 14: Asia Pacific Sleep Apnea Devices Industry Volume Share (%), by Country 2024 & 2032
- Figure 15: Middle East and Africa Sleep Apnea Devices Industry Revenue (Million), by Country 2024 & 2032
- Figure 16: Middle East and Africa Sleep Apnea Devices Industry Volume (K Unit), by Country 2024 & 2032
- Figure 17: Middle East and Africa Sleep Apnea Devices Industry Revenue Share (%), by Country 2024 & 2032
- Figure 18: Middle East and Africa Sleep Apnea Devices Industry Volume Share (%), by Country 2024 & 2032
- Figure 19: South America Sleep Apnea Devices Industry Revenue (Million), by Country 2024 & 2032
- Figure 20: South America Sleep Apnea Devices Industry Volume (K Unit), by Country 2024 & 2032
- Figure 21: South America Sleep Apnea Devices Industry Revenue Share (%), by Country 2024 & 2032
- Figure 22: South America Sleep Apnea Devices Industry Volume Share (%), by Country 2024 & 2032
- Figure 23: North America Sleep Apnea Devices Industry Revenue (Million), by Diagnostic Devices 2024 & 2032
- Figure 24: North America Sleep Apnea Devices Industry Volume (K Unit), by Diagnostic Devices 2024 & 2032
- Figure 25: North America Sleep Apnea Devices Industry Revenue Share (%), by Diagnostic Devices 2024 & 2032
- Figure 26: North America Sleep Apnea Devices Industry Volume Share (%), by Diagnostic Devices 2024 & 2032
- Figure 27: North America Sleep Apnea Devices Industry Revenue (Million), by Therapeutic Devices 2024 & 2032
- Figure 28: North America Sleep Apnea Devices Industry Volume (K Unit), by Therapeutic Devices 2024 & 2032
- Figure 29: North America Sleep Apnea Devices Industry Revenue Share (%), by Therapeutic Devices 2024 & 2032
- Figure 30: North America Sleep Apnea Devices Industry Volume Share (%), by Therapeutic Devices 2024 & 2032
- Figure 31: North America Sleep Apnea Devices Industry Revenue (Million), by Country 2024 & 2032
- Figure 32: North America Sleep Apnea Devices Industry Volume (K Unit), by Country 2024 & 2032
- Figure 33: North America Sleep Apnea Devices Industry Revenue Share (%), by Country 2024 & 2032
- Figure 34: North America Sleep Apnea Devices Industry Volume Share (%), by Country 2024 & 2032
- Figure 35: Europe Sleep Apnea Devices Industry Revenue (Million), by Diagnostic Devices 2024 & 2032
- Figure 36: Europe Sleep Apnea Devices Industry Volume (K Unit), by Diagnostic Devices 2024 & 2032
- Figure 37: Europe Sleep Apnea Devices Industry Revenue Share (%), by Diagnostic Devices 2024 & 2032
- Figure 38: Europe Sleep Apnea Devices Industry Volume Share (%), by Diagnostic Devices 2024 & 2032
- Figure 39: Europe Sleep Apnea Devices Industry Revenue (Million), by Therapeutic Devices 2024 & 2032
- Figure 40: Europe Sleep Apnea Devices Industry Volume (K Unit), by Therapeutic Devices 2024 & 2032
- Figure 41: Europe Sleep Apnea Devices Industry Revenue Share (%), by Therapeutic Devices 2024 & 2032
- Figure 42: Europe Sleep Apnea Devices Industry Volume Share (%), by Therapeutic Devices 2024 & 2032
- Figure 43: Europe Sleep Apnea Devices Industry Revenue (Million), by Country 2024 & 2032
- Figure 44: Europe Sleep Apnea Devices Industry Volume (K Unit), by Country 2024 & 2032
- Figure 45: Europe Sleep Apnea Devices Industry Revenue Share (%), by Country 2024 & 2032
- Figure 46: Europe Sleep Apnea Devices Industry Volume Share (%), by Country 2024 & 2032
- Figure 47: Asia Pacific Sleep Apnea Devices Industry Revenue (Million), by Diagnostic Devices 2024 & 2032
- Figure 48: Asia Pacific Sleep Apnea Devices Industry Volume (K Unit), by Diagnostic Devices 2024 & 2032
- Figure 49: Asia Pacific Sleep Apnea Devices Industry Revenue Share (%), by Diagnostic Devices 2024 & 2032
- Figure 50: Asia Pacific Sleep Apnea Devices Industry Volume Share (%), by Diagnostic Devices 2024 & 2032
- Figure 51: Asia Pacific Sleep Apnea Devices Industry Revenue (Million), by Therapeutic Devices 2024 & 2032
- Figure 52: Asia Pacific Sleep Apnea Devices Industry Volume (K Unit), by Therapeutic Devices 2024 & 2032
- Figure 53: Asia Pacific Sleep Apnea Devices Industry Revenue Share (%), by Therapeutic Devices 2024 & 2032
- Figure 54: Asia Pacific Sleep Apnea Devices Industry Volume Share (%), by Therapeutic Devices 2024 & 2032
- Figure 55: Asia Pacific Sleep Apnea Devices Industry Revenue (Million), by Country 2024 & 2032
- Figure 56: Asia Pacific Sleep Apnea Devices Industry Volume (K Unit), by Country 2024 & 2032
- Figure 57: Asia Pacific Sleep Apnea Devices Industry Revenue Share (%), by Country 2024 & 2032
- Figure 58: Asia Pacific Sleep Apnea Devices Industry Volume Share (%), by Country 2024 & 2032
- Figure 59: Middle East and Africa Sleep Apnea Devices Industry Revenue (Million), by Diagnostic Devices 2024 & 2032
- Figure 60: Middle East and Africa Sleep Apnea Devices Industry Volume (K Unit), by Diagnostic Devices 2024 & 2032
- Figure 61: Middle East and Africa Sleep Apnea Devices Industry Revenue Share (%), by Diagnostic Devices 2024 & 2032
- Figure 62: Middle East and Africa Sleep Apnea Devices Industry Volume Share (%), by Diagnostic Devices 2024 & 2032
- Figure 63: Middle East and Africa Sleep Apnea Devices Industry Revenue (Million), by Therapeutic Devices 2024 & 2032
- Figure 64: Middle East and Africa Sleep Apnea Devices Industry Volume (K Unit), by Therapeutic Devices 2024 & 2032
- Figure 65: Middle East and Africa Sleep Apnea Devices Industry Revenue Share (%), by Therapeutic Devices 2024 & 2032
- Figure 66: Middle East and Africa Sleep Apnea Devices Industry Volume Share (%), by Therapeutic Devices 2024 & 2032
- Figure 67: Middle East and Africa Sleep Apnea Devices Industry Revenue (Million), by Country 2024 & 2032
- Figure 68: Middle East and Africa Sleep Apnea Devices Industry Volume (K Unit), by Country 2024 & 2032
- Figure 69: Middle East and Africa Sleep Apnea Devices Industry Revenue Share (%), by Country 2024 & 2032
- Figure 70: Middle East and Africa Sleep Apnea Devices Industry Volume Share (%), by Country 2024 & 2032
- Figure 71: South America Sleep Apnea Devices Industry Revenue (Million), by Diagnostic Devices 2024 & 2032
- Figure 72: South America Sleep Apnea Devices Industry Volume (K Unit), by Diagnostic Devices 2024 & 2032
- Figure 73: South America Sleep Apnea Devices Industry Revenue Share (%), by Diagnostic Devices 2024 & 2032
- Figure 74: South America Sleep Apnea Devices Industry Volume Share (%), by Diagnostic Devices 2024 & 2032
- Figure 75: South America Sleep Apnea Devices Industry Revenue (Million), by Therapeutic Devices 2024 & 2032
- Figure 76: South America Sleep Apnea Devices Industry Volume (K Unit), by Therapeutic Devices 2024 & 2032
- Figure 77: South America Sleep Apnea Devices Industry Revenue Share (%), by Therapeutic Devices 2024 & 2032
- Figure 78: South America Sleep Apnea Devices Industry Volume Share (%), by Therapeutic Devices 2024 & 2032
- Figure 79: South America Sleep Apnea Devices Industry Revenue (Million), by Country 2024 & 2032
- Figure 80: South America Sleep Apnea Devices Industry Volume (K Unit), by Country 2024 & 2032
- Figure 81: South America Sleep Apnea Devices Industry Revenue Share (%), by Country 2024 & 2032
- Figure 82: South America Sleep Apnea Devices Industry Volume Share (%), by Country 2024 & 2032
List of Tables
- Table 1: Global Sleep Apnea Devices Industry Revenue Million Forecast, by Region 2019 & 2032
- Table 2: Global Sleep Apnea Devices Industry Volume K Unit Forecast, by Region 2019 & 2032
- Table 3: Global Sleep Apnea Devices Industry Revenue Million Forecast, by Diagnostic Devices 2019 & 2032
- Table 4: Global Sleep Apnea Devices Industry Volume K Unit Forecast, by Diagnostic Devices 2019 & 2032
- Table 5: Global Sleep Apnea Devices Industry Revenue Million Forecast, by Therapeutic Devices 2019 & 2032
- Table 6: Global Sleep Apnea Devices Industry Volume K Unit Forecast, by Therapeutic Devices 2019 & 2032
- Table 7: Global Sleep Apnea Devices Industry Revenue Million Forecast, by Region 2019 & 2032
- Table 8: Global Sleep Apnea Devices Industry Volume K Unit Forecast, by Region 2019 & 2032
- Table 9: Global Sleep Apnea Devices Industry Revenue Million Forecast, by Country 2019 & 2032
- Table 10: Global Sleep Apnea Devices Industry Volume K Unit Forecast, by Country 2019 & 2032
- Table 11: United States Sleep Apnea Devices Industry Revenue (Million) Forecast, by Application 2019 & 2032
- Table 12: United States Sleep Apnea Devices Industry Volume (K Unit) Forecast, by Application 2019 & 2032
- Table 13: Canada Sleep Apnea Devices Industry Revenue (Million) Forecast, by Application 2019 & 2032
- Table 14: Canada Sleep Apnea Devices Industry Volume (K Unit) Forecast, by Application 2019 & 2032
- Table 15: Mexico Sleep Apnea Devices Industry Revenue (Million) Forecast, by Application 2019 & 2032
- Table 16: Mexico Sleep Apnea Devices Industry Volume (K Unit) Forecast, by Application 2019 & 2032
- Table 17: Global Sleep Apnea Devices Industry Revenue Million Forecast, by Country 2019 & 2032
- Table 18: Global Sleep Apnea Devices Industry Volume K Unit Forecast, by Country 2019 & 2032
- Table 19: Germany Sleep Apnea Devices Industry Revenue (Million) Forecast, by Application 2019 & 2032
- Table 20: Germany Sleep Apnea Devices Industry Volume (K Unit) Forecast, by Application 2019 & 2032
- Table 21: United Kingdom Sleep Apnea Devices Industry Revenue (Million) Forecast, by Application 2019 & 2032
- Table 22: United Kingdom Sleep Apnea Devices Industry Volume (K Unit) Forecast, by Application 2019 & 2032
- Table 23: France Sleep Apnea Devices Industry Revenue (Million) Forecast, by Application 2019 & 2032
- Table 24: France Sleep Apnea Devices Industry Volume (K Unit) Forecast, by Application 2019 & 2032
- Table 25: Italy Sleep Apnea Devices Industry Revenue (Million) Forecast, by Application 2019 & 2032
- Table 26: Italy Sleep Apnea Devices Industry Volume (K Unit) Forecast, by Application 2019 & 2032
- Table 27: Spain Sleep Apnea Devices Industry Revenue (Million) Forecast, by Application 2019 & 2032
- Table 28: Spain Sleep Apnea Devices Industry Volume (K Unit) Forecast, by Application 2019 & 2032
- Table 29: Rest of Europe Sleep Apnea Devices Industry Revenue (Million) Forecast, by Application 2019 & 2032
- Table 30: Rest of Europe Sleep Apnea Devices Industry Volume (K Unit) Forecast, by Application 2019 & 2032
- Table 31: Global Sleep Apnea Devices Industry Revenue Million Forecast, by Country 2019 & 2032
- Table 32: Global Sleep Apnea Devices Industry Volume K Unit Forecast, by Country 2019 & 2032
- Table 33: China Sleep Apnea Devices Industry Revenue (Million) Forecast, by Application 2019 & 2032
- Table 34: China Sleep Apnea Devices Industry Volume (K Unit) Forecast, by Application 2019 & 2032
- Table 35: Japan Sleep Apnea Devices Industry Revenue (Million) Forecast, by Application 2019 & 2032
- Table 36: Japan Sleep Apnea Devices Industry Volume (K Unit) Forecast, by Application 2019 & 2032
- Table 37: India Sleep Apnea Devices Industry Revenue (Million) Forecast, by Application 2019 & 2032
- Table 38: India Sleep Apnea Devices Industry Volume (K Unit) Forecast, by Application 2019 & 2032
- Table 39: Australia Sleep Apnea Devices Industry Revenue (Million) Forecast, by Application 2019 & 2032
- Table 40: Australia Sleep Apnea Devices Industry Volume (K Unit) Forecast, by Application 2019 & 2032
- Table 41: South Korea Sleep Apnea Devices Industry Revenue (Million) Forecast, by Application 2019 & 2032
- Table 42: South Korea Sleep Apnea Devices Industry Volume (K Unit) Forecast, by Application 2019 & 2032
- Table 43: Rest of Asia Pacific Sleep Apnea Devices Industry Revenue (Million) Forecast, by Application 2019 & 2032
- Table 44: Rest of Asia Pacific Sleep Apnea Devices Industry Volume (K Unit) Forecast, by Application 2019 & 2032
- Table 45: Global Sleep Apnea Devices Industry Revenue Million Forecast, by Country 2019 & 2032
- Table 46: Global Sleep Apnea Devices Industry Volume K Unit Forecast, by Country 2019 & 2032
- Table 47: GCC Sleep Apnea Devices Industry Revenue (Million) Forecast, by Application 2019 & 2032
- Table 48: GCC Sleep Apnea Devices Industry Volume (K Unit) Forecast, by Application 2019 & 2032
- Table 49: South Africa Sleep Apnea Devices Industry Revenue (Million) Forecast, by Application 2019 & 2032
- Table 50: South Africa Sleep Apnea Devices Industry Volume (K Unit) Forecast, by Application 2019 & 2032
- Table 51: Rest of Middle East and Africa Sleep Apnea Devices Industry Revenue (Million) Forecast, by Application 2019 & 2032
- Table 52: Rest of Middle East and Africa Sleep Apnea Devices Industry Volume (K Unit) Forecast, by Application 2019 & 2032
- Table 53: Global Sleep Apnea Devices Industry Revenue Million Forecast, by Country 2019 & 2032
- Table 54: Global Sleep Apnea Devices Industry Volume K Unit Forecast, by Country 2019 & 2032
- Table 55: Brazil Sleep Apnea Devices Industry Revenue (Million) Forecast, by Application 2019 & 2032
- Table 56: Brazil Sleep Apnea Devices Industry Volume (K Unit) Forecast, by Application 2019 & 2032
- Table 57: Argentina Sleep Apnea Devices Industry Revenue (Million) Forecast, by Application 2019 & 2032
- Table 58: Argentina Sleep Apnea Devices Industry Volume (K Unit) Forecast, by Application 2019 & 2032
- Table 59: Rest of South America Sleep Apnea Devices Industry Revenue (Million) Forecast, by Application 2019 & 2032
- Table 60: Rest of South America Sleep Apnea Devices Industry Volume (K Unit) Forecast, by Application 2019 & 2032
- Table 61: Global Sleep Apnea Devices Industry Revenue Million Forecast, by Diagnostic Devices 2019 & 2032
- Table 62: Global Sleep Apnea Devices Industry Volume K Unit Forecast, by Diagnostic Devices 2019 & 2032
- Table 63: Global Sleep Apnea Devices Industry Revenue Million Forecast, by Therapeutic Devices 2019 & 2032
- Table 64: Global Sleep Apnea Devices Industry Volume K Unit Forecast, by Therapeutic Devices 2019 & 2032
- Table 65: Global Sleep Apnea Devices Industry Revenue Million Forecast, by Country 2019 & 2032
- Table 66: Global Sleep Apnea Devices Industry Volume K Unit Forecast, by Country 2019 & 2032
- Table 67: United States Sleep Apnea Devices Industry Revenue (Million) Forecast, by Application 2019 & 2032
- Table 68: United States Sleep Apnea Devices Industry Volume (K Unit) Forecast, by Application 2019 & 2032
- Table 69: Canada Sleep Apnea Devices Industry Revenue (Million) Forecast, by Application 2019 & 2032
- Table 70: Canada Sleep Apnea Devices Industry Volume (K Unit) Forecast, by Application 2019 & 2032
- Table 71: Mexico Sleep Apnea Devices Industry Revenue (Million) Forecast, by Application 2019 & 2032
- Table 72: Mexico Sleep Apnea Devices Industry Volume (K Unit) Forecast, by Application 2019 & 2032
- Table 73: Global Sleep Apnea Devices Industry Revenue Million Forecast, by Diagnostic Devices 2019 & 2032
- Table 74: Global Sleep Apnea Devices Industry Volume K Unit Forecast, by Diagnostic Devices 2019 & 2032
- Table 75: Global Sleep Apnea Devices Industry Revenue Million Forecast, by Therapeutic Devices 2019 & 2032
- Table 76: Global Sleep Apnea Devices Industry Volume K Unit Forecast, by Therapeutic Devices 2019 & 2032
- Table 77: Global Sleep Apnea Devices Industry Revenue Million Forecast, by Country 2019 & 2032
- Table 78: Global Sleep Apnea Devices Industry Volume K Unit Forecast, by Country 2019 & 2032
- Table 79: Germany Sleep Apnea Devices Industry Revenue (Million) Forecast, by Application 2019 & 2032
- Table 80: Germany Sleep Apnea Devices Industry Volume (K Unit) Forecast, by Application 2019 & 2032
- Table 81: United Kingdom Sleep Apnea Devices Industry Revenue (Million) Forecast, by Application 2019 & 2032
- Table 82: United Kingdom Sleep Apnea Devices Industry Volume (K Unit) Forecast, by Application 2019 & 2032
- Table 83: France Sleep Apnea Devices Industry Revenue (Million) Forecast, by Application 2019 & 2032
- Table 84: France Sleep Apnea Devices Industry Volume (K Unit) Forecast, by Application 2019 & 2032
- Table 85: Italy Sleep Apnea Devices Industry Revenue (Million) Forecast, by Application 2019 & 2032
- Table 86: Italy Sleep Apnea Devices Industry Volume (K Unit) Forecast, by Application 2019 & 2032
- Table 87: Spain Sleep Apnea Devices Industry Revenue (Million) Forecast, by Application 2019 & 2032
- Table 88: Spain Sleep Apnea Devices Industry Volume (K Unit) Forecast, by Application 2019 & 2032
- Table 89: Rest of Europe Sleep Apnea Devices Industry Revenue (Million) Forecast, by Application 2019 & 2032
- Table 90: Rest of Europe Sleep Apnea Devices Industry Volume (K Unit) Forecast, by Application 2019 & 2032
- Table 91: Global Sleep Apnea Devices Industry Revenue Million Forecast, by Diagnostic Devices 2019 & 2032
- Table 92: Global Sleep Apnea Devices Industry Volume K Unit Forecast, by Diagnostic Devices 2019 & 2032
- Table 93: Global Sleep Apnea Devices Industry Revenue Million Forecast, by Therapeutic Devices 2019 & 2032
- Table 94: Global Sleep Apnea Devices Industry Volume K Unit Forecast, by Therapeutic Devices 2019 & 2032
- Table 95: Global Sleep Apnea Devices Industry Revenue Million Forecast, by Country 2019 & 2032
- Table 96: Global Sleep Apnea Devices Industry Volume K Unit Forecast, by Country 2019 & 2032
- Table 97: China Sleep Apnea Devices Industry Revenue (Million) Forecast, by Application 2019 & 2032
- Table 98: China Sleep Apnea Devices Industry Volume (K Unit) Forecast, by Application 2019 & 2032
- Table 99: Japan Sleep Apnea Devices Industry Revenue (Million) Forecast, by Application 2019 & 2032
- Table 100: Japan Sleep Apnea Devices Industry Volume (K Unit) Forecast, by Application 2019 & 2032
- Table 101: India Sleep Apnea Devices Industry Revenue (Million) Forecast, by Application 2019 & 2032
- Table 102: India Sleep Apnea Devices Industry Volume (K Unit) Forecast, by Application 2019 & 2032
- Table 103: Australia Sleep Apnea Devices Industry Revenue (Million) Forecast, by Application 2019 & 2032
- Table 104: Australia Sleep Apnea Devices Industry Volume (K Unit) Forecast, by Application 2019 & 2032
- Table 105: South Korea Sleep Apnea Devices Industry Revenue (Million) Forecast, by Application 2019 & 2032
- Table 106: South Korea Sleep Apnea Devices Industry Volume (K Unit) Forecast, by Application 2019 & 2032
- Table 107: Rest of Asia Pacific Sleep Apnea Devices Industry Revenue (Million) Forecast, by Application 2019 & 2032
- Table 108: Rest of Asia Pacific Sleep Apnea Devices Industry Volume (K Unit) Forecast, by Application 2019 & 2032
- Table 109: Global Sleep Apnea Devices Industry Revenue Million Forecast, by Diagnostic Devices 2019 & 2032
- Table 110: Global Sleep Apnea Devices Industry Volume K Unit Forecast, by Diagnostic Devices 2019 & 2032
- Table 111: Global Sleep Apnea Devices Industry Revenue Million Forecast, by Therapeutic Devices 2019 & 2032
- Table 112: Global Sleep Apnea Devices Industry Volume K Unit Forecast, by Therapeutic Devices 2019 & 2032
- Table 113: Global Sleep Apnea Devices Industry Revenue Million Forecast, by Country 2019 & 2032
- Table 114: Global Sleep Apnea Devices Industry Volume K Unit Forecast, by Country 2019 & 2032
- Table 115: GCC Sleep Apnea Devices Industry Revenue (Million) Forecast, by Application 2019 & 2032
- Table 116: GCC Sleep Apnea Devices Industry Volume (K Unit) Forecast, by Application 2019 & 2032
- Table 117: South Africa Sleep Apnea Devices Industry Revenue (Million) Forecast, by Application 2019 & 2032
- Table 118: South Africa Sleep Apnea Devices Industry Volume (K Unit) Forecast, by Application 2019 & 2032
- Table 119: Rest of Middle East and Africa Sleep Apnea Devices Industry Revenue (Million) Forecast, by Application 2019 & 2032
- Table 120: Rest of Middle East and Africa Sleep Apnea Devices Industry Volume (K Unit) Forecast, by Application 2019 & 2032
- Table 121: Global Sleep Apnea Devices Industry Revenue Million Forecast, by Diagnostic Devices 2019 & 2032
- Table 122: Global Sleep Apnea Devices Industry Volume K Unit Forecast, by Diagnostic Devices 2019 & 2032
- Table 123: Global Sleep Apnea Devices Industry Revenue Million Forecast, by Therapeutic Devices 2019 & 2032
- Table 124: Global Sleep Apnea Devices Industry Volume K Unit Forecast, by Therapeutic Devices 2019 & 2032
- Table 125: Global Sleep Apnea Devices Industry Revenue Million Forecast, by Country 2019 & 2032
- Table 126: Global Sleep Apnea Devices Industry Volume K Unit Forecast, by Country 2019 & 2032
- Table 127: Brazil Sleep Apnea Devices Industry Revenue (Million) Forecast, by Application 2019 & 2032
- Table 128: Brazil Sleep Apnea Devices Industry Volume (K Unit) Forecast, by Application 2019 & 2032
- Table 129: Argentina Sleep Apnea Devices Industry Revenue (Million) Forecast, by Application 2019 & 2032
- Table 130: Argentina Sleep Apnea Devices Industry Volume (K Unit) Forecast, by Application 2019 & 2032
- Table 131: Rest of South America Sleep Apnea Devices Industry Revenue (Million) Forecast, by Application 2019 & 2032
- Table 132: Rest of South America Sleep Apnea Devices Industry Volume (K Unit) Forecast, by Application 2019 & 2032
Frequently Asked Questions
1. What is the projected Compound Annual Growth Rate (CAGR) of the Sleep Apnea Devices Industry?
The projected CAGR is approximately 7.33%.
2. Which companies are prominent players in the Sleep Apnea Devices Industry?
Key companies in the market include Natus Medical Incorporated, Invacare Corporation, Cadwell Laboratories Inc, GE Healthcare, Vyaire Medical Inc, Resmed, Oventus Medical, Fisher & Paykel Healthcare Limited, Koninklijke Philips NV, Somnomed, Teleflex Incorporated, Nihon Kohden Corporation.
3. What are the main segments of the Sleep Apnea Devices Industry?
The market segments include Diagnostic Devices, Therapeutic Devices.
4. Can you provide details about the market size?
The market size is estimated to be USD 8.20 Million as of 2022.
5. What are some drivers contributing to market growth?
Increasing Awareness Among the Patient Population in the Developing Countries; Increase in Prevalence of Obesity and Hypertension; Upcoming Technological Advancements.
6. What are the notable trends driving market growth?
Pulse Oximeters are Expected to Register the Highest CAGR in the Diagnostic Devices Category.
7. Are there any restraints impacting market growth?
High Cost of Cpap Machines.
8. Can you provide examples of recent developments in the market?
In November 2022, ResMed and Alphabet's life science offshoot Verily announced the formation of Primasun, an end-to-end solution to help employers and healthcare providers identify populations at risk for complex sleep disorders.
9. What pricing options are available for accessing the report?
Pricing options include single-user, multi-user, and enterprise licenses priced at USD 4750, USD 5250, and USD 8750 respectively.
10. Is the market size provided in terms of value or volume?
The market size is provided in terms of value, measured in Million and volume, measured in K Unit.
11. Are there any specific market keywords associated with the report?
Yes, the market keyword associated with the report is "Sleep Apnea Devices Industry," which aids in identifying and referencing the specific market segment covered.
12. How do I determine which pricing option suits my needs best?
The pricing options vary based on user requirements and access needs. Individual users may opt for single-user licenses, while businesses requiring broader access may choose multi-user or enterprise licenses for cost-effective access to the report.
13. Are there any additional resources or data provided in the Sleep Apnea Devices Industry report?
While the report offers comprehensive insights, it's advisable to review the specific contents or supplementary materials provided to ascertain if additional resources or data are available.
14. How can I stay updated on further developments or reports in the Sleep Apnea Devices Industry?
To stay informed about further developments, trends, and reports in the Sleep Apnea Devices Industry, consider subscribing to industry newsletters, following relevant companies and organizations, or regularly checking reputable industry news sources and publications.
Methodology
Step 1 - Identification of Relevant Samples Size from Population Database


Step 2 - Approaches for Defining Global Market Size (Value, Volume* & Price*)

Note*: In applicable scenarios
Step 3 - Data Sources
Primary Research
- Web Analytics
- Survey Reports
- Research Institute
- Latest Research Reports
- Opinion Leaders
Secondary Research
- Annual Reports
- White Paper
- Latest Press Release
- Industry Association
- Paid Database
- Investor Presentations

Step 4 - Data Triangulation
Involves using different sources of information in order to increase the validity of a study
These sources are likely to be stakeholders in a program - participants, other researchers, program staff, other community members, and so on.
Then we put all data in single framework & apply various statistical tools to find out the dynamic on the market.
During the analysis stage, feedback from the stakeholder groups would be compared to determine areas of agreement as well as areas of divergence


