
Key Insights
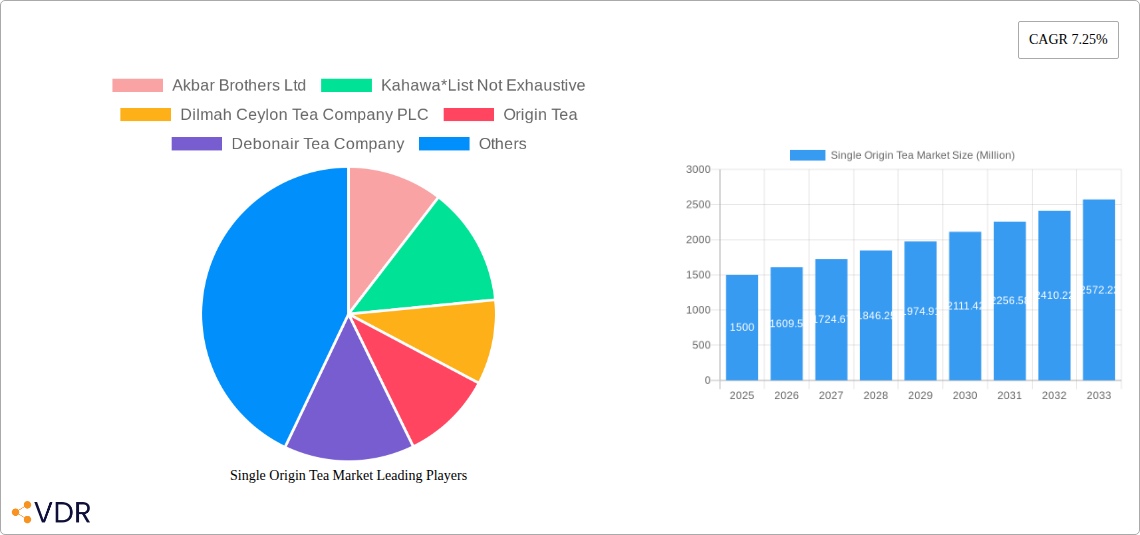
The single-origin tea market, while a segment of a larger tea market exhibiting a 7.25% CAGR, presents a unique opportunity for growth. Driven by increasing consumer awareness of tea's health benefits, a preference for premium and specialty products, and a growing interest in ethically sourced and sustainably produced goods, this niche market is experiencing significant expansion. The rising disposable incomes in developing economies, particularly in Asia-Pacific, further fuel demand for higher-quality teas with distinct flavor profiles characteristic of single-origin varieties. Consumers are increasingly willing to pay a premium for teas with traceable origins, transparent production processes, and unique taste characteristics, differentiating single-origin teas from mass-produced blends. The market's segmentation across tea types (black, green, etc.), packaging (loose leaf, tea bags), and distribution channels (online retail, specialty stores, supermarkets) reflects this evolving consumer preference for choice and convenience. The competitive landscape includes both established international players like Dilmah and Akbar Brothers, alongside smaller, specialized brands focusing on niche single-origin offerings. This suggests a robust and dynamic market where both established and emerging players can thrive by strategically targeting distinct consumer segments.
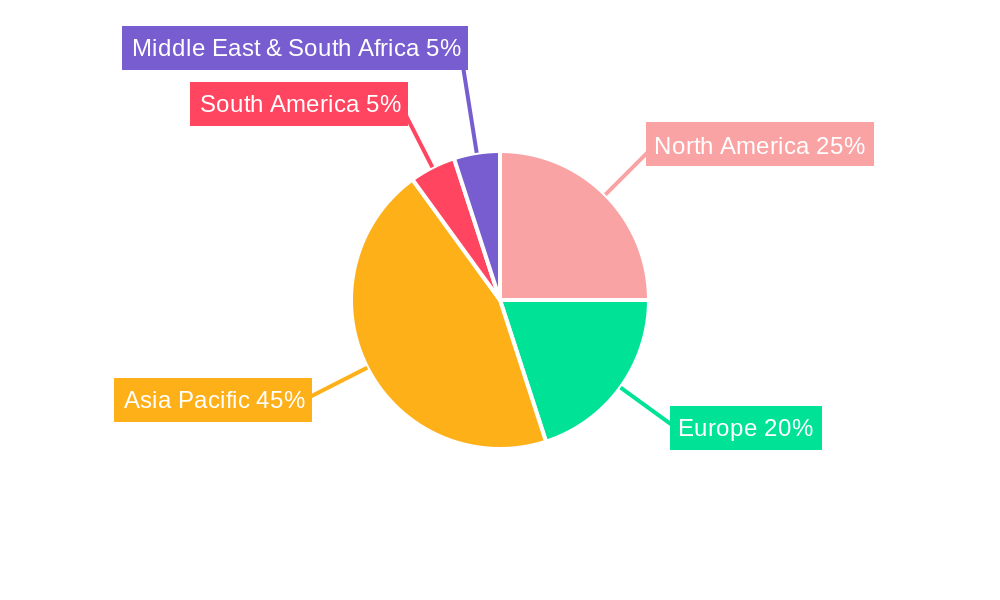
The forecast period (2025-2033) anticipates continued growth, driven by sustained consumer demand for premium products and increasing accessibility through online retail channels. While challenges such as fluctuating raw material prices and maintaining consistent quality across different harvests exist, the market's inherent resilience and the ongoing trend towards premiumization suggest a positive outlook. The Asia-Pacific region, particularly India and China, is expected to remain a key growth driver due to its large tea-consuming population and expanding middle class. However, North America and Europe are also expected to contribute significantly, driven by sophisticated consumer palates and a growing interest in exploring diverse tea varieties and experiences. Successful players will need to focus on building strong brands, emphasizing sustainability and ethical sourcing, and leveraging e-commerce platforms to reach a wider consumer base.
Single Origin Tea Market: A Comprehensive Report (2019-2033)
This comprehensive report provides an in-depth analysis of the Single Origin Tea market, encompassing market dynamics, growth trends, regional segmentation, product landscape, challenges, opportunities, key players, and future outlook. The study period covers 2019-2033, with 2025 serving as the base and estimated year. The report leverages extensive data analysis and expert insights to offer a valuable resource for industry professionals, investors, and stakeholders seeking a clear understanding of this dynamic market. The parent market is the broader tea market, while the child market focuses specifically on single-origin teas, highlighting premiumization and niche consumer preferences. The market value is presented in Million units throughout.
Single Origin Tea Market Dynamics & Structure
This section analyzes the competitive landscape, technological advancements, regulatory influences, and market trends within the single-origin tea sector. The market is characterized by a moderate level of concentration, with a few large players and numerous smaller, specialized producers. Technological innovation focuses on improving tea processing, packaging, and distribution, alongside enhancing traceability and quality control.
- Market Concentration: Moderately concentrated, with the top 5 players holding an estimated xx% market share in 2025.
- Technological Innovation: Focus on improved processing techniques, sustainable farming practices, and innovative packaging solutions for preserving freshness and enhancing consumer experience.
- Regulatory Framework: Varying regulations across different countries regarding labeling, organic certification, and food safety standards.
- Competitive Substitutes: Other beverage options like coffee, herbal infusions, and fruit juices compete for consumer spending.
- End-User Demographics: Growth is driven by increasing health consciousness, premiumization trends, and a rising appreciation for unique flavors and origins. The key demographic is affluent consumers aged 25-55, with a growing interest among younger consumers seeking artisanal and ethically sourced products.
- M&A Trends: A moderate number of M&A deals are observed, primarily focused on smaller brands being acquired by larger companies to expand their product portfolios and reach broader markets. Estimated M&A deal volume in 2024 was xx Million deals.
Single Origin Tea Market Growth Trends & Insights
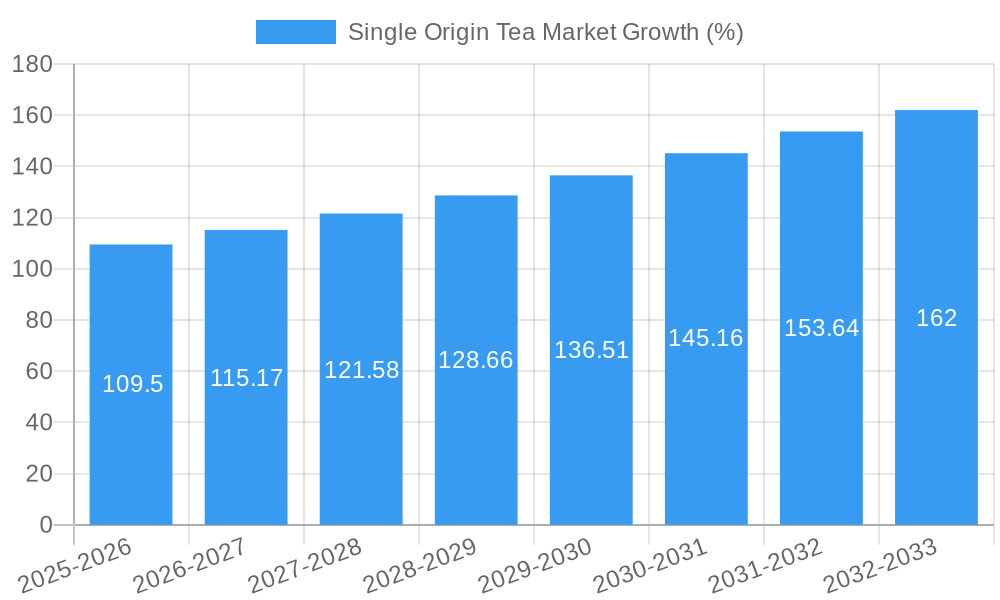
The single-origin tea market exhibits robust growth, driven by several factors. The historical period (2019-2024) witnessed a CAGR of xx%, reflecting increasing consumer demand for premium and specialized teas. This trend is projected to continue during the forecast period (2025-2033), with a projected CAGR of xx%. The market size in 2025 is estimated at xx Million units, and is expected to reach xx Million units by 2033. Market penetration is increasing steadily, particularly in developed and emerging economies with rising disposable incomes and a growing preference for healthier beverage options. Technological disruptions, such as e-commerce platforms and innovative packaging, further contribute to market expansion. Consumer behavior shifts toward healthier lifestyles, ethical sourcing, and experiential consumption are fueling demand for premium single-origin teas.
Dominant Regions, Countries, or Segments in Single Origin Tea Market
The global single-origin tea market is witnessing strong growth across various regions and segments. While exact market share data requires further analysis using XXX, initial findings suggest that [Region Name, e.g., North America or Europe] currently holds the largest market share, driven by high consumer disposable income and a preference for premium products. Within the segments, Black Tea continues to dominate, followed by Green Tea and Others (herbal infusions etc).
- Dominant Region: [Region Name, e.g., North America] (xx% market share in 2025)
- Dominant Type: Black Tea (xx% market share in 2025)
- Dominant Packaging: Loose Tea (increasing popularity due to perceived superior quality and experience)
- Dominant Distribution Channel: Specialty Stores (xx% market share in 2025), owing to increased focus on quality and expertise.
Key drivers for specific regions include economic policies favoring agricultural development, well-established distribution networks, and strong consumer preferences for specific tea types. Countries like [Country Name, e.g., Japan or UK] exhibit strong growth potential due to their established tea cultures and increasing demand for premium products.
Single Origin Tea Market Product Landscape
The single-origin tea market displays a wide range of products, focusing on premium quality, unique flavor profiles, and distinct origins. Products are differentiated by tea type (black, green, white, oolong), origin (specific tea gardens or regions), processing methods, and packaging. Technological advancements have led to improved packaging solutions that enhance freshness, aroma, and shelf-life. Unique selling propositions revolve around traceability, sustainability certifications, and unique flavor profiles linked to specific terroirs.
Key Drivers, Barriers & Challenges in Single Origin Tea Market
Key Drivers:
- Rising health consciousness: Increased consumer preference for natural and healthy beverages.
- Premiumization trend: Growing demand for high-quality, specialty teas.
- Increased consumer disposable incomes: Enabling purchases of premium products in emerging markets.
- E-commerce growth: Provides greater accessibility to diverse single-origin teas.
Key Challenges:
- Supply chain disruptions: Weather events, geopolitical instability, and logistical challenges impact tea production and distribution. Estimated impact on market growth in 2024: xx%
- Fluctuations in tea prices: Affecting profitability and impacting consumer affordability.
- Competition from other beverages: Coffee, herbal teas, and other drinks compete for consumer spending.
- Maintaining authenticity and traceability: Ensuring the origin and quality of single-origin teas.
Emerging Opportunities in Single Origin Tea Market
- Expansion into untapped markets: Exploring new markets with growing interest in premium beverages.
- Development of innovative product formats: Ready-to-drink (RTD) single-origin teas, infused teas, and functional teas.
- Focus on sustainability and ethical sourcing: Meeting the growing demand for environmentally and socially responsible products.
- Leveraging technological advancements: Using AI and data analytics to optimize supply chains and marketing strategies.
Growth Accelerators in the Single Origin Tea Market Industry
Long-term growth in the single-origin tea market will be driven by continued innovation in product offerings, strategic partnerships with retailers and distributors, and expansion into new geographic markets. Technological breakthroughs, particularly in sustainable farming practices and improved processing techniques, will further enhance the quality and supply of single-origin teas, driving market growth. The increasing focus on transparency and traceability across the supply chain will also build consumer trust and encourage adoption of single-origin teas.
Key Players Shaping the Single Origin Tea Market Market
- Akbar Brothers Ltd
- Kahawa
- Dilmah Ceylon Tea Company PLC
- Origin Tea
- Debonair Tea Company
- Single Estate Teas
- Art of Tea
- Alveus GmbH
- Organic India
- Premier's Tea Limited
Notable Milestones in Single Origin Tea Market Sector
- July 2022: Akbar Tea launched an exclusive premium tea outlet at the Boulevard Boutique Mall in Muscat, Oman, showcasing its Ceylon tea varieties. This signifies a strategic move toward direct-to-consumer sales and market expansion.
In-Depth Single Origin Tea Market Market Outlook
The future of the single-origin tea market looks promising. Continued premiumization, coupled with a growing interest in healthy and sustainable products, is projected to drive significant growth in the coming years. Companies that focus on innovation, sustainability, and building strong brand identities will be best positioned to capitalize on this market's expansion. Strategic partnerships, expansion into new markets, and the development of innovative product formats will be crucial for long-term success in this dynamic sector. The market shows immense potential for growth, with opportunities for both established players and new entrants to thrive.
Single Origin Tea Market Segmentation
-
1. Type
- 1.1. Black Tea
- 1.2. Green Tea
- 1.3. Others
-
2. Packaging
- 2.1. Tea Bags
- 2.2. Loose Tea
-
3. Distribution Channel
- 3.1. Supermarkets/Hypermarkets
- 3.2. Specialty Stores
- 3.3. Online Retail Stores
- 3.4. Other Distribution Channels
Single Origin Tea Market Segmentation By Geography
-
1. North America
- 1.1. United States
- 1.2. Canada
- 1.3. Mexico
- 1.4. Rest of North America
-
2. Europe
- 2.1. United Kingdom
- 2.2. Germany
- 2.3. Italy
- 2.4. France
- 2.5. Spain
- 2.6. Russia
- 2.7. Rest of Europe
-
3. Asia Pacific
- 3.1. India
- 3.2. China
- 3.3. Japan
- 3.4. Australia
- 3.5. Rest of Asia Pacific
-
4. South America
- 4.1. Brazil
- 4.2. Argentina
- 4.3. Rest of South America
- 5. Middle East
-
6. South Africa
- 6.1. Saudi Arabia
- 6.2. Rest of Middle East
Single Origin Tea Market REPORT HIGHLIGHTS
| Aspects | Details |
|---|---|
| Study Period | 2019-2033 |
| Base Year | 2024 |
| Estimated Year | 2025 |
| Forecast Period | 2025-2033 |
| Historical Period | 2019-2024 |
| Growth Rate | CAGR of 7.25% from 2019-2033 |
| Segmentation |
|
Table of Contents
- 1. Introduction
- 1.1. Research Scope
- 1.2. Market Segmentation
- 1.3. Research Methodology
- 1.4. Definitions and Assumptions
- 2. Executive Summary
- 2.1. Introduction
- 3. Market Dynamics
- 3.1. Introduction
- 3.2. Market Drivers
- 3.2.1. Increasing Demand for Flavored Spirits; Growing Consumption of Premium Alcoholic Beverages
- 3.3. Market Restrains
- 3.3.1. Stringent Government Regulations Pertaining to Spirits
- 3.4. Market Trends
- 3.4.1. Rising Popularity of Organic Tea Products
- 4. Market Factor Analysis
- 4.1. Porters Five Forces
- 4.2. Supply/Value Chain
- 4.3. PESTEL analysis
- 4.4. Market Entropy
- 4.5. Patent/Trademark Analysis
- 5. Global Single Origin Tea Market Analysis, Insights and Forecast, 2019-2031
- 5.1. Market Analysis, Insights and Forecast - by Type
- 5.1.1. Black Tea
- 5.1.2. Green Tea
- 5.1.3. Others
- 5.2. Market Analysis, Insights and Forecast - by Packaging
- 5.2.1. Tea Bags
- 5.2.2. Loose Tea
- 5.3. Market Analysis, Insights and Forecast - by Distribution Channel
- 5.3.1. Supermarkets/Hypermarkets
- 5.3.2. Specialty Stores
- 5.3.3. Online Retail Stores
- 5.3.4. Other Distribution Channels
- 5.4. Market Analysis, Insights and Forecast - by Region
- 5.4.1. North America
- 5.4.2. Europe
- 5.4.3. Asia Pacific
- 5.4.4. South America
- 5.4.5. Middle East
- 5.4.6. South Africa
- 5.1. Market Analysis, Insights and Forecast - by Type
- 6. North America Single Origin Tea Market Analysis, Insights and Forecast, 2019-2031
- 6.1. Market Analysis, Insights and Forecast - by Type
- 6.1.1. Black Tea
- 6.1.2. Green Tea
- 6.1.3. Others
- 6.2. Market Analysis, Insights and Forecast - by Packaging
- 6.2.1. Tea Bags
- 6.2.2. Loose Tea
- 6.3. Market Analysis, Insights and Forecast - by Distribution Channel
- 6.3.1. Supermarkets/Hypermarkets
- 6.3.2. Specialty Stores
- 6.3.3. Online Retail Stores
- 6.3.4. Other Distribution Channels
- 6.1. Market Analysis, Insights and Forecast - by Type
- 7. Europe Single Origin Tea Market Analysis, Insights and Forecast, 2019-2031
- 7.1. Market Analysis, Insights and Forecast - by Type
- 7.1.1. Black Tea
- 7.1.2. Green Tea
- 7.1.3. Others
- 7.2. Market Analysis, Insights and Forecast - by Packaging
- 7.2.1. Tea Bags
- 7.2.2. Loose Tea
- 7.3. Market Analysis, Insights and Forecast - by Distribution Channel
- 7.3.1. Supermarkets/Hypermarkets
- 7.3.2. Specialty Stores
- 7.3.3. Online Retail Stores
- 7.3.4. Other Distribution Channels
- 7.1. Market Analysis, Insights and Forecast - by Type
- 8. Asia Pacific Single Origin Tea Market Analysis, Insights and Forecast, 2019-2031
- 8.1. Market Analysis, Insights and Forecast - by Type
- 8.1.1. Black Tea
- 8.1.2. Green Tea
- 8.1.3. Others
- 8.2. Market Analysis, Insights and Forecast - by Packaging
- 8.2.1. Tea Bags
- 8.2.2. Loose Tea
- 8.3. Market Analysis, Insights and Forecast - by Distribution Channel
- 8.3.1. Supermarkets/Hypermarkets
- 8.3.2. Specialty Stores
- 8.3.3. Online Retail Stores
- 8.3.4. Other Distribution Channels
- 8.1. Market Analysis, Insights and Forecast - by Type
- 9. South America Single Origin Tea Market Analysis, Insights and Forecast, 2019-2031
- 9.1. Market Analysis, Insights and Forecast - by Type
- 9.1.1. Black Tea
- 9.1.2. Green Tea
- 9.1.3. Others
- 9.2. Market Analysis, Insights and Forecast - by Packaging
- 9.2.1. Tea Bags
- 9.2.2. Loose Tea
- 9.3. Market Analysis, Insights and Forecast - by Distribution Channel
- 9.3.1. Supermarkets/Hypermarkets
- 9.3.2. Specialty Stores
- 9.3.3. Online Retail Stores
- 9.3.4. Other Distribution Channels
- 9.1. Market Analysis, Insights and Forecast - by Type
- 10. Middle East Single Origin Tea Market Analysis, Insights and Forecast, 2019-2031
- 10.1. Market Analysis, Insights and Forecast - by Type
- 10.1.1. Black Tea
- 10.1.2. Green Tea
- 10.1.3. Others
- 10.2. Market Analysis, Insights and Forecast - by Packaging
- 10.2.1. Tea Bags
- 10.2.2. Loose Tea
- 10.3. Market Analysis, Insights and Forecast - by Distribution Channel
- 10.3.1. Supermarkets/Hypermarkets
- 10.3.2. Specialty Stores
- 10.3.3. Online Retail Stores
- 10.3.4. Other Distribution Channels
- 10.1. Market Analysis, Insights and Forecast - by Type
- 11. South Africa Single Origin Tea Market Analysis, Insights and Forecast, 2019-2031
- 11.1. Market Analysis, Insights and Forecast - by Type
- 11.1.1. Black Tea
- 11.1.2. Green Tea
- 11.1.3. Others
- 11.2. Market Analysis, Insights and Forecast - by Packaging
- 11.2.1. Tea Bags
- 11.2.2. Loose Tea
- 11.3. Market Analysis, Insights and Forecast - by Distribution Channel
- 11.3.1. Supermarkets/Hypermarkets
- 11.3.2. Specialty Stores
- 11.3.3. Online Retail Stores
- 11.3.4. Other Distribution Channels
- 11.1. Market Analysis, Insights and Forecast - by Type
- 12. North America Single Origin Tea Market Analysis, Insights and Forecast, 2019-2031
- 12.1. Market Analysis, Insights and Forecast - By Country/Sub-region
- 12.1.1 United States
- 12.1.2 Canada
- 12.1.3 Mexico
- 12.1.4 Rest of North America
- 13. Europe Single Origin Tea Market Analysis, Insights and Forecast, 2019-2031
- 13.1. Market Analysis, Insights and Forecast - By Country/Sub-region
- 13.1.1 United Kingdom
- 13.1.2 Germany
- 13.1.3 Italy
- 13.1.4 France
- 13.1.5 Spain
- 13.1.6 Russia
- 13.1.7 Rest of Europe
- 14. Asia Pacific Single Origin Tea Market Analysis, Insights and Forecast, 2019-2031
- 14.1. Market Analysis, Insights and Forecast - By Country/Sub-region
- 14.1.1 India
- 14.1.2 China
- 14.1.3 Japan
- 14.1.4 Australia
- 14.1.5 Rest of Asia Pacific
- 15. South America Single Origin Tea Market Analysis, Insights and Forecast, 2019-2031
- 15.1. Market Analysis, Insights and Forecast - By Country/Sub-region
- 15.1.1 Brazil
- 15.1.2 Argentina
- 15.1.3 Rest of South America
- 16. Middle East Single Origin Tea Market Analysis, Insights and Forecast, 2019-2031
- 16.1. Market Analysis, Insights and Forecast - By Country/Sub-region
- 16.1.1.
- 17. South Africa Single Origin Tea Market Analysis, Insights and Forecast, 2019-2031
- 17.1. Market Analysis, Insights and Forecast - By Country/Sub-region
- 17.1.1 Saudi Arabia
- 17.1.2 Rest of Middle East
- 18. Competitive Analysis
- 18.1. Global Market Share Analysis 2024
- 18.2. Company Profiles
- 18.2.1 Akbar Brothers Ltd
- 18.2.1.1. Overview
- 18.2.1.2. Products
- 18.2.1.3. SWOT Analysis
- 18.2.1.4. Recent Developments
- 18.2.1.5. Financials (Based on Availability)
- 18.2.2 Kahawa*List Not Exhaustive
- 18.2.2.1. Overview
- 18.2.2.2. Products
- 18.2.2.3. SWOT Analysis
- 18.2.2.4. Recent Developments
- 18.2.2.5. Financials (Based on Availability)
- 18.2.3 Dilmah Ceylon Tea Company PLC
- 18.2.3.1. Overview
- 18.2.3.2. Products
- 18.2.3.3. SWOT Analysis
- 18.2.3.4. Recent Developments
- 18.2.3.5. Financials (Based on Availability)
- 18.2.4 Origin Tea
- 18.2.4.1. Overview
- 18.2.4.2. Products
- 18.2.4.3. SWOT Analysis
- 18.2.4.4. Recent Developments
- 18.2.4.5. Financials (Based on Availability)
- 18.2.5 Debonair Tea Company
- 18.2.5.1. Overview
- 18.2.5.2. Products
- 18.2.5.3. SWOT Analysis
- 18.2.5.4. Recent Developments
- 18.2.5.5. Financials (Based on Availability)
- 18.2.6 Single Estate Teas
- 18.2.6.1. Overview
- 18.2.6.2. Products
- 18.2.6.3. SWOT Analysis
- 18.2.6.4. Recent Developments
- 18.2.6.5. Financials (Based on Availability)
- 18.2.7 Art of Tea
- 18.2.7.1. Overview
- 18.2.7.2. Products
- 18.2.7.3. SWOT Analysis
- 18.2.7.4. Recent Developments
- 18.2.7.5. Financials (Based on Availability)
- 18.2.8 Alveus GmbH
- 18.2.8.1. Overview
- 18.2.8.2. Products
- 18.2.8.3. SWOT Analysis
- 18.2.8.4. Recent Developments
- 18.2.8.5. Financials (Based on Availability)
- 18.2.9 Organic India
- 18.2.9.1. Overview
- 18.2.9.2. Products
- 18.2.9.3. SWOT Analysis
- 18.2.9.4. Recent Developments
- 18.2.9.5. Financials (Based on Availability)
- 18.2.10 Premier's Tea Limited
- 18.2.10.1. Overview
- 18.2.10.2. Products
- 18.2.10.3. SWOT Analysis
- 18.2.10.4. Recent Developments
- 18.2.10.5. Financials (Based on Availability)
- 18.2.1 Akbar Brothers Ltd
List of Figures
- Figure 1: Global Single Origin Tea Market Revenue Breakdown (Million, %) by Region 2024 & 2032
- Figure 2: North America Single Origin Tea Market Revenue (Million), by Country 2024 & 2032
- Figure 3: North America Single Origin Tea Market Revenue Share (%), by Country 2024 & 2032
- Figure 4: Europe Single Origin Tea Market Revenue (Million), by Country 2024 & 2032
- Figure 5: Europe Single Origin Tea Market Revenue Share (%), by Country 2024 & 2032
- Figure 6: Asia Pacific Single Origin Tea Market Revenue (Million), by Country 2024 & 2032
- Figure 7: Asia Pacific Single Origin Tea Market Revenue Share (%), by Country 2024 & 2032
- Figure 8: South America Single Origin Tea Market Revenue (Million), by Country 2024 & 2032
- Figure 9: South America Single Origin Tea Market Revenue Share (%), by Country 2024 & 2032
- Figure 10: Middle East Single Origin Tea Market Revenue (Million), by Country 2024 & 2032
- Figure 11: Middle East Single Origin Tea Market Revenue Share (%), by Country 2024 & 2032
- Figure 12: South Africa Single Origin Tea Market Revenue (Million), by Country 2024 & 2032
- Figure 13: South Africa Single Origin Tea Market Revenue Share (%), by Country 2024 & 2032
- Figure 14: North America Single Origin Tea Market Revenue (Million), by Type 2024 & 2032
- Figure 15: North America Single Origin Tea Market Revenue Share (%), by Type 2024 & 2032
- Figure 16: North America Single Origin Tea Market Revenue (Million), by Packaging 2024 & 2032
- Figure 17: North America Single Origin Tea Market Revenue Share (%), by Packaging 2024 & 2032
- Figure 18: North America Single Origin Tea Market Revenue (Million), by Distribution Channel 2024 & 2032
- Figure 19: North America Single Origin Tea Market Revenue Share (%), by Distribution Channel 2024 & 2032
- Figure 20: North America Single Origin Tea Market Revenue (Million), by Country 2024 & 2032
- Figure 21: North America Single Origin Tea Market Revenue Share (%), by Country 2024 & 2032
- Figure 22: Europe Single Origin Tea Market Revenue (Million), by Type 2024 & 2032
- Figure 23: Europe Single Origin Tea Market Revenue Share (%), by Type 2024 & 2032
- Figure 24: Europe Single Origin Tea Market Revenue (Million), by Packaging 2024 & 2032
- Figure 25: Europe Single Origin Tea Market Revenue Share (%), by Packaging 2024 & 2032
- Figure 26: Europe Single Origin Tea Market Revenue (Million), by Distribution Channel 2024 & 2032
- Figure 27: Europe Single Origin Tea Market Revenue Share (%), by Distribution Channel 2024 & 2032
- Figure 28: Europe Single Origin Tea Market Revenue (Million), by Country 2024 & 2032
- Figure 29: Europe Single Origin Tea Market Revenue Share (%), by Country 2024 & 2032
- Figure 30: Asia Pacific Single Origin Tea Market Revenue (Million), by Type 2024 & 2032
- Figure 31: Asia Pacific Single Origin Tea Market Revenue Share (%), by Type 2024 & 2032
- Figure 32: Asia Pacific Single Origin Tea Market Revenue (Million), by Packaging 2024 & 2032
- Figure 33: Asia Pacific Single Origin Tea Market Revenue Share (%), by Packaging 2024 & 2032
- Figure 34: Asia Pacific Single Origin Tea Market Revenue (Million), by Distribution Channel 2024 & 2032
- Figure 35: Asia Pacific Single Origin Tea Market Revenue Share (%), by Distribution Channel 2024 & 2032
- Figure 36: Asia Pacific Single Origin Tea Market Revenue (Million), by Country 2024 & 2032
- Figure 37: Asia Pacific Single Origin Tea Market Revenue Share (%), by Country 2024 & 2032
- Figure 38: South America Single Origin Tea Market Revenue (Million), by Type 2024 & 2032
- Figure 39: South America Single Origin Tea Market Revenue Share (%), by Type 2024 & 2032
- Figure 40: South America Single Origin Tea Market Revenue (Million), by Packaging 2024 & 2032
- Figure 41: South America Single Origin Tea Market Revenue Share (%), by Packaging 2024 & 2032
- Figure 42: South America Single Origin Tea Market Revenue (Million), by Distribution Channel 2024 & 2032
- Figure 43: South America Single Origin Tea Market Revenue Share (%), by Distribution Channel 2024 & 2032
- Figure 44: South America Single Origin Tea Market Revenue (Million), by Country 2024 & 2032
- Figure 45: South America Single Origin Tea Market Revenue Share (%), by Country 2024 & 2032
- Figure 46: Middle East Single Origin Tea Market Revenue (Million), by Type 2024 & 2032
- Figure 47: Middle East Single Origin Tea Market Revenue Share (%), by Type 2024 & 2032
- Figure 48: Middle East Single Origin Tea Market Revenue (Million), by Packaging 2024 & 2032
- Figure 49: Middle East Single Origin Tea Market Revenue Share (%), by Packaging 2024 & 2032
- Figure 50: Middle East Single Origin Tea Market Revenue (Million), by Distribution Channel 2024 & 2032
- Figure 51: Middle East Single Origin Tea Market Revenue Share (%), by Distribution Channel 2024 & 2032
- Figure 52: Middle East Single Origin Tea Market Revenue (Million), by Country 2024 & 2032
- Figure 53: Middle East Single Origin Tea Market Revenue Share (%), by Country 2024 & 2032
- Figure 54: South Africa Single Origin Tea Market Revenue (Million), by Type 2024 & 2032
- Figure 55: South Africa Single Origin Tea Market Revenue Share (%), by Type 2024 & 2032
- Figure 56: South Africa Single Origin Tea Market Revenue (Million), by Packaging 2024 & 2032
- Figure 57: South Africa Single Origin Tea Market Revenue Share (%), by Packaging 2024 & 2032
- Figure 58: South Africa Single Origin Tea Market Revenue (Million), by Distribution Channel 2024 & 2032
- Figure 59: South Africa Single Origin Tea Market Revenue Share (%), by Distribution Channel 2024 & 2032
- Figure 60: South Africa Single Origin Tea Market Revenue (Million), by Country 2024 & 2032
- Figure 61: South Africa Single Origin Tea Market Revenue Share (%), by Country 2024 & 2032
List of Tables
- Table 1: Global Single Origin Tea Market Revenue Million Forecast, by Region 2019 & 2032
- Table 2: Global Single Origin Tea Market Revenue Million Forecast, by Type 2019 & 2032
- Table 3: Global Single Origin Tea Market Revenue Million Forecast, by Packaging 2019 & 2032
- Table 4: Global Single Origin Tea Market Revenue Million Forecast, by Distribution Channel 2019 & 2032
- Table 5: Global Single Origin Tea Market Revenue Million Forecast, by Region 2019 & 2032
- Table 6: Global Single Origin Tea Market Revenue Million Forecast, by Country 2019 & 2032
- Table 7: United States Single Origin Tea Market Revenue (Million) Forecast, by Application 2019 & 2032
- Table 8: Canada Single Origin Tea Market Revenue (Million) Forecast, by Application 2019 & 2032
- Table 9: Mexico Single Origin Tea Market Revenue (Million) Forecast, by Application 2019 & 2032
- Table 10: Rest of North America Single Origin Tea Market Revenue (Million) Forecast, by Application 2019 & 2032
- Table 11: Global Single Origin Tea Market Revenue Million Forecast, by Country 2019 & 2032
- Table 12: United Kingdom Single Origin Tea Market Revenue (Million) Forecast, by Application 2019 & 2032
- Table 13: Germany Single Origin Tea Market Revenue (Million) Forecast, by Application 2019 & 2032
- Table 14: Italy Single Origin Tea Market Revenue (Million) Forecast, by Application 2019 & 2032
- Table 15: France Single Origin Tea Market Revenue (Million) Forecast, by Application 2019 & 2032
- Table 16: Spain Single Origin Tea Market Revenue (Million) Forecast, by Application 2019 & 2032
- Table 17: Russia Single Origin Tea Market Revenue (Million) Forecast, by Application 2019 & 2032
- Table 18: Rest of Europe Single Origin Tea Market Revenue (Million) Forecast, by Application 2019 & 2032
- Table 19: Global Single Origin Tea Market Revenue Million Forecast, by Country 2019 & 2032
- Table 20: India Single Origin Tea Market Revenue (Million) Forecast, by Application 2019 & 2032
- Table 21: China Single Origin Tea Market Revenue (Million) Forecast, by Application 2019 & 2032
- Table 22: Japan Single Origin Tea Market Revenue (Million) Forecast, by Application 2019 & 2032
- Table 23: Australia Single Origin Tea Market Revenue (Million) Forecast, by Application 2019 & 2032
- Table 24: Rest of Asia Pacific Single Origin Tea Market Revenue (Million) Forecast, by Application 2019 & 2032
- Table 25: Global Single Origin Tea Market Revenue Million Forecast, by Country 2019 & 2032
- Table 26: Brazil Single Origin Tea Market Revenue (Million) Forecast, by Application 2019 & 2032
- Table 27: Argentina Single Origin Tea Market Revenue (Million) Forecast, by Application 2019 & 2032
- Table 28: Rest of South America Single Origin Tea Market Revenue (Million) Forecast, by Application 2019 & 2032
- Table 29: Global Single Origin Tea Market Revenue Million Forecast, by Country 2019 & 2032
- Table 30: Single Origin Tea Market Revenue (Million) Forecast, by Application 2019 & 2032
- Table 31: Global Single Origin Tea Market Revenue Million Forecast, by Country 2019 & 2032
- Table 32: Saudi Arabia Single Origin Tea Market Revenue (Million) Forecast, by Application 2019 & 2032
- Table 33: Rest of Middle East Single Origin Tea Market Revenue (Million) Forecast, by Application 2019 & 2032
- Table 34: Global Single Origin Tea Market Revenue Million Forecast, by Type 2019 & 2032
- Table 35: Global Single Origin Tea Market Revenue Million Forecast, by Packaging 2019 & 2032
- Table 36: Global Single Origin Tea Market Revenue Million Forecast, by Distribution Channel 2019 & 2032
- Table 37: Global Single Origin Tea Market Revenue Million Forecast, by Country 2019 & 2032
- Table 38: United States Single Origin Tea Market Revenue (Million) Forecast, by Application 2019 & 2032
- Table 39: Canada Single Origin Tea Market Revenue (Million) Forecast, by Application 2019 & 2032
- Table 40: Mexico Single Origin Tea Market Revenue (Million) Forecast, by Application 2019 & 2032
- Table 41: Rest of North America Single Origin Tea Market Revenue (Million) Forecast, by Application 2019 & 2032
- Table 42: Global Single Origin Tea Market Revenue Million Forecast, by Type 2019 & 2032
- Table 43: Global Single Origin Tea Market Revenue Million Forecast, by Packaging 2019 & 2032
- Table 44: Global Single Origin Tea Market Revenue Million Forecast, by Distribution Channel 2019 & 2032
- Table 45: Global Single Origin Tea Market Revenue Million Forecast, by Country 2019 & 2032
- Table 46: United Kingdom Single Origin Tea Market Revenue (Million) Forecast, by Application 2019 & 2032
- Table 47: Germany Single Origin Tea Market Revenue (Million) Forecast, by Application 2019 & 2032
- Table 48: Italy Single Origin Tea Market Revenue (Million) Forecast, by Application 2019 & 2032
- Table 49: France Single Origin Tea Market Revenue (Million) Forecast, by Application 2019 & 2032
- Table 50: Spain Single Origin Tea Market Revenue (Million) Forecast, by Application 2019 & 2032
- Table 51: Russia Single Origin Tea Market Revenue (Million) Forecast, by Application 2019 & 2032
- Table 52: Rest of Europe Single Origin Tea Market Revenue (Million) Forecast, by Application 2019 & 2032
- Table 53: Global Single Origin Tea Market Revenue Million Forecast, by Type 2019 & 2032
- Table 54: Global Single Origin Tea Market Revenue Million Forecast, by Packaging 2019 & 2032
- Table 55: Global Single Origin Tea Market Revenue Million Forecast, by Distribution Channel 2019 & 2032
- Table 56: Global Single Origin Tea Market Revenue Million Forecast, by Country 2019 & 2032
- Table 57: India Single Origin Tea Market Revenue (Million) Forecast, by Application 2019 & 2032
- Table 58: China Single Origin Tea Market Revenue (Million) Forecast, by Application 2019 & 2032
- Table 59: Japan Single Origin Tea Market Revenue (Million) Forecast, by Application 2019 & 2032
- Table 60: Australia Single Origin Tea Market Revenue (Million) Forecast, by Application 2019 & 2032
- Table 61: Rest of Asia Pacific Single Origin Tea Market Revenue (Million) Forecast, by Application 2019 & 2032
- Table 62: Global Single Origin Tea Market Revenue Million Forecast, by Type 2019 & 2032
- Table 63: Global Single Origin Tea Market Revenue Million Forecast, by Packaging 2019 & 2032
- Table 64: Global Single Origin Tea Market Revenue Million Forecast, by Distribution Channel 2019 & 2032
- Table 65: Global Single Origin Tea Market Revenue Million Forecast, by Country 2019 & 2032
- Table 66: Brazil Single Origin Tea Market Revenue (Million) Forecast, by Application 2019 & 2032
- Table 67: Argentina Single Origin Tea Market Revenue (Million) Forecast, by Application 2019 & 2032
- Table 68: Rest of South America Single Origin Tea Market Revenue (Million) Forecast, by Application 2019 & 2032
- Table 69: Global Single Origin Tea Market Revenue Million Forecast, by Type 2019 & 2032
- Table 70: Global Single Origin Tea Market Revenue Million Forecast, by Packaging 2019 & 2032
- Table 71: Global Single Origin Tea Market Revenue Million Forecast, by Distribution Channel 2019 & 2032
- Table 72: Global Single Origin Tea Market Revenue Million Forecast, by Country 2019 & 2032
- Table 73: Global Single Origin Tea Market Revenue Million Forecast, by Type 2019 & 2032
- Table 74: Global Single Origin Tea Market Revenue Million Forecast, by Packaging 2019 & 2032
- Table 75: Global Single Origin Tea Market Revenue Million Forecast, by Distribution Channel 2019 & 2032
- Table 76: Global Single Origin Tea Market Revenue Million Forecast, by Country 2019 & 2032
- Table 77: Saudi Arabia Single Origin Tea Market Revenue (Million) Forecast, by Application 2019 & 2032
- Table 78: Rest of Middle East Single Origin Tea Market Revenue (Million) Forecast, by Application 2019 & 2032
Frequently Asked Questions
1. What is the projected Compound Annual Growth Rate (CAGR) of the Single Origin Tea Market?
The projected CAGR is approximately 7.25%.
2. Which companies are prominent players in the Single Origin Tea Market?
Key companies in the market include Akbar Brothers Ltd, Kahawa*List Not Exhaustive, Dilmah Ceylon Tea Company PLC, Origin Tea, Debonair Tea Company, Single Estate Teas, Art of Tea, Alveus GmbH, Organic India, Premier's Tea Limited.
3. What are the main segments of the Single Origin Tea Market?
The market segments include Type, Packaging, Distribution Channel.
4. Can you provide details about the market size?
The market size is estimated to be USD XX Million as of 2022.
5. What are some drivers contributing to market growth?
Increasing Demand for Flavored Spirits; Growing Consumption of Premium Alcoholic Beverages.
6. What are the notable trends driving market growth?
Rising Popularity of Organic Tea Products.
7. Are there any restraints impacting market growth?
Stringent Government Regulations Pertaining to Spirits.
8. Can you provide examples of recent developments in the market?
In July 2022, Akbar Tea launched an exclusive premium tea outlet at the Boulevard Boutique Mall, located in Muscat, Oman. The company offered its Ceylon tea of different varieties through this outlet in Sultanate.
9. What pricing options are available for accessing the report?
Pricing options include single-user, multi-user, and enterprise licenses priced at USD 4750, USD 5250, and USD 8750 respectively.
10. Is the market size provided in terms of value or volume?
The market size is provided in terms of value, measured in Million.
11. Are there any specific market keywords associated with the report?
Yes, the market keyword associated with the report is "Single Origin Tea Market," which aids in identifying and referencing the specific market segment covered.
12. How do I determine which pricing option suits my needs best?
The pricing options vary based on user requirements and access needs. Individual users may opt for single-user licenses, while businesses requiring broader access may choose multi-user or enterprise licenses for cost-effective access to the report.
13. Are there any additional resources or data provided in the Single Origin Tea Market report?
While the report offers comprehensive insights, it's advisable to review the specific contents or supplementary materials provided to ascertain if additional resources or data are available.
14. How can I stay updated on further developments or reports in the Single Origin Tea Market?
To stay informed about further developments, trends, and reports in the Single Origin Tea Market, consider subscribing to industry newsletters, following relevant companies and organizations, or regularly checking reputable industry news sources and publications.
Methodology
Step 1 - Identification of Relevant Samples Size from Population Database


Step 2 - Approaches for Defining Global Market Size (Value, Volume* & Price*)

Note*: In applicable scenarios
Step 3 - Data Sources
Primary Research
- Web Analytics
- Survey Reports
- Research Institute
- Latest Research Reports
- Opinion Leaders
Secondary Research
- Annual Reports
- White Paper
- Latest Press Release
- Industry Association
- Paid Database
- Investor Presentations

Step 4 - Data Triangulation
Involves using different sources of information in order to increase the validity of a study
These sources are likely to be stakeholders in a program - participants, other researchers, program staff, other community members, and so on.
Then we put all data in single framework & apply various statistical tools to find out the dynamic on the market.
During the analysis stage, feedback from the stakeholder groups would be compared to determine areas of agreement as well as areas of divergence


