
Key Insights
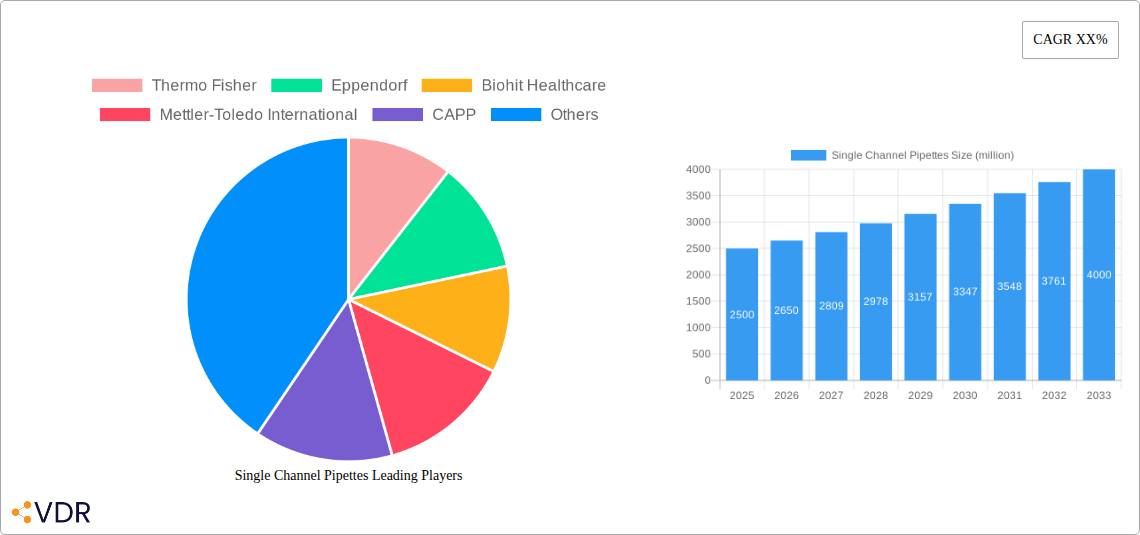
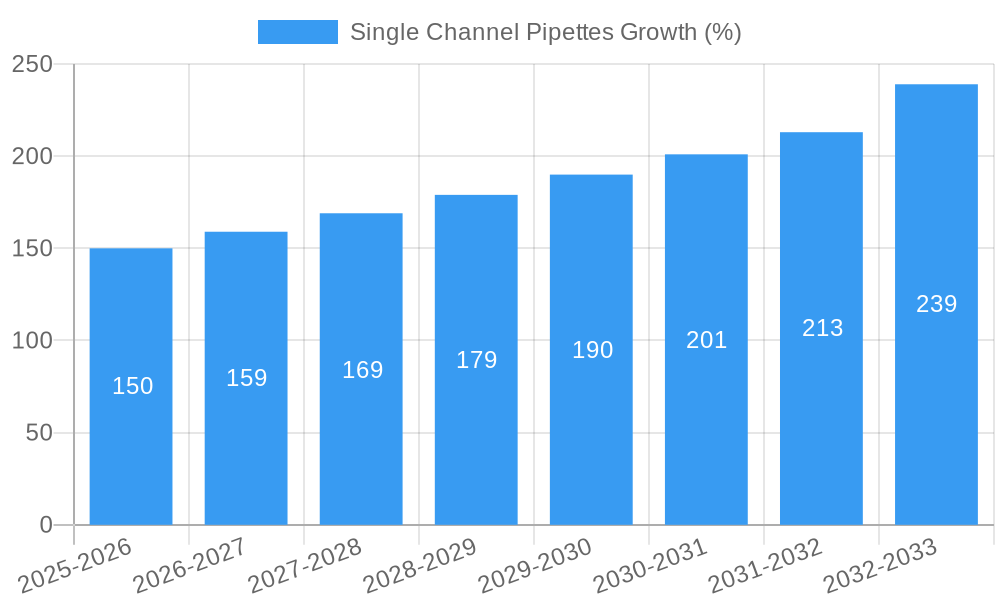
The single-channel pipette market, a cornerstone of laboratory equipment, is experiencing robust growth driven by the expanding life sciences research sector, increasing automation in laboratories, and rising demand for precise liquid handling in various applications, including clinical diagnostics, drug discovery, and genomics. The market, estimated at $2.5 billion in 2025, is projected to register a healthy Compound Annual Growth Rate (CAGR) of 6% between 2025 and 2033, reaching an estimated market value of approximately $4 billion by 2033. This growth is fueled by technological advancements leading to improved pipette ergonomics, accuracy, and disposability features. Furthermore, increasing adoption of automated liquid handling systems is creating a significant demand for compatible, high-precision single-channel pipettes. However, market growth may be somewhat constrained by the availability of cheaper alternatives and stringent regulatory requirements in certain regions.
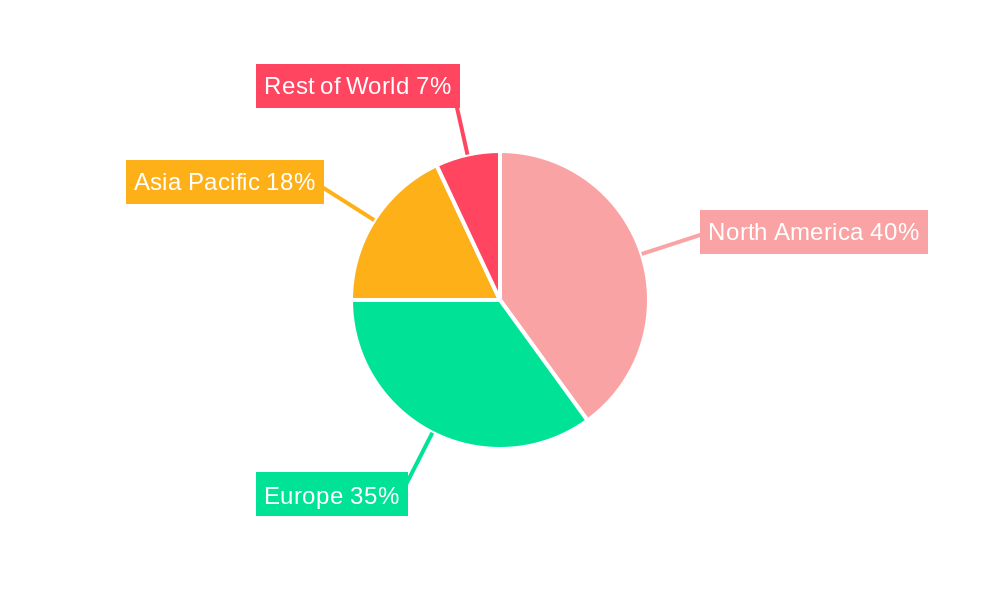
Key players like Thermo Fisher, Eppendorf, and Sartorius are leveraging their established brand reputation and technological prowess to maintain market leadership. However, the market also exhibits a degree of fragmentation with several smaller players catering to niche segments or geographical regions. The North American region holds a significant market share due to robust research funding and established pharmaceutical and biotechnology industries. Europe follows closely as another significant market, driven by a strong life sciences sector and regulatory emphasis on precision in laboratory procedures. Future growth will likely be influenced by factors like the increasing prevalence of infectious diseases, demanding greater diagnostic capabilities, as well as the ongoing expansion of personalized medicine, creating a need for more sophisticated and precise liquid handling tools.
Single Channel Pipettes Market Report: 2019-2033
This comprehensive report provides a detailed analysis of the global single channel pipettes market, encompassing historical data (2019-2024), current estimations (2025), and future projections (2025-2033). It delves into market dynamics, growth trends, regional segmentation, product landscapes, and competitive landscapes, offering invaluable insights for industry professionals, investors, and researchers. The report covers the parent market of laboratory equipment and the child market of liquid handling instruments. The market size is projected to reach xx million units by 2033.
Single Channel Pipettes Market Dynamics & Structure
The single channel pipette market is characterized by a moderately consolidated structure, with key players like Thermo Fisher, Eppendorf, and Sartorius holding significant market share. Technological innovation, particularly in areas like ergonomics, accuracy, and disposability, is a major driver. Stringent regulatory frameworks concerning quality control and safety standards impact market dynamics. Competition from automated liquid handling systems presents a challenge, although single channel pipettes remain crucial for various applications due to their versatility and cost-effectiveness. The market witnesses frequent M&A activities, with xx deals recorded between 2019 and 2024, primarily driven by expansion into new markets and technology acquisition. End-user demographics largely comprise pharmaceutical, biotechnology, academic research institutions, and clinical diagnostic laboratories.
- Market Concentration: Moderately consolidated, with top 5 players holding xx% market share in 2025.
- Technological Innovation: Focus on improved ergonomics, accuracy (e.g., reduced error rates), and disposable tip integration.
- Regulatory Framework: Stringent quality and safety standards (e.g., ISO, GLP) significantly influence product development and manufacturing.
- Competitive Substitutes: Automated liquid handling systems present competitive pressure, yet single channel pipettes maintain strong demand.
- M&A Activity: xx M&A deals between 2019 and 2024, driven by market expansion and technological advancement.
- Innovation Barriers: High R&D costs, stringent regulatory compliance, and patent protection can hinder innovation.
Single Channel Pipettes Growth Trends & Insights
The global single channel pipettes market experienced substantial growth from 2019 to 2024, driven by the increasing demand from the pharmaceutical and biotechnology sectors. The market size increased from xx million units in 2019 to xx million units in 2024, exhibiting a CAGR of xx%. Technological advancements, such as the introduction of electronically controlled pipettes and improved ergonomic designs, have contributed significantly to market expansion. The adoption rate of single channel pipettes remains high among researchers and laboratory technicians, fueled by the demand for accurate and precise liquid handling in various applications. Shifting consumer behavior towards preference for single-use products also boosts the demand. The market is projected to continue its growth trajectory, reaching xx million units by 2033, with a projected CAGR of xx% during the forecast period (2025-2033).
Dominant Regions, Countries, or Segments in Single Channel Pipettes
North America consistently dominates the single channel pipettes market, followed by Europe, driven by the presence of major players, well-established research infrastructure, and significant funding for research and development initiatives. Asia-Pacific is witnessing rapid growth, fueled by increasing investments in healthcare infrastructure and rising research activities in emerging economies such as China and India. The pharmaceutical and biotechnology segments account for the largest market share, followed by academic research and clinical diagnostics.
- Key Drivers (North America): Strong R&D investments, well-developed healthcare infrastructure, and a large number of pharmaceutical and biotechnology companies.
- Key Drivers (Europe): High adoption rates in research institutions and established regulatory frameworks.
- Key Drivers (Asia-Pacific): Growing healthcare infrastructure, rising research and development activities, and increasing government investments in the pharmaceutical and biotechnology sectors.
- Segment Dominance: Pharmaceutical and biotechnology sectors drive the majority of demand.
Single Channel Pipettes Product Landscape
Single channel pipettes are available in a wide range of volumes, from microliters to milliliters, catering to diverse laboratory needs. Recent innovations focus on improving accuracy, precision, and ease of use through features such as digital displays, adjustable volume settings, and ergonomic designs. Technological advancements include the integration of electronic controls for improved repeatability and reduced user error. Unique selling propositions include features such as lightweight designs, low maintenance requirements, and compatibility with various types of pipette tips.
Key Drivers, Barriers & Challenges in Single Channel Pipettes
Key Drivers:
- Increasing research activities in pharmaceutical, biotechnology, and academic sectors.
- Growing demand for accurate and precise liquid handling in various laboratory applications.
- Technological advancements leading to improved ergonomics, accuracy, and disposability.
- Stringent regulatory requirements driving the demand for high-quality pipettes.
Key Challenges:
- Competition from automated liquid handling systems impacting demand for single channel pipettes.
- Supply chain disruptions potentially affecting the availability and cost of raw materials and components.
- The high cost of production and development of technologically advanced pipettes.
- Fluctuating raw material prices impacting profitability.
Emerging Opportunities in Single Channel Pipettes
- Expansion into emerging markets with increasing healthcare infrastructure.
- Development of specialized pipettes for specific applications, such as genomics and proteomics.
- Integration of innovative technologies such as automation and connectivity features.
- Growth in demand for disposable and single-use pipettes to minimize cross-contamination.
Growth Accelerators in the Single Channel Pipettes Industry
Strategic partnerships between pipette manufacturers and research institutions can fuel innovation. Technological breakthroughs, such as the development of more accurate and user-friendly pipettes, continue to drive market growth. Expanding into untapped markets, particularly in developing countries with growing healthcare sectors, represents a significant opportunity.
Key Players Shaping the Single Channel Pipettes Market
- Thermo Fisher
- Eppendorf
- Biohit Healthcare
- Mettler-Toledo International
- CAPP
- Heathrow Scientific
- Oxford Lab Products
- Labnet International
- Gilson
- VistaLab
- Sartorius
- BRAND
- Hamilton Company
- Nichiryo
Notable Milestones in Single Channel Pipettes Sector
- 2020: Eppendorf launched a new line of ergonomic single channel pipettes.
- 2021: Sartorius acquired a smaller pipette manufacturer, expanding its product portfolio.
- 2022: Thermo Fisher introduced a new generation of electronically controlled pipettes.
- 2023: Several companies announced new partnerships to improve supply chain resilience.
- 2024: Increased focus on sustainable and eco-friendly pipette design and production.
In-Depth Single Channel Pipettes Market Outlook
The future of the single channel pipettes market looks promising, fueled by consistent demand from the healthcare and research sectors. The market is expected to witness continued growth, driven by technological advancements, strategic partnerships, and expansion into new geographic regions. Companies focusing on innovation, sustainability, and supply chain resilience will be best positioned to capitalize on emerging opportunities and maintain a strong competitive advantage in this dynamic market.
Single Channel Pipettes Segmentation
-
1. Application
- 1.1. Hospitals
- 1.2. Pharmaceutical Industry
- 1.3. Molecular Biology Lab
- 1.4. Chemical Industry
- 1.5. Others
-
2. Types
- 2.1. Adjustable Single Channel Pipettes
- 2.2. Fixed Volume Single Channel Pipettes
Single Channel Pipettes Segmentation By Geography
-
1. North America
- 1.1. United States
- 1.2. Canada
- 1.3. Mexico
-
2. South America
- 2.1. Brazil
- 2.2. Argentina
- 2.3. Rest of South America
-
3. Europe
- 3.1. United Kingdom
- 3.2. Germany
- 3.3. France
- 3.4. Italy
- 3.5. Spain
- 3.6. Russia
- 3.7. Benelux
- 3.8. Nordics
- 3.9. Rest of Europe
-
4. Middle East & Africa
- 4.1. Turkey
- 4.2. Israel
- 4.3. GCC
- 4.4. North Africa
- 4.5. South Africa
- 4.6. Rest of Middle East & Africa
-
5. Asia Pacific
- 5.1. China
- 5.2. India
- 5.3. Japan
- 5.4. South Korea
- 5.5. ASEAN
- 5.6. Oceania
- 5.7. Rest of Asia Pacific
Single Channel Pipettes REPORT HIGHLIGHTS
| Aspects | Details |
|---|---|
| Study Period | 2019-2033 |
| Base Year | 2024 |
| Estimated Year | 2025 |
| Forecast Period | 2025-2033 |
| Historical Period | 2019-2024 |
| Growth Rate | CAGR of XX% from 2019-2033 |
| Segmentation |
|
Table of Contents
- 1. Introduction
- 1.1. Research Scope
- 1.2. Market Segmentation
- 1.3. Research Methodology
- 1.4. Definitions and Assumptions
- 2. Executive Summary
- 2.1. Introduction
- 3. Market Dynamics
- 3.1. Introduction
- 3.2. Market Drivers
- 3.3. Market Restrains
- 3.4. Market Trends
- 4. Market Factor Analysis
- 4.1. Porters Five Forces
- 4.2. Supply/Value Chain
- 4.3. PESTEL analysis
- 4.4. Market Entropy
- 4.5. Patent/Trademark Analysis
- 5. Global Single Channel Pipettes Analysis, Insights and Forecast, 2019-2031
- 5.1. Market Analysis, Insights and Forecast - by Application
- 5.1.1. Hospitals
- 5.1.2. Pharmaceutical Industry
- 5.1.3. Molecular Biology Lab
- 5.1.4. Chemical Industry
- 5.1.5. Others
- 5.2. Market Analysis, Insights and Forecast - by Types
- 5.2.1. Adjustable Single Channel Pipettes
- 5.2.2. Fixed Volume Single Channel Pipettes
- 5.3. Market Analysis, Insights and Forecast - by Region
- 5.3.1. North America
- 5.3.2. South America
- 5.3.3. Europe
- 5.3.4. Middle East & Africa
- 5.3.5. Asia Pacific
- 5.1. Market Analysis, Insights and Forecast - by Application
- 6. North America Single Channel Pipettes Analysis, Insights and Forecast, 2019-2031
- 6.1. Market Analysis, Insights and Forecast - by Application
- 6.1.1. Hospitals
- 6.1.2. Pharmaceutical Industry
- 6.1.3. Molecular Biology Lab
- 6.1.4. Chemical Industry
- 6.1.5. Others
- 6.2. Market Analysis, Insights and Forecast - by Types
- 6.2.1. Adjustable Single Channel Pipettes
- 6.2.2. Fixed Volume Single Channel Pipettes
- 6.1. Market Analysis, Insights and Forecast - by Application
- 7. South America Single Channel Pipettes Analysis, Insights and Forecast, 2019-2031
- 7.1. Market Analysis, Insights and Forecast - by Application
- 7.1.1. Hospitals
- 7.1.2. Pharmaceutical Industry
- 7.1.3. Molecular Biology Lab
- 7.1.4. Chemical Industry
- 7.1.5. Others
- 7.2. Market Analysis, Insights and Forecast - by Types
- 7.2.1. Adjustable Single Channel Pipettes
- 7.2.2. Fixed Volume Single Channel Pipettes
- 7.1. Market Analysis, Insights and Forecast - by Application
- 8. Europe Single Channel Pipettes Analysis, Insights and Forecast, 2019-2031
- 8.1. Market Analysis, Insights and Forecast - by Application
- 8.1.1. Hospitals
- 8.1.2. Pharmaceutical Industry
- 8.1.3. Molecular Biology Lab
- 8.1.4. Chemical Industry
- 8.1.5. Others
- 8.2. Market Analysis, Insights and Forecast - by Types
- 8.2.1. Adjustable Single Channel Pipettes
- 8.2.2. Fixed Volume Single Channel Pipettes
- 8.1. Market Analysis, Insights and Forecast - by Application
- 9. Middle East & Africa Single Channel Pipettes Analysis, Insights and Forecast, 2019-2031
- 9.1. Market Analysis, Insights and Forecast - by Application
- 9.1.1. Hospitals
- 9.1.2. Pharmaceutical Industry
- 9.1.3. Molecular Biology Lab
- 9.1.4. Chemical Industry
- 9.1.5. Others
- 9.2. Market Analysis, Insights and Forecast - by Types
- 9.2.1. Adjustable Single Channel Pipettes
- 9.2.2. Fixed Volume Single Channel Pipettes
- 9.1. Market Analysis, Insights and Forecast - by Application
- 10. Asia Pacific Single Channel Pipettes Analysis, Insights and Forecast, 2019-2031
- 10.1. Market Analysis, Insights and Forecast - by Application
- 10.1.1. Hospitals
- 10.1.2. Pharmaceutical Industry
- 10.1.3. Molecular Biology Lab
- 10.1.4. Chemical Industry
- 10.1.5. Others
- 10.2. Market Analysis, Insights and Forecast - by Types
- 10.2.1. Adjustable Single Channel Pipettes
- 10.2.2. Fixed Volume Single Channel Pipettes
- 10.1. Market Analysis, Insights and Forecast - by Application
- 11. Competitive Analysis
- 11.1. Global Market Share Analysis 2024
- 11.2. Company Profiles
- 11.2.1 Thermo Fisher
- 11.2.1.1. Overview
- 11.2.1.2. Products
- 11.2.1.3. SWOT Analysis
- 11.2.1.4. Recent Developments
- 11.2.1.5. Financials (Based on Availability)
- 11.2.2 Eppendorf
- 11.2.2.1. Overview
- 11.2.2.2. Products
- 11.2.2.3. SWOT Analysis
- 11.2.2.4. Recent Developments
- 11.2.2.5. Financials (Based on Availability)
- 11.2.3 Biohit Healthcare
- 11.2.3.1. Overview
- 11.2.3.2. Products
- 11.2.3.3. SWOT Analysis
- 11.2.3.4. Recent Developments
- 11.2.3.5. Financials (Based on Availability)
- 11.2.4 Mettler-Toledo International
- 11.2.4.1. Overview
- 11.2.4.2. Products
- 11.2.4.3. SWOT Analysis
- 11.2.4.4. Recent Developments
- 11.2.4.5. Financials (Based on Availability)
- 11.2.5 CAPP
- 11.2.5.1. Overview
- 11.2.5.2. Products
- 11.2.5.3. SWOT Analysis
- 11.2.5.4. Recent Developments
- 11.2.5.5. Financials (Based on Availability)
- 11.2.6 Heathrow Scientific
- 11.2.6.1. Overview
- 11.2.6.2. Products
- 11.2.6.3. SWOT Analysis
- 11.2.6.4. Recent Developments
- 11.2.6.5. Financials (Based on Availability)
- 11.2.7 Oxford Lab Products
- 11.2.7.1. Overview
- 11.2.7.2. Products
- 11.2.7.3. SWOT Analysis
- 11.2.7.4. Recent Developments
- 11.2.7.5. Financials (Based on Availability)
- 11.2.8 Labnet International
- 11.2.8.1. Overview
- 11.2.8.2. Products
- 11.2.8.3. SWOT Analysis
- 11.2.8.4. Recent Developments
- 11.2.8.5. Financials (Based on Availability)
- 11.2.9 Gilson
- 11.2.9.1. Overview
- 11.2.9.2. Products
- 11.2.9.3. SWOT Analysis
- 11.2.9.4. Recent Developments
- 11.2.9.5. Financials (Based on Availability)
- 11.2.10 VistaLab
- 11.2.10.1. Overview
- 11.2.10.2. Products
- 11.2.10.3. SWOT Analysis
- 11.2.10.4. Recent Developments
- 11.2.10.5. Financials (Based on Availability)
- 11.2.11 Sartorius
- 11.2.11.1. Overview
- 11.2.11.2. Products
- 11.2.11.3. SWOT Analysis
- 11.2.11.4. Recent Developments
- 11.2.11.5. Financials (Based on Availability)
- 11.2.12 BRAND
- 11.2.12.1. Overview
- 11.2.12.2. Products
- 11.2.12.3. SWOT Analysis
- 11.2.12.4. Recent Developments
- 11.2.12.5. Financials (Based on Availability)
- 11.2.13 Hamilton Company
- 11.2.13.1. Overview
- 11.2.13.2. Products
- 11.2.13.3. SWOT Analysis
- 11.2.13.4. Recent Developments
- 11.2.13.5. Financials (Based on Availability)
- 11.2.14 Nichiryo
- 11.2.14.1. Overview
- 11.2.14.2. Products
- 11.2.14.3. SWOT Analysis
- 11.2.14.4. Recent Developments
- 11.2.14.5. Financials (Based on Availability)
- 11.2.1 Thermo Fisher
List of Figures
- Figure 1: Global Single Channel Pipettes Revenue Breakdown (million, %) by Region 2024 & 2032
- Figure 2: Global Single Channel Pipettes Volume Breakdown (K, %) by Region 2024 & 2032
- Figure 3: North America Single Channel Pipettes Revenue (million), by Application 2024 & 2032
- Figure 4: North America Single Channel Pipettes Volume (K), by Application 2024 & 2032
- Figure 5: North America Single Channel Pipettes Revenue Share (%), by Application 2024 & 2032
- Figure 6: North America Single Channel Pipettes Volume Share (%), by Application 2024 & 2032
- Figure 7: North America Single Channel Pipettes Revenue (million), by Types 2024 & 2032
- Figure 8: North America Single Channel Pipettes Volume (K), by Types 2024 & 2032
- Figure 9: North America Single Channel Pipettes Revenue Share (%), by Types 2024 & 2032
- Figure 10: North America Single Channel Pipettes Volume Share (%), by Types 2024 & 2032
- Figure 11: North America Single Channel Pipettes Revenue (million), by Country 2024 & 2032
- Figure 12: North America Single Channel Pipettes Volume (K), by Country 2024 & 2032
- Figure 13: North America Single Channel Pipettes Revenue Share (%), by Country 2024 & 2032
- Figure 14: North America Single Channel Pipettes Volume Share (%), by Country 2024 & 2032
- Figure 15: South America Single Channel Pipettes Revenue (million), by Application 2024 & 2032
- Figure 16: South America Single Channel Pipettes Volume (K), by Application 2024 & 2032
- Figure 17: South America Single Channel Pipettes Revenue Share (%), by Application 2024 & 2032
- Figure 18: South America Single Channel Pipettes Volume Share (%), by Application 2024 & 2032
- Figure 19: South America Single Channel Pipettes Revenue (million), by Types 2024 & 2032
- Figure 20: South America Single Channel Pipettes Volume (K), by Types 2024 & 2032
- Figure 21: South America Single Channel Pipettes Revenue Share (%), by Types 2024 & 2032
- Figure 22: South America Single Channel Pipettes Volume Share (%), by Types 2024 & 2032
- Figure 23: South America Single Channel Pipettes Revenue (million), by Country 2024 & 2032
- Figure 24: South America Single Channel Pipettes Volume (K), by Country 2024 & 2032
- Figure 25: South America Single Channel Pipettes Revenue Share (%), by Country 2024 & 2032
- Figure 26: South America Single Channel Pipettes Volume Share (%), by Country 2024 & 2032
- Figure 27: Europe Single Channel Pipettes Revenue (million), by Application 2024 & 2032
- Figure 28: Europe Single Channel Pipettes Volume (K), by Application 2024 & 2032
- Figure 29: Europe Single Channel Pipettes Revenue Share (%), by Application 2024 & 2032
- Figure 30: Europe Single Channel Pipettes Volume Share (%), by Application 2024 & 2032
- Figure 31: Europe Single Channel Pipettes Revenue (million), by Types 2024 & 2032
- Figure 32: Europe Single Channel Pipettes Volume (K), by Types 2024 & 2032
- Figure 33: Europe Single Channel Pipettes Revenue Share (%), by Types 2024 & 2032
- Figure 34: Europe Single Channel Pipettes Volume Share (%), by Types 2024 & 2032
- Figure 35: Europe Single Channel Pipettes Revenue (million), by Country 2024 & 2032
- Figure 36: Europe Single Channel Pipettes Volume (K), by Country 2024 & 2032
- Figure 37: Europe Single Channel Pipettes Revenue Share (%), by Country 2024 & 2032
- Figure 38: Europe Single Channel Pipettes Volume Share (%), by Country 2024 & 2032
- Figure 39: Middle East & Africa Single Channel Pipettes Revenue (million), by Application 2024 & 2032
- Figure 40: Middle East & Africa Single Channel Pipettes Volume (K), by Application 2024 & 2032
- Figure 41: Middle East & Africa Single Channel Pipettes Revenue Share (%), by Application 2024 & 2032
- Figure 42: Middle East & Africa Single Channel Pipettes Volume Share (%), by Application 2024 & 2032
- Figure 43: Middle East & Africa Single Channel Pipettes Revenue (million), by Types 2024 & 2032
- Figure 44: Middle East & Africa Single Channel Pipettes Volume (K), by Types 2024 & 2032
- Figure 45: Middle East & Africa Single Channel Pipettes Revenue Share (%), by Types 2024 & 2032
- Figure 46: Middle East & Africa Single Channel Pipettes Volume Share (%), by Types 2024 & 2032
- Figure 47: Middle East & Africa Single Channel Pipettes Revenue (million), by Country 2024 & 2032
- Figure 48: Middle East & Africa Single Channel Pipettes Volume (K), by Country 2024 & 2032
- Figure 49: Middle East & Africa Single Channel Pipettes Revenue Share (%), by Country 2024 & 2032
- Figure 50: Middle East & Africa Single Channel Pipettes Volume Share (%), by Country 2024 & 2032
- Figure 51: Asia Pacific Single Channel Pipettes Revenue (million), by Application 2024 & 2032
- Figure 52: Asia Pacific Single Channel Pipettes Volume (K), by Application 2024 & 2032
- Figure 53: Asia Pacific Single Channel Pipettes Revenue Share (%), by Application 2024 & 2032
- Figure 54: Asia Pacific Single Channel Pipettes Volume Share (%), by Application 2024 & 2032
- Figure 55: Asia Pacific Single Channel Pipettes Revenue (million), by Types 2024 & 2032
- Figure 56: Asia Pacific Single Channel Pipettes Volume (K), by Types 2024 & 2032
- Figure 57: Asia Pacific Single Channel Pipettes Revenue Share (%), by Types 2024 & 2032
- Figure 58: Asia Pacific Single Channel Pipettes Volume Share (%), by Types 2024 & 2032
- Figure 59: Asia Pacific Single Channel Pipettes Revenue (million), by Country 2024 & 2032
- Figure 60: Asia Pacific Single Channel Pipettes Volume (K), by Country 2024 & 2032
- Figure 61: Asia Pacific Single Channel Pipettes Revenue Share (%), by Country 2024 & 2032
- Figure 62: Asia Pacific Single Channel Pipettes Volume Share (%), by Country 2024 & 2032
List of Tables
- Table 1: Global Single Channel Pipettes Revenue million Forecast, by Region 2019 & 2032
- Table 2: Global Single Channel Pipettes Volume K Forecast, by Region 2019 & 2032
- Table 3: Global Single Channel Pipettes Revenue million Forecast, by Application 2019 & 2032
- Table 4: Global Single Channel Pipettes Volume K Forecast, by Application 2019 & 2032
- Table 5: Global Single Channel Pipettes Revenue million Forecast, by Types 2019 & 2032
- Table 6: Global Single Channel Pipettes Volume K Forecast, by Types 2019 & 2032
- Table 7: Global Single Channel Pipettes Revenue million Forecast, by Region 2019 & 2032
- Table 8: Global Single Channel Pipettes Volume K Forecast, by Region 2019 & 2032
- Table 9: Global Single Channel Pipettes Revenue million Forecast, by Application 2019 & 2032
- Table 10: Global Single Channel Pipettes Volume K Forecast, by Application 2019 & 2032
- Table 11: Global Single Channel Pipettes Revenue million Forecast, by Types 2019 & 2032
- Table 12: Global Single Channel Pipettes Volume K Forecast, by Types 2019 & 2032
- Table 13: Global Single Channel Pipettes Revenue million Forecast, by Country 2019 & 2032
- Table 14: Global Single Channel Pipettes Volume K Forecast, by Country 2019 & 2032
- Table 15: United States Single Channel Pipettes Revenue (million) Forecast, by Application 2019 & 2032
- Table 16: United States Single Channel Pipettes Volume (K) Forecast, by Application 2019 & 2032
- Table 17: Canada Single Channel Pipettes Revenue (million) Forecast, by Application 2019 & 2032
- Table 18: Canada Single Channel Pipettes Volume (K) Forecast, by Application 2019 & 2032
- Table 19: Mexico Single Channel Pipettes Revenue (million) Forecast, by Application 2019 & 2032
- Table 20: Mexico Single Channel Pipettes Volume (K) Forecast, by Application 2019 & 2032
- Table 21: Global Single Channel Pipettes Revenue million Forecast, by Application 2019 & 2032
- Table 22: Global Single Channel Pipettes Volume K Forecast, by Application 2019 & 2032
- Table 23: Global Single Channel Pipettes Revenue million Forecast, by Types 2019 & 2032
- Table 24: Global Single Channel Pipettes Volume K Forecast, by Types 2019 & 2032
- Table 25: Global Single Channel Pipettes Revenue million Forecast, by Country 2019 & 2032
- Table 26: Global Single Channel Pipettes Volume K Forecast, by Country 2019 & 2032
- Table 27: Brazil Single Channel Pipettes Revenue (million) Forecast, by Application 2019 & 2032
- Table 28: Brazil Single Channel Pipettes Volume (K) Forecast, by Application 2019 & 2032
- Table 29: Argentina Single Channel Pipettes Revenue (million) Forecast, by Application 2019 & 2032
- Table 30: Argentina Single Channel Pipettes Volume (K) Forecast, by Application 2019 & 2032
- Table 31: Rest of South America Single Channel Pipettes Revenue (million) Forecast, by Application 2019 & 2032
- Table 32: Rest of South America Single Channel Pipettes Volume (K) Forecast, by Application 2019 & 2032
- Table 33: Global Single Channel Pipettes Revenue million Forecast, by Application 2019 & 2032
- Table 34: Global Single Channel Pipettes Volume K Forecast, by Application 2019 & 2032
- Table 35: Global Single Channel Pipettes Revenue million Forecast, by Types 2019 & 2032
- Table 36: Global Single Channel Pipettes Volume K Forecast, by Types 2019 & 2032
- Table 37: Global Single Channel Pipettes Revenue million Forecast, by Country 2019 & 2032
- Table 38: Global Single Channel Pipettes Volume K Forecast, by Country 2019 & 2032
- Table 39: United Kingdom Single Channel Pipettes Revenue (million) Forecast, by Application 2019 & 2032
- Table 40: United Kingdom Single Channel Pipettes Volume (K) Forecast, by Application 2019 & 2032
- Table 41: Germany Single Channel Pipettes Revenue (million) Forecast, by Application 2019 & 2032
- Table 42: Germany Single Channel Pipettes Volume (K) Forecast, by Application 2019 & 2032
- Table 43: France Single Channel Pipettes Revenue (million) Forecast, by Application 2019 & 2032
- Table 44: France Single Channel Pipettes Volume (K) Forecast, by Application 2019 & 2032
- Table 45: Italy Single Channel Pipettes Revenue (million) Forecast, by Application 2019 & 2032
- Table 46: Italy Single Channel Pipettes Volume (K) Forecast, by Application 2019 & 2032
- Table 47: Spain Single Channel Pipettes Revenue (million) Forecast, by Application 2019 & 2032
- Table 48: Spain Single Channel Pipettes Volume (K) Forecast, by Application 2019 & 2032
- Table 49: Russia Single Channel Pipettes Revenue (million) Forecast, by Application 2019 & 2032
- Table 50: Russia Single Channel Pipettes Volume (K) Forecast, by Application 2019 & 2032
- Table 51: Benelux Single Channel Pipettes Revenue (million) Forecast, by Application 2019 & 2032
- Table 52: Benelux Single Channel Pipettes Volume (K) Forecast, by Application 2019 & 2032
- Table 53: Nordics Single Channel Pipettes Revenue (million) Forecast, by Application 2019 & 2032
- Table 54: Nordics Single Channel Pipettes Volume (K) Forecast, by Application 2019 & 2032
- Table 55: Rest of Europe Single Channel Pipettes Revenue (million) Forecast, by Application 2019 & 2032
- Table 56: Rest of Europe Single Channel Pipettes Volume (K) Forecast, by Application 2019 & 2032
- Table 57: Global Single Channel Pipettes Revenue million Forecast, by Application 2019 & 2032
- Table 58: Global Single Channel Pipettes Volume K Forecast, by Application 2019 & 2032
- Table 59: Global Single Channel Pipettes Revenue million Forecast, by Types 2019 & 2032
- Table 60: Global Single Channel Pipettes Volume K Forecast, by Types 2019 & 2032
- Table 61: Global Single Channel Pipettes Revenue million Forecast, by Country 2019 & 2032
- Table 62: Global Single Channel Pipettes Volume K Forecast, by Country 2019 & 2032
- Table 63: Turkey Single Channel Pipettes Revenue (million) Forecast, by Application 2019 & 2032
- Table 64: Turkey Single Channel Pipettes Volume (K) Forecast, by Application 2019 & 2032
- Table 65: Israel Single Channel Pipettes Revenue (million) Forecast, by Application 2019 & 2032
- Table 66: Israel Single Channel Pipettes Volume (K) Forecast, by Application 2019 & 2032
- Table 67: GCC Single Channel Pipettes Revenue (million) Forecast, by Application 2019 & 2032
- Table 68: GCC Single Channel Pipettes Volume (K) Forecast, by Application 2019 & 2032
- Table 69: North Africa Single Channel Pipettes Revenue (million) Forecast, by Application 2019 & 2032
- Table 70: North Africa Single Channel Pipettes Volume (K) Forecast, by Application 2019 & 2032
- Table 71: South Africa Single Channel Pipettes Revenue (million) Forecast, by Application 2019 & 2032
- Table 72: South Africa Single Channel Pipettes Volume (K) Forecast, by Application 2019 & 2032
- Table 73: Rest of Middle East & Africa Single Channel Pipettes Revenue (million) Forecast, by Application 2019 & 2032
- Table 74: Rest of Middle East & Africa Single Channel Pipettes Volume (K) Forecast, by Application 2019 & 2032
- Table 75: Global Single Channel Pipettes Revenue million Forecast, by Application 2019 & 2032
- Table 76: Global Single Channel Pipettes Volume K Forecast, by Application 2019 & 2032
- Table 77: Global Single Channel Pipettes Revenue million Forecast, by Types 2019 & 2032
- Table 78: Global Single Channel Pipettes Volume K Forecast, by Types 2019 & 2032
- Table 79: Global Single Channel Pipettes Revenue million Forecast, by Country 2019 & 2032
- Table 80: Global Single Channel Pipettes Volume K Forecast, by Country 2019 & 2032
- Table 81: China Single Channel Pipettes Revenue (million) Forecast, by Application 2019 & 2032
- Table 82: China Single Channel Pipettes Volume (K) Forecast, by Application 2019 & 2032
- Table 83: India Single Channel Pipettes Revenue (million) Forecast, by Application 2019 & 2032
- Table 84: India Single Channel Pipettes Volume (K) Forecast, by Application 2019 & 2032
- Table 85: Japan Single Channel Pipettes Revenue (million) Forecast, by Application 2019 & 2032
- Table 86: Japan Single Channel Pipettes Volume (K) Forecast, by Application 2019 & 2032
- Table 87: South Korea Single Channel Pipettes Revenue (million) Forecast, by Application 2019 & 2032
- Table 88: South Korea Single Channel Pipettes Volume (K) Forecast, by Application 2019 & 2032
- Table 89: ASEAN Single Channel Pipettes Revenue (million) Forecast, by Application 2019 & 2032
- Table 90: ASEAN Single Channel Pipettes Volume (K) Forecast, by Application 2019 & 2032
- Table 91: Oceania Single Channel Pipettes Revenue (million) Forecast, by Application 2019 & 2032
- Table 92: Oceania Single Channel Pipettes Volume (K) Forecast, by Application 2019 & 2032
- Table 93: Rest of Asia Pacific Single Channel Pipettes Revenue (million) Forecast, by Application 2019 & 2032
- Table 94: Rest of Asia Pacific Single Channel Pipettes Volume (K) Forecast, by Application 2019 & 2032
Frequently Asked Questions
1. What is the projected Compound Annual Growth Rate (CAGR) of the Single Channel Pipettes?
The projected CAGR is approximately XX%.
2. Which companies are prominent players in the Single Channel Pipettes?
Key companies in the market include Thermo Fisher, Eppendorf, Biohit Healthcare, Mettler-Toledo International, CAPP, Heathrow Scientific, Oxford Lab Products, Labnet International, Gilson, VistaLab, Sartorius, BRAND, Hamilton Company, Nichiryo.
3. What are the main segments of the Single Channel Pipettes?
The market segments include Application, Types.
4. Can you provide details about the market size?
The market size is estimated to be USD XXX million as of 2022.
5. What are some drivers contributing to market growth?
N/A
6. What are the notable trends driving market growth?
N/A
7. Are there any restraints impacting market growth?
N/A
8. Can you provide examples of recent developments in the market?
N/A
9. What pricing options are available for accessing the report?
Pricing options include single-user, multi-user, and enterprise licenses priced at USD 3350.00, USD 5025.00, and USD 6700.00 respectively.
10. Is the market size provided in terms of value or volume?
The market size is provided in terms of value, measured in million and volume, measured in K.
11. Are there any specific market keywords associated with the report?
Yes, the market keyword associated with the report is "Single Channel Pipettes," which aids in identifying and referencing the specific market segment covered.
12. How do I determine which pricing option suits my needs best?
The pricing options vary based on user requirements and access needs. Individual users may opt for single-user licenses, while businesses requiring broader access may choose multi-user or enterprise licenses for cost-effective access to the report.
13. Are there any additional resources or data provided in the Single Channel Pipettes report?
While the report offers comprehensive insights, it's advisable to review the specific contents or supplementary materials provided to ascertain if additional resources or data are available.
14. How can I stay updated on further developments or reports in the Single Channel Pipettes?
To stay informed about further developments, trends, and reports in the Single Channel Pipettes, consider subscribing to industry newsletters, following relevant companies and organizations, or regularly checking reputable industry news sources and publications.
Methodology
Step 1 - Identification of Relevant Samples Size from Population Database


Step 2 - Approaches for Defining Global Market Size (Value, Volume* & Price*)

Note*: In applicable scenarios
Step 3 - Data Sources
Primary Research
- Web Analytics
- Survey Reports
- Research Institute
- Latest Research Reports
- Opinion Leaders
Secondary Research
- Annual Reports
- White Paper
- Latest Press Release
- Industry Association
- Paid Database
- Investor Presentations

Step 4 - Data Triangulation
Involves using different sources of information in order to increase the validity of a study
These sources are likely to be stakeholders in a program - participants, other researchers, program staff, other community members, and so on.
Then we put all data in single framework & apply various statistical tools to find out the dynamic on the market.
During the analysis stage, feedback from the stakeholder groups would be compared to determine areas of agreement as well as areas of divergence


