
Key Insights
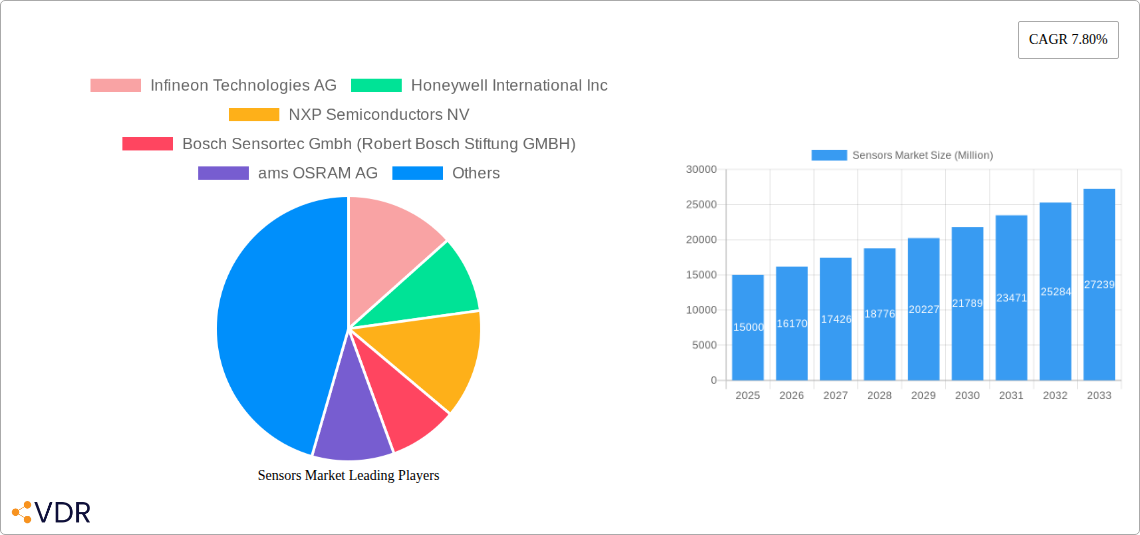
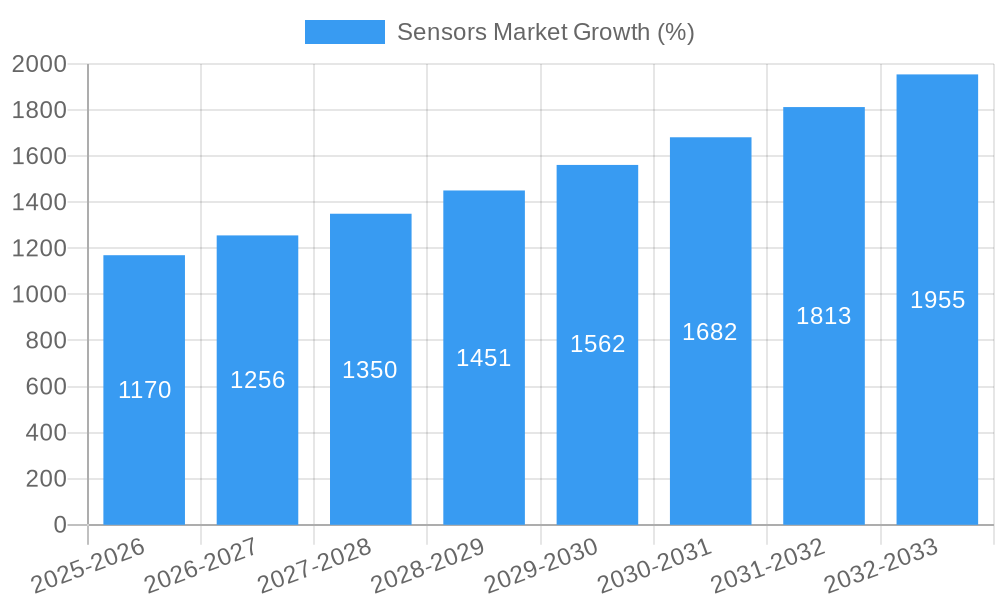
The global sensors market is experiencing robust growth, projected to reach a substantial size by 2033. A 7.80% Compound Annual Growth Rate (CAGR) from 2025 to 2033 indicates significant expansion driven by several key factors. The increasing adoption of automation across various industries, particularly automotive, consumer electronics, and industrial automation, is a primary driver. Advancements in sensor technology, such as miniaturization, improved accuracy, and increased functionality (e.g., integration of multiple sensing modalities), are further fueling market expansion. The rise of the Internet of Things (IoT) and the demand for smart devices and systems across diverse sectors are creating significant demand for diverse sensor types, including temperature, pressure, flow, and proximity sensors. Growth is also propelled by the escalating need for improved safety and efficiency in various applications, ranging from autonomous vehicles to industrial process monitoring and healthcare.
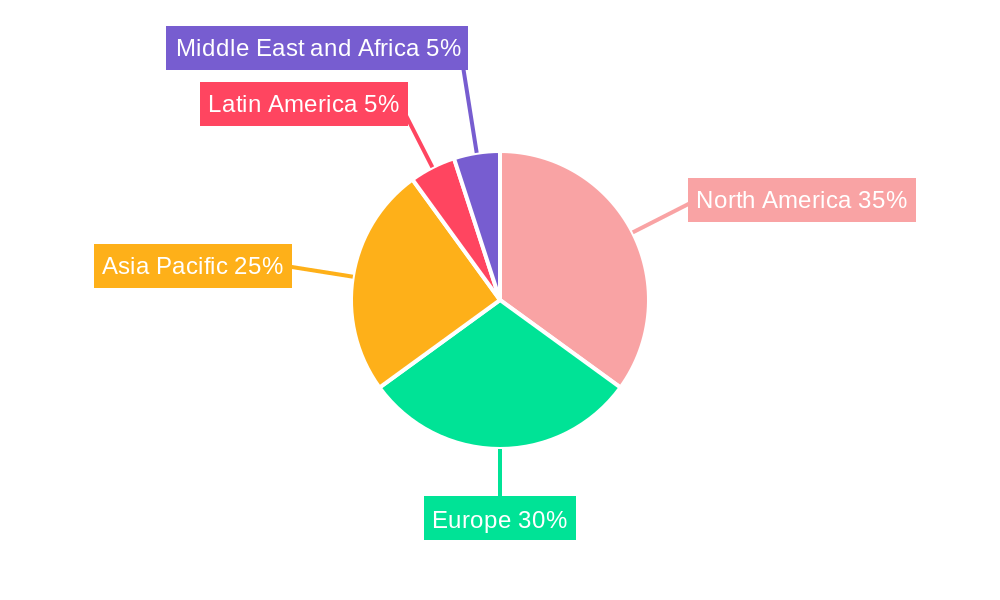
However, the market faces certain challenges. High initial investment costs for advanced sensor technologies can be a barrier to entry for smaller companies. Furthermore, the complexity of integrating sensors into existing systems and the need for robust data analytics infrastructure can limit broader adoption. Nevertheless, ongoing technological innovations, decreasing sensor costs, and increasing government support for digitalization initiatives are expected to mitigate these restraints. The market segmentation reveals substantial opportunities across diverse sensor types (optical, electrical resistance, piezoelectric, etc.) and end-user industries. The automotive sector remains a key driver, followed closely by consumer electronics and industrial applications. Geographical distribution shows significant growth potential in the Asia-Pacific region due to rapid industrialization and technological adoption. North America and Europe are expected to maintain strong market positions due to the established technological base and high consumer demand for advanced technologies.
Sensors Market: A Comprehensive Report (2019-2033)
This comprehensive report provides a detailed analysis of the global Sensors Market, encompassing market dynamics, growth trends, regional dominance, product landscape, key players, and future outlook. The study period spans from 2019 to 2033, with 2025 serving as the base and estimated year. The report segments the market by parameters measured, mode of operation, and end-user industry, offering granular insights for informed decision-making. The market is valued at xx Million units in 2025 and is projected to reach xx Million units by 2033, exhibiting a CAGR of xx% during the forecast period (2025-2033).
Sensors Market Market Dynamics & Structure
The global sensors market is characterized by a moderately concentrated landscape, with key players such as Infineon Technologies AG, Honeywell International Inc, NXP Semiconductors NV, and Bosch Sensortec GMBH holding significant market share. However, the market also features numerous smaller players, leading to competitive intensity. Technological innovation is a key driver, with advancements in miniaturization, energy efficiency, and sensor integration pushing market growth. Stringent regulatory frameworks, particularly in safety-critical applications like automotive and medical, influence market dynamics. The market faces competition from alternative technologies in specific applications, though sensors remain essential for many industries. Mergers and acquisitions (M&A) activity is moderate, with larger players strategically acquiring smaller companies to expand their product portfolio and market reach. The historical period (2019-2024) saw xx M&A deals, while the forecast period (2025-2033) is expected to see xx M&A deals.
- Market Concentration: Moderately concentrated, with top 5 players holding approximately xx% market share in 2025.
- Technological Innovation: Miniaturization, improved accuracy, and increased integration are key drivers.
- Regulatory Frameworks: Stringent safety and performance standards in automotive and medical sectors.
- Competitive Substitutes: Limited in many applications, but alternative technologies exist in niche segments.
- End-User Demographics: Growing demand from automotive, consumer electronics, and industrial sectors.
- M&A Trends: Strategic acquisitions to expand product lines and market presence.
Sensors Market Growth Trends & Insights
The Sensors market is experiencing robust growth, driven by increasing automation across various industries, the proliferation of IoT devices, and advancements in artificial intelligence (AI) and machine learning (ML). The market size increased from xx Million units in 2019 to xx Million units in 2024. This significant growth is attributed to the increasing adoption of sensors in diverse applications, including automotive safety systems, smart home devices, industrial automation, and healthcare monitoring. Technological disruptions, such as the emergence of MEMS sensors and advanced sensor fusion techniques, are further accelerating market expansion. Consumer behavior shifts toward personalized experiences and smart devices fuel demand. The market is expected to maintain a strong growth trajectory, reaching xx Million units by 2033, driven by factors such as the expanding adoption of autonomous vehicles, industrial automation advancements, and the rising popularity of wearable technology. The CAGR for the forecast period (2025-2033) is projected to be xx%. Market penetration of sensors across key end-use sectors is expected to increase from xx% in 2025 to xx% in 2033.
Dominant Regions, Countries, or Segments in Sensors Market
The automotive sector remains the largest end-user industry for sensors, driven by the increasing adoption of Advanced Driver-Assistance Systems (ADAS) and autonomous driving technologies. North America and Europe are currently leading regions in terms of market share due to high technological advancements and robust automotive industries. However, Asia-Pacific is poised for rapid growth, owing to rising consumer electronics adoption and increasing industrial automation in countries like China and India. Within the segment breakdown:
By Parameters Measured: Temperature sensors hold the largest market share in 2025 followed by pressure and proximity sensors. The fastest-growing segments are environmental and chemical sensors due to environmental monitoring applications and industrial process control.
By Mode of Operation: Optical sensors dominate the market, driven by their use in image processing and optical sensing applications. However, the growth of radar and LiDAR technologies is expected to increase the market share of these sensor types, especially in autonomous vehicles and robotics.
By End User Industry: The automotive industry is the dominant end-user segment, followed by consumer electronics, and industrial applications. The medical and wellness sectors are witnessing significant growth, propelled by the rising adoption of wearable health trackers and medical devices.
Key Drivers (by region):
- North America: Strong automotive industry, advanced technological capabilities.
- Europe: High adoption of automation and IoT technologies.
- Asia-Pacific: Rapid industrialization, rising disposable incomes, and increased consumer electronics adoption.
Sensors Market Product Landscape
The sensors market showcases a diverse product landscape featuring significant technological advancements. Recent innovations include highly integrated, miniaturized sensors with improved accuracy and lower power consumption. These advancements enable sensor integration into diverse devices, including wearables, smartphones, and industrial equipment. Unique selling propositions include superior performance, improved reliability, and enhanced functionality at reduced costs. The ongoing development of sensor fusion technologies allows for more comprehensive data acquisition and sophisticated applications. The market also displays a trend towards smart sensors, embedding processing capabilities within the sensor itself.
Key Drivers, Barriers & Challenges in Sensors Market
Key Drivers:
- Growing demand for automation across various industries
- Increased adoption of IoT and smart devices
- Advancements in AI and machine learning
- Stringent government regulations on safety and environmental monitoring
Challenges and Restraints:
- High initial investment costs for implementing sensor systems in certain industries.
- Technical complexity in sensor integration and data management.
- Potential supply chain disruptions and component shortages influencing production costs and timelines.
- Concerns regarding data privacy and security related to data generated by sensor networks.
Emerging Opportunities in Sensors Market
- Expansion into untapped markets in developing economies.
- Development of advanced sensor fusion technologies for sophisticated applications.
- Growing demand for low-power, energy-efficient sensors.
- Increasing use of sensors in smart agriculture and precision farming.
- Growth of the wearable technology market and increasing integration of sensors in wearable devices.
Growth Accelerators in the Sensors Market Industry
Technological breakthroughs in materials science, microelectronics, and sensor fusion are driving significant growth. Strategic partnerships between sensor manufacturers and system integrators are crucial for expanding market reach. Aggressive market expansion strategies by major players are focusing on emerging markets and innovative application areas. This creates new opportunities while bolstering overall market expansion.
Key Players Shaping the Sensors Market Market
- Infineon Technologies AG
- Honeywell International Inc
- NXP Semiconductors NV
- Bosch Sensortec GmbH (Robert Bosch Stiftung GMBH)
- ams OSRAM AG
- Siemens AG
- Omron Corporation
- Omega Engineering Inc
- STMicroelectronics NV
- Sick AG
- TE Connectivity Ltd
- Texas Instruments Incorporated
- Rockwell Automation Inc
- ABB Limited
Notable Milestones in Sensors Market Sector
- January 2023: Texas Instruments (TI) launched DesignCore RS-1843AOPC and RS-6843AOPC mm-wave radar sensors in collaboration with D3, enabling advanced sensing capabilities in automotive and industrial applications.
- January 2023: ams OSRAM launched the Mira 050 CMOS image sensor, a high-sensitivity, compact sensor designed for use in wearable and mobile devices, enabling enhanced image capturing and processing capabilities.
In-Depth Sensors Market Market Outlook
The sensors market is poised for continued robust growth, driven by the increasing integration of sensors into various applications across diverse industries. The convergence of technologies, such as AI, IoT, and 5G, will further accelerate market expansion. Strategic investments in R&D and the development of innovative sensor technologies will create significant opportunities for growth. The market's long-term potential is substantial, with sensors playing a crucial role in shaping the future of smart cities, autonomous vehicles, and industrial automation. Companies that can effectively address the challenges of data security, sensor integration, and supply chain management will be best positioned to capitalize on future growth opportunities.
Sensors Market Segmentation
-
1. Parameters Measured
- 1.1. Temperature
- 1.2. Pressure
- 1.3. Level
- 1.4. Flow
- 1.5. Proximity
- 1.6. Environmental
- 1.7. Chemical
- 1.8. Inertial
- 1.9. Magnetic
- 1.10. Vibration
- 1.11. Other Parameters Measured
-
2. Mode of Operation
- 2.1. Optical
- 2.2. Electrical Resistance
- 2.3. Biosensors
- 2.4. Piezoresistive
- 2.5. Image
- 2.6. Capacitive
- 2.7. Piezoelectric
- 2.8. LiDAR
- 2.9. Radar
- 2.10. Other Modes of Operation
-
3. End user Industry
- 3.1. Automotive
-
3.2. Consumer Electronics
- 3.2.1. Smartphones
- 3.2.2. Tablets, Laptops, and Computers
- 3.2.3. Wearable Devices
- 3.2.4. Smart Appliances or Devices
- 3.2.5. Other Consumer Electronics
- 3.3. Energy
- 3.4. Industrial and Other
- 3.5. Medical and Wellness
- 3.6. Construction, Agriculture, and Mining
- 3.7. Aerospace
- 3.8. Defense
Sensors Market Segmentation By Geography
- 1. North America
- 2. Europe
- 3. Asia Pacific
- 4. Latin America
- 5. Middle East and Africa
Sensors Market REPORT HIGHLIGHTS
| Aspects | Details |
|---|---|
| Study Period | 2019-2033 |
| Base Year | 2024 |
| Estimated Year | 2025 |
| Forecast Period | 2025-2033 |
| Historical Period | 2019-2024 |
| Growth Rate | CAGR of 7.80% from 2019-2033 |
| Segmentation |
|
Table of Contents
- 1. Introduction
- 1.1. Research Scope
- 1.2. Market Segmentation
- 1.3. Research Methodology
- 1.4. Definitions and Assumptions
- 2. Executive Summary
- 2.1. Introduction
- 3. Market Dynamics
- 3.1. Introduction
- 3.2. Market Drivers
- 3.2.1. Technological Advancement and Decreasing Cost of Sensors; Emergence of Automation and Industry 4.0
- 3.3. Market Restrains
- 3.3.1. High Initial Cost Involved
- 3.4. Market Trends
- 3.4.1. The Consumer Electronics Segment is Anticipated to Drive the Growth of the Studied Market
- 4. Market Factor Analysis
- 4.1. Porters Five Forces
- 4.2. Supply/Value Chain
- 4.3. PESTEL analysis
- 4.4. Market Entropy
- 4.5. Patent/Trademark Analysis
- 5. Global Sensors Market Analysis, Insights and Forecast, 2019-2031
- 5.1. Market Analysis, Insights and Forecast - by Parameters Measured
- 5.1.1. Temperature
- 5.1.2. Pressure
- 5.1.3. Level
- 5.1.4. Flow
- 5.1.5. Proximity
- 5.1.6. Environmental
- 5.1.7. Chemical
- 5.1.8. Inertial
- 5.1.9. Magnetic
- 5.1.10. Vibration
- 5.1.11. Other Parameters Measured
- 5.2. Market Analysis, Insights and Forecast - by Mode of Operation
- 5.2.1. Optical
- 5.2.2. Electrical Resistance
- 5.2.3. Biosensors
- 5.2.4. Piezoresistive
- 5.2.5. Image
- 5.2.6. Capacitive
- 5.2.7. Piezoelectric
- 5.2.8. LiDAR
- 5.2.9. Radar
- 5.2.10. Other Modes of Operation
- 5.3. Market Analysis, Insights and Forecast - by End user Industry
- 5.3.1. Automotive
- 5.3.2. Consumer Electronics
- 5.3.2.1. Smartphones
- 5.3.2.2. Tablets, Laptops, and Computers
- 5.3.2.3. Wearable Devices
- 5.3.2.4. Smart Appliances or Devices
- 5.3.2.5. Other Consumer Electronics
- 5.3.3. Energy
- 5.3.4. Industrial and Other
- 5.3.5. Medical and Wellness
- 5.3.6. Construction, Agriculture, and Mining
- 5.3.7. Aerospace
- 5.3.8. Defense
- 5.4. Market Analysis, Insights and Forecast - by Region
- 5.4.1. North America
- 5.4.2. Europe
- 5.4.3. Asia Pacific
- 5.4.4. Latin America
- 5.4.5. Middle East and Africa
- 5.1. Market Analysis, Insights and Forecast - by Parameters Measured
- 6. North America Sensors Market Analysis, Insights and Forecast, 2019-2031
- 6.1. Market Analysis, Insights and Forecast - by Parameters Measured
- 6.1.1. Temperature
- 6.1.2. Pressure
- 6.1.3. Level
- 6.1.4. Flow
- 6.1.5. Proximity
- 6.1.6. Environmental
- 6.1.7. Chemical
- 6.1.8. Inertial
- 6.1.9. Magnetic
- 6.1.10. Vibration
- 6.1.11. Other Parameters Measured
- 6.2. Market Analysis, Insights and Forecast - by Mode of Operation
- 6.2.1. Optical
- 6.2.2. Electrical Resistance
- 6.2.3. Biosensors
- 6.2.4. Piezoresistive
- 6.2.5. Image
- 6.2.6. Capacitive
- 6.2.7. Piezoelectric
- 6.2.8. LiDAR
- 6.2.9. Radar
- 6.2.10. Other Modes of Operation
- 6.3. Market Analysis, Insights and Forecast - by End user Industry
- 6.3.1. Automotive
- 6.3.2. Consumer Electronics
- 6.3.2.1. Smartphones
- 6.3.2.2. Tablets, Laptops, and Computers
- 6.3.2.3. Wearable Devices
- 6.3.2.4. Smart Appliances or Devices
- 6.3.2.5. Other Consumer Electronics
- 6.3.3. Energy
- 6.3.4. Industrial and Other
- 6.3.5. Medical and Wellness
- 6.3.6. Construction, Agriculture, and Mining
- 6.3.7. Aerospace
- 6.3.8. Defense
- 6.1. Market Analysis, Insights and Forecast - by Parameters Measured
- 7. Europe Sensors Market Analysis, Insights and Forecast, 2019-2031
- 7.1. Market Analysis, Insights and Forecast - by Parameters Measured
- 7.1.1. Temperature
- 7.1.2. Pressure
- 7.1.3. Level
- 7.1.4. Flow
- 7.1.5. Proximity
- 7.1.6. Environmental
- 7.1.7. Chemical
- 7.1.8. Inertial
- 7.1.9. Magnetic
- 7.1.10. Vibration
- 7.1.11. Other Parameters Measured
- 7.2. Market Analysis, Insights and Forecast - by Mode of Operation
- 7.2.1. Optical
- 7.2.2. Electrical Resistance
- 7.2.3. Biosensors
- 7.2.4. Piezoresistive
- 7.2.5. Image
- 7.2.6. Capacitive
- 7.2.7. Piezoelectric
- 7.2.8. LiDAR
- 7.2.9. Radar
- 7.2.10. Other Modes of Operation
- 7.3. Market Analysis, Insights and Forecast - by End user Industry
- 7.3.1. Automotive
- 7.3.2. Consumer Electronics
- 7.3.2.1. Smartphones
- 7.3.2.2. Tablets, Laptops, and Computers
- 7.3.2.3. Wearable Devices
- 7.3.2.4. Smart Appliances or Devices
- 7.3.2.5. Other Consumer Electronics
- 7.3.3. Energy
- 7.3.4. Industrial and Other
- 7.3.5. Medical and Wellness
- 7.3.6. Construction, Agriculture, and Mining
- 7.3.7. Aerospace
- 7.3.8. Defense
- 7.1. Market Analysis, Insights and Forecast - by Parameters Measured
- 8. Asia Pacific Sensors Market Analysis, Insights and Forecast, 2019-2031
- 8.1. Market Analysis, Insights and Forecast - by Parameters Measured
- 8.1.1. Temperature
- 8.1.2. Pressure
- 8.1.3. Level
- 8.1.4. Flow
- 8.1.5. Proximity
- 8.1.6. Environmental
- 8.1.7. Chemical
- 8.1.8. Inertial
- 8.1.9. Magnetic
- 8.1.10. Vibration
- 8.1.11. Other Parameters Measured
- 8.2. Market Analysis, Insights and Forecast - by Mode of Operation
- 8.2.1. Optical
- 8.2.2. Electrical Resistance
- 8.2.3. Biosensors
- 8.2.4. Piezoresistive
- 8.2.5. Image
- 8.2.6. Capacitive
- 8.2.7. Piezoelectric
- 8.2.8. LiDAR
- 8.2.9. Radar
- 8.2.10. Other Modes of Operation
- 8.3. Market Analysis, Insights and Forecast - by End user Industry
- 8.3.1. Automotive
- 8.3.2. Consumer Electronics
- 8.3.2.1. Smartphones
- 8.3.2.2. Tablets, Laptops, and Computers
- 8.3.2.3. Wearable Devices
- 8.3.2.4. Smart Appliances or Devices
- 8.3.2.5. Other Consumer Electronics
- 8.3.3. Energy
- 8.3.4. Industrial and Other
- 8.3.5. Medical and Wellness
- 8.3.6. Construction, Agriculture, and Mining
- 8.3.7. Aerospace
- 8.3.8. Defense
- 8.1. Market Analysis, Insights and Forecast - by Parameters Measured
- 9. Latin America Sensors Market Analysis, Insights and Forecast, 2019-2031
- 9.1. Market Analysis, Insights and Forecast - by Parameters Measured
- 9.1.1. Temperature
- 9.1.2. Pressure
- 9.1.3. Level
- 9.1.4. Flow
- 9.1.5. Proximity
- 9.1.6. Environmental
- 9.1.7. Chemical
- 9.1.8. Inertial
- 9.1.9. Magnetic
- 9.1.10. Vibration
- 9.1.11. Other Parameters Measured
- 9.2. Market Analysis, Insights and Forecast - by Mode of Operation
- 9.2.1. Optical
- 9.2.2. Electrical Resistance
- 9.2.3. Biosensors
- 9.2.4. Piezoresistive
- 9.2.5. Image
- 9.2.6. Capacitive
- 9.2.7. Piezoelectric
- 9.2.8. LiDAR
- 9.2.9. Radar
- 9.2.10. Other Modes of Operation
- 9.3. Market Analysis, Insights and Forecast - by End user Industry
- 9.3.1. Automotive
- 9.3.2. Consumer Electronics
- 9.3.2.1. Smartphones
- 9.3.2.2. Tablets, Laptops, and Computers
- 9.3.2.3. Wearable Devices
- 9.3.2.4. Smart Appliances or Devices
- 9.3.2.5. Other Consumer Electronics
- 9.3.3. Energy
- 9.3.4. Industrial and Other
- 9.3.5. Medical and Wellness
- 9.3.6. Construction, Agriculture, and Mining
- 9.3.7. Aerospace
- 9.3.8. Defense
- 9.1. Market Analysis, Insights and Forecast - by Parameters Measured
- 10. Middle East and Africa Sensors Market Analysis, Insights and Forecast, 2019-2031
- 10.1. Market Analysis, Insights and Forecast - by Parameters Measured
- 10.1.1. Temperature
- 10.1.2. Pressure
- 10.1.3. Level
- 10.1.4. Flow
- 10.1.5. Proximity
- 10.1.6. Environmental
- 10.1.7. Chemical
- 10.1.8. Inertial
- 10.1.9. Magnetic
- 10.1.10. Vibration
- 10.1.11. Other Parameters Measured
- 10.2. Market Analysis, Insights and Forecast - by Mode of Operation
- 10.2.1. Optical
- 10.2.2. Electrical Resistance
- 10.2.3. Biosensors
- 10.2.4. Piezoresistive
- 10.2.5. Image
- 10.2.6. Capacitive
- 10.2.7. Piezoelectric
- 10.2.8. LiDAR
- 10.2.9. Radar
- 10.2.10. Other Modes of Operation
- 10.3. Market Analysis, Insights and Forecast - by End user Industry
- 10.3.1. Automotive
- 10.3.2. Consumer Electronics
- 10.3.2.1. Smartphones
- 10.3.2.2. Tablets, Laptops, and Computers
- 10.3.2.3. Wearable Devices
- 10.3.2.4. Smart Appliances or Devices
- 10.3.2.5. Other Consumer Electronics
- 10.3.3. Energy
- 10.3.4. Industrial and Other
- 10.3.5. Medical and Wellness
- 10.3.6. Construction, Agriculture, and Mining
- 10.3.7. Aerospace
- 10.3.8. Defense
- 10.1. Market Analysis, Insights and Forecast - by Parameters Measured
- 11. North America Sensors Market Analysis, Insights and Forecast, 2019-2031
- 11.1. Market Analysis, Insights and Forecast - By Country/Sub-region
- 11.1.1.
- 12. Europe Sensors Market Analysis, Insights and Forecast, 2019-2031
- 12.1. Market Analysis, Insights and Forecast - By Country/Sub-region
- 12.1.1.
- 13. Asia Pacific Sensors Market Analysis, Insights and Forecast, 2019-2031
- 13.1. Market Analysis, Insights and Forecast - By Country/Sub-region
- 13.1.1.
- 14. Latin America Sensors Market Analysis, Insights and Forecast, 2019-2031
- 14.1. Market Analysis, Insights and Forecast - By Country/Sub-region
- 14.1.1.
- 15. Middle East and Africa Sensors Market Analysis, Insights and Forecast, 2019-2031
- 15.1. Market Analysis, Insights and Forecast - By Country/Sub-region
- 15.1.1.
- 16. Competitive Analysis
- 16.1. Global Market Share Analysis 2024
- 16.2. Company Profiles
- 16.2.1 Infineon Technologies AG
- 16.2.1.1. Overview
- 16.2.1.2. Products
- 16.2.1.3. SWOT Analysis
- 16.2.1.4. Recent Developments
- 16.2.1.5. Financials (Based on Availability)
- 16.2.2 Honeywell International Inc
- 16.2.2.1. Overview
- 16.2.2.2. Products
- 16.2.2.3. SWOT Analysis
- 16.2.2.4. Recent Developments
- 16.2.2.5. Financials (Based on Availability)
- 16.2.3 NXP Semiconductors NV
- 16.2.3.1. Overview
- 16.2.3.2. Products
- 16.2.3.3. SWOT Analysis
- 16.2.3.4. Recent Developments
- 16.2.3.5. Financials (Based on Availability)
- 16.2.4 Bosch Sensortec Gmbh (Robert Bosch Stiftung GMBH)
- 16.2.4.1. Overview
- 16.2.4.2. Products
- 16.2.4.3. SWOT Analysis
- 16.2.4.4. Recent Developments
- 16.2.4.5. Financials (Based on Availability)
- 16.2.5 ams OSRAM AG
- 16.2.5.1. Overview
- 16.2.5.2. Products
- 16.2.5.3. SWOT Analysis
- 16.2.5.4. Recent Developments
- 16.2.5.5. Financials (Based on Availability)
- 16.2.6 Siemens AG
- 16.2.6.1. Overview
- 16.2.6.2. Products
- 16.2.6.3. SWOT Analysis
- 16.2.6.4. Recent Developments
- 16.2.6.5. Financials (Based on Availability)
- 16.2.7 Omron Corporation*List Not Exhaustive
- 16.2.7.1. Overview
- 16.2.7.2. Products
- 16.2.7.3. SWOT Analysis
- 16.2.7.4. Recent Developments
- 16.2.7.5. Financials (Based on Availability)
- 16.2.8 Omega Engineering Inc
- 16.2.8.1. Overview
- 16.2.8.2. Products
- 16.2.8.3. SWOT Analysis
- 16.2.8.4. Recent Developments
- 16.2.8.5. Financials (Based on Availability)
- 16.2.9 STMicroelectronics NV
- 16.2.9.1. Overview
- 16.2.9.2. Products
- 16.2.9.3. SWOT Analysis
- 16.2.9.4. Recent Developments
- 16.2.9.5. Financials (Based on Availability)
- 16.2.10 Sick AG
- 16.2.10.1. Overview
- 16.2.10.2. Products
- 16.2.10.3. SWOT Analysis
- 16.2.10.4. Recent Developments
- 16.2.10.5. Financials (Based on Availability)
- 16.2.11 TE Connectivity Ltd
- 16.2.11.1. Overview
- 16.2.11.2. Products
- 16.2.11.3. SWOT Analysis
- 16.2.11.4. Recent Developments
- 16.2.11.5. Financials (Based on Availability)
- 16.2.12 Texas Instruments Incorporated
- 16.2.12.1. Overview
- 16.2.12.2. Products
- 16.2.12.3. SWOT Analysis
- 16.2.12.4. Recent Developments
- 16.2.12.5. Financials (Based on Availability)
- 16.2.13 Rockwell Automation Inc
- 16.2.13.1. Overview
- 16.2.13.2. Products
- 16.2.13.3. SWOT Analysis
- 16.2.13.4. Recent Developments
- 16.2.13.5. Financials (Based on Availability)
- 16.2.14 ABB Limited
- 16.2.14.1. Overview
- 16.2.14.2. Products
- 16.2.14.3. SWOT Analysis
- 16.2.14.4. Recent Developments
- 16.2.14.5. Financials (Based on Availability)
- 16.2.1 Infineon Technologies AG
List of Figures
- Figure 1: Global Sensors Market Revenue Breakdown (Million, %) by Region 2024 & 2032
- Figure 2: North America Sensors Market Revenue (Million), by Country 2024 & 2032
- Figure 3: North America Sensors Market Revenue Share (%), by Country 2024 & 2032
- Figure 4: Europe Sensors Market Revenue (Million), by Country 2024 & 2032
- Figure 5: Europe Sensors Market Revenue Share (%), by Country 2024 & 2032
- Figure 6: Asia Pacific Sensors Market Revenue (Million), by Country 2024 & 2032
- Figure 7: Asia Pacific Sensors Market Revenue Share (%), by Country 2024 & 2032
- Figure 8: Latin America Sensors Market Revenue (Million), by Country 2024 & 2032
- Figure 9: Latin America Sensors Market Revenue Share (%), by Country 2024 & 2032
- Figure 10: Middle East and Africa Sensors Market Revenue (Million), by Country 2024 & 2032
- Figure 11: Middle East and Africa Sensors Market Revenue Share (%), by Country 2024 & 2032
- Figure 12: North America Sensors Market Revenue (Million), by Parameters Measured 2024 & 2032
- Figure 13: North America Sensors Market Revenue Share (%), by Parameters Measured 2024 & 2032
- Figure 14: North America Sensors Market Revenue (Million), by Mode of Operation 2024 & 2032
- Figure 15: North America Sensors Market Revenue Share (%), by Mode of Operation 2024 & 2032
- Figure 16: North America Sensors Market Revenue (Million), by End user Industry 2024 & 2032
- Figure 17: North America Sensors Market Revenue Share (%), by End user Industry 2024 & 2032
- Figure 18: North America Sensors Market Revenue (Million), by Country 2024 & 2032
- Figure 19: North America Sensors Market Revenue Share (%), by Country 2024 & 2032
- Figure 20: Europe Sensors Market Revenue (Million), by Parameters Measured 2024 & 2032
- Figure 21: Europe Sensors Market Revenue Share (%), by Parameters Measured 2024 & 2032
- Figure 22: Europe Sensors Market Revenue (Million), by Mode of Operation 2024 & 2032
- Figure 23: Europe Sensors Market Revenue Share (%), by Mode of Operation 2024 & 2032
- Figure 24: Europe Sensors Market Revenue (Million), by End user Industry 2024 & 2032
- Figure 25: Europe Sensors Market Revenue Share (%), by End user Industry 2024 & 2032
- Figure 26: Europe Sensors Market Revenue (Million), by Country 2024 & 2032
- Figure 27: Europe Sensors Market Revenue Share (%), by Country 2024 & 2032
- Figure 28: Asia Pacific Sensors Market Revenue (Million), by Parameters Measured 2024 & 2032
- Figure 29: Asia Pacific Sensors Market Revenue Share (%), by Parameters Measured 2024 & 2032
- Figure 30: Asia Pacific Sensors Market Revenue (Million), by Mode of Operation 2024 & 2032
- Figure 31: Asia Pacific Sensors Market Revenue Share (%), by Mode of Operation 2024 & 2032
- Figure 32: Asia Pacific Sensors Market Revenue (Million), by End user Industry 2024 & 2032
- Figure 33: Asia Pacific Sensors Market Revenue Share (%), by End user Industry 2024 & 2032
- Figure 34: Asia Pacific Sensors Market Revenue (Million), by Country 2024 & 2032
- Figure 35: Asia Pacific Sensors Market Revenue Share (%), by Country 2024 & 2032
- Figure 36: Latin America Sensors Market Revenue (Million), by Parameters Measured 2024 & 2032
- Figure 37: Latin America Sensors Market Revenue Share (%), by Parameters Measured 2024 & 2032
- Figure 38: Latin America Sensors Market Revenue (Million), by Mode of Operation 2024 & 2032
- Figure 39: Latin America Sensors Market Revenue Share (%), by Mode of Operation 2024 & 2032
- Figure 40: Latin America Sensors Market Revenue (Million), by End user Industry 2024 & 2032
- Figure 41: Latin America Sensors Market Revenue Share (%), by End user Industry 2024 & 2032
- Figure 42: Latin America Sensors Market Revenue (Million), by Country 2024 & 2032
- Figure 43: Latin America Sensors Market Revenue Share (%), by Country 2024 & 2032
- Figure 44: Middle East and Africa Sensors Market Revenue (Million), by Parameters Measured 2024 & 2032
- Figure 45: Middle East and Africa Sensors Market Revenue Share (%), by Parameters Measured 2024 & 2032
- Figure 46: Middle East and Africa Sensors Market Revenue (Million), by Mode of Operation 2024 & 2032
- Figure 47: Middle East and Africa Sensors Market Revenue Share (%), by Mode of Operation 2024 & 2032
- Figure 48: Middle East and Africa Sensors Market Revenue (Million), by End user Industry 2024 & 2032
- Figure 49: Middle East and Africa Sensors Market Revenue Share (%), by End user Industry 2024 & 2032
- Figure 50: Middle East and Africa Sensors Market Revenue (Million), by Country 2024 & 2032
- Figure 51: Middle East and Africa Sensors Market Revenue Share (%), by Country 2024 & 2032
List of Tables
- Table 1: Global Sensors Market Revenue Million Forecast, by Region 2019 & 2032
- Table 2: Global Sensors Market Revenue Million Forecast, by Parameters Measured 2019 & 2032
- Table 3: Global Sensors Market Revenue Million Forecast, by Mode of Operation 2019 & 2032
- Table 4: Global Sensors Market Revenue Million Forecast, by End user Industry 2019 & 2032
- Table 5: Global Sensors Market Revenue Million Forecast, by Region 2019 & 2032
- Table 6: Global Sensors Market Revenue Million Forecast, by Country 2019 & 2032
- Table 7: Sensors Market Revenue (Million) Forecast, by Application 2019 & 2032
- Table 8: Global Sensors Market Revenue Million Forecast, by Country 2019 & 2032
- Table 9: Sensors Market Revenue (Million) Forecast, by Application 2019 & 2032
- Table 10: Global Sensors Market Revenue Million Forecast, by Country 2019 & 2032
- Table 11: Sensors Market Revenue (Million) Forecast, by Application 2019 & 2032
- Table 12: Global Sensors Market Revenue Million Forecast, by Country 2019 & 2032
- Table 13: Sensors Market Revenue (Million) Forecast, by Application 2019 & 2032
- Table 14: Global Sensors Market Revenue Million Forecast, by Country 2019 & 2032
- Table 15: Sensors Market Revenue (Million) Forecast, by Application 2019 & 2032
- Table 16: Global Sensors Market Revenue Million Forecast, by Parameters Measured 2019 & 2032
- Table 17: Global Sensors Market Revenue Million Forecast, by Mode of Operation 2019 & 2032
- Table 18: Global Sensors Market Revenue Million Forecast, by End user Industry 2019 & 2032
- Table 19: Global Sensors Market Revenue Million Forecast, by Country 2019 & 2032
- Table 20: Global Sensors Market Revenue Million Forecast, by Parameters Measured 2019 & 2032
- Table 21: Global Sensors Market Revenue Million Forecast, by Mode of Operation 2019 & 2032
- Table 22: Global Sensors Market Revenue Million Forecast, by End user Industry 2019 & 2032
- Table 23: Global Sensors Market Revenue Million Forecast, by Country 2019 & 2032
- Table 24: Global Sensors Market Revenue Million Forecast, by Parameters Measured 2019 & 2032
- Table 25: Global Sensors Market Revenue Million Forecast, by Mode of Operation 2019 & 2032
- Table 26: Global Sensors Market Revenue Million Forecast, by End user Industry 2019 & 2032
- Table 27: Global Sensors Market Revenue Million Forecast, by Country 2019 & 2032
- Table 28: Global Sensors Market Revenue Million Forecast, by Parameters Measured 2019 & 2032
- Table 29: Global Sensors Market Revenue Million Forecast, by Mode of Operation 2019 & 2032
- Table 30: Global Sensors Market Revenue Million Forecast, by End user Industry 2019 & 2032
- Table 31: Global Sensors Market Revenue Million Forecast, by Country 2019 & 2032
- Table 32: Global Sensors Market Revenue Million Forecast, by Parameters Measured 2019 & 2032
- Table 33: Global Sensors Market Revenue Million Forecast, by Mode of Operation 2019 & 2032
- Table 34: Global Sensors Market Revenue Million Forecast, by End user Industry 2019 & 2032
- Table 35: Global Sensors Market Revenue Million Forecast, by Country 2019 & 2032
Frequently Asked Questions
1. What is the projected Compound Annual Growth Rate (CAGR) of the Sensors Market?
The projected CAGR is approximately 7.80%.
2. Which companies are prominent players in the Sensors Market?
Key companies in the market include Infineon Technologies AG, Honeywell International Inc, NXP Semiconductors NV, Bosch Sensortec Gmbh (Robert Bosch Stiftung GMBH), ams OSRAM AG, Siemens AG, Omron Corporation*List Not Exhaustive, Omega Engineering Inc, STMicroelectronics NV, Sick AG, TE Connectivity Ltd, Texas Instruments Incorporated, Rockwell Automation Inc, ABB Limited.
3. What are the main segments of the Sensors Market?
The market segments include Parameters Measured, Mode of Operation, End user Industry.
4. Can you provide details about the market size?
The market size is estimated to be USD XX Million as of 2022.
5. What are some drivers contributing to market growth?
Technological Advancement and Decreasing Cost of Sensors; Emergence of Automation and Industry 4.0.
6. What are the notable trends driving market growth?
The Consumer Electronics Segment is Anticipated to Drive the Growth of the Studied Market.
7. Are there any restraints impacting market growth?
High Initial Cost Involved.
8. Can you provide examples of recent developments in the market?
January 2023: Texas Instruments (TI) collaborated with D3 to launch their DesignCore RS-1843AOPC and RS-6843AOPC mm-wave radar sensors. These new versions facilitated the implementation of many different mm-wave radar algorithms to measure, detect, and track. Moreover, the production-intent sensors feature a 1-inch cube form factor, a heat-spreading metal body, and mounting tabs. They may be utilized with a PC or embedded platform to provide field testing, algorithm development, sensing evaluation, and application demonstrations. Automotive applications supported by these sensors comprise parking assist and collision avoidance, followed by industrial applications supported by these sensors, including robotics, industrial vehicle systems, autonomous machines, and facility monitoring. The sensors can also be employed in many other use cases with a tethered host processor or stand-alone.
9. What pricing options are available for accessing the report?
Pricing options include single-user, multi-user, and enterprise licenses priced at USD 4750, USD 5250, and USD 8750 respectively.
10. Is the market size provided in terms of value or volume?
The market size is provided in terms of value, measured in Million.
11. Are there any specific market keywords associated with the report?
Yes, the market keyword associated with the report is "Sensors Market," which aids in identifying and referencing the specific market segment covered.
12. How do I determine which pricing option suits my needs best?
The pricing options vary based on user requirements and access needs. Individual users may opt for single-user licenses, while businesses requiring broader access may choose multi-user or enterprise licenses for cost-effective access to the report.
13. Are there any additional resources or data provided in the Sensors Market report?
While the report offers comprehensive insights, it's advisable to review the specific contents or supplementary materials provided to ascertain if additional resources or data are available.
14. How can I stay updated on further developments or reports in the Sensors Market?
To stay informed about further developments, trends, and reports in the Sensors Market, consider subscribing to industry newsletters, following relevant companies and organizations, or regularly checking reputable industry news sources and publications.
Methodology
Step 1 - Identification of Relevant Samples Size from Population Database


Step 2 - Approaches for Defining Global Market Size (Value, Volume* & Price*)

Note*: In applicable scenarios
Step 3 - Data Sources
Primary Research
- Web Analytics
- Survey Reports
- Research Institute
- Latest Research Reports
- Opinion Leaders
Secondary Research
- Annual Reports
- White Paper
- Latest Press Release
- Industry Association
- Paid Database
- Investor Presentations

Step 4 - Data Triangulation
Involves using different sources of information in order to increase the validity of a study
These sources are likely to be stakeholders in a program - participants, other researchers, program staff, other community members, and so on.
Then we put all data in single framework & apply various statistical tools to find out the dynamic on the market.
During the analysis stage, feedback from the stakeholder groups would be compared to determine areas of agreement as well as areas of divergence


