
Key Insights
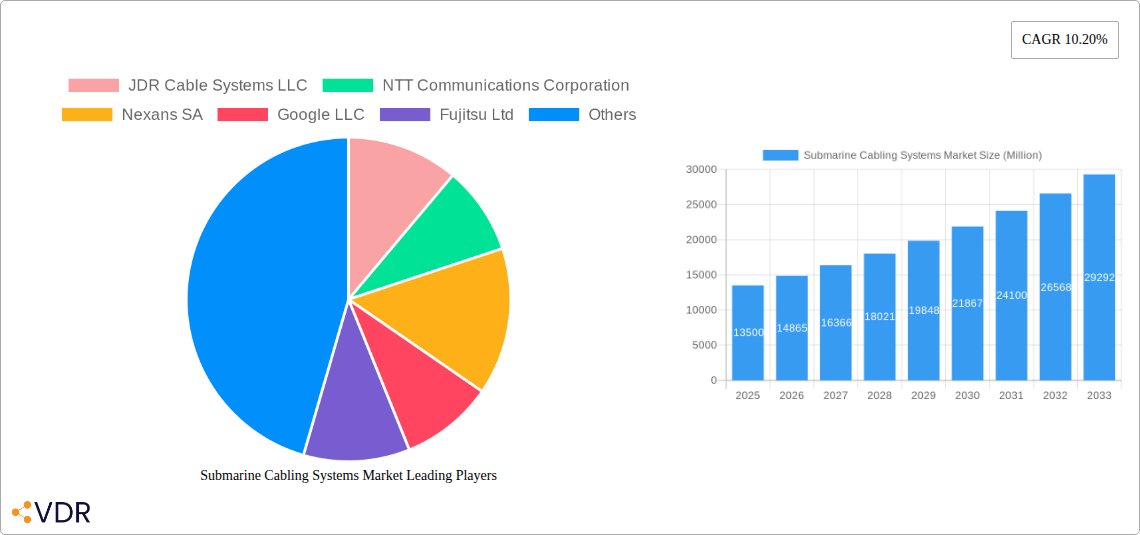
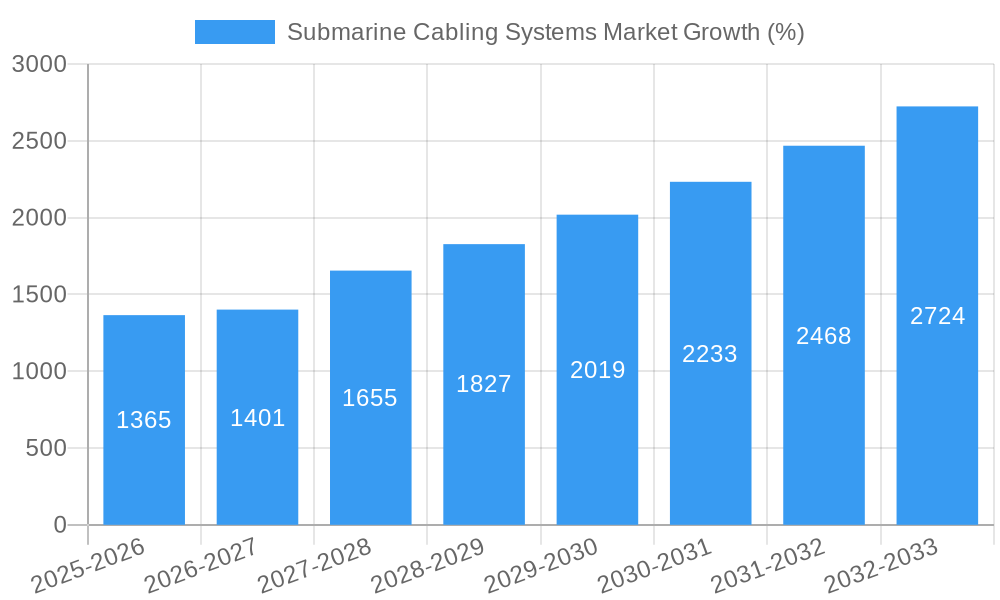
The global submarine cabling systems market, valued at $13.5 billion in 2025, is projected to experience robust growth, driven by the escalating demand for high-speed internet connectivity, burgeoning data centers, and the expansion of offshore renewable energy infrastructure. A Compound Annual Growth Rate (CAGR) of 10.2% from 2025 to 2033 signifies a significant market expansion, exceeding $30 billion by the end of the forecast period. This growth is fueled by several key factors. The increasing reliance on cloud computing and the proliferation of connected devices necessitate robust and high-capacity submarine cable systems. Furthermore, governments and private sector investments in undersea infrastructure development, particularly in underserved regions, will further stimulate market expansion. The segment encompassing wet plant products is expected to dominate the market due to their advanced capabilities in handling large data volumes and accommodating future technological advancements. Competition within the market is intense, with established players like JDR Cable Systems LLC, Nexans SA, and SubCom LLC vying for market share alongside technological giants like Google LLC and NTT Communications Corporation. Geographic expansion, particularly in the Asia-Pacific region driven by strong economic growth and increasing digitalization in emerging markets like India and Southeast Asia, presents substantial growth opportunities. While regulatory hurdles and the high initial capital investment needed for deploying submarine cable systems pose challenges, the overall market outlook remains strongly positive.
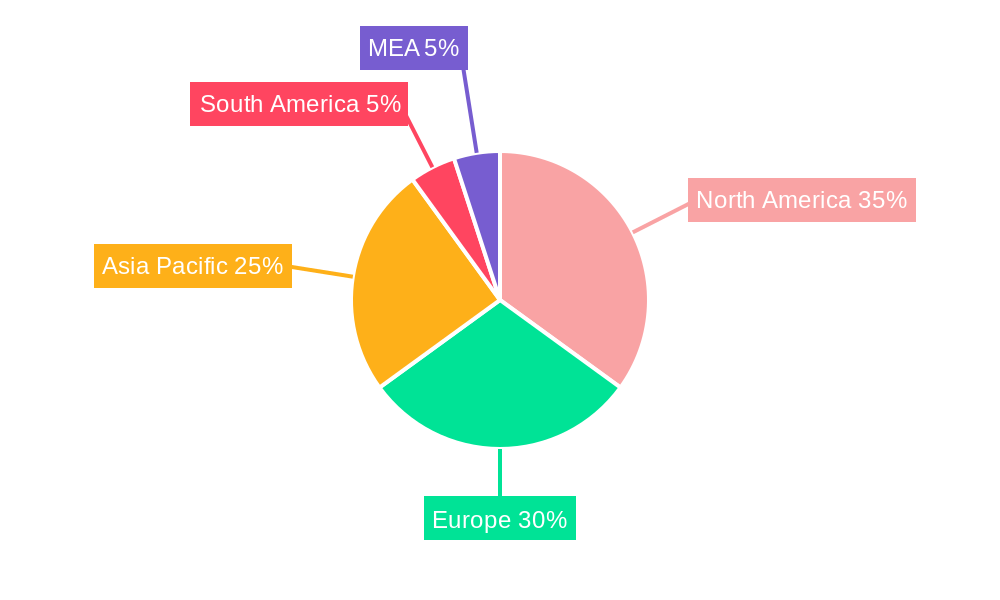
The market segmentation reveals a preference towards multiple ownership systems, reflecting the collaborative nature of large-scale submarine cable projects. North America and Europe currently represent the largest regional markets, but Asia-Pacific is anticipated to exhibit the fastest growth due to its increasing digital transformation and burgeoning data consumption. The successful deployment of 5G networks and the ongoing development of 6G technologies will also fuel future demand for advanced submarine cable infrastructure capable of handling exponentially increasing bandwidth requirements. While factors like geopolitical instability and potential risks associated with cable damage can hinder growth, the long-term demand for reliable, high-capacity undersea communication is expected to outweigh these challenges, sustaining the market's upward trajectory.
Submarine Cabling Systems Market: A Comprehensive Market Report (2019-2033)
This comprehensive report provides an in-depth analysis of the Submarine Cabling Systems market, encompassing market dynamics, growth trends, regional dominance, product landscapes, key players, and future outlook. The study period covers 2019-2033, with 2025 as the base and estimated year, and a forecast period of 2025-2033. The market is segmented by ownership type (Multiple Ownership System, Single Ownership System, Multilateral Development Banks) and type (Dry Plant Products, Wet Plant Products). The report's value is presented in Million units.
Submarine Cabling Systems Market Dynamics & Structure
The Submarine Cabling Systems market is characterized by a moderately concentrated landscape with key players vying for market share. Technological innovation, particularly in higher capacity and more resilient cable designs, is a primary growth driver. Stringent regulatory frameworks concerning submarine cable laying and maintenance influence market dynamics. Competitive substitutes, like satellite communication, pose challenges but also fuel innovation. End-user demographics, primarily driven by increasing data consumption from telecom operators and large tech companies, shapes market demand. The market has witnessed a moderate level of M&A activity, with larger players seeking to consolidate their market position.
- Market Concentration: Moderately concentrated, with top 5 players holding approximately xx% of market share in 2024.
- Technological Innovation: Focus on higher capacity fiber optic cables, improved repeater technology, and enhanced network resilience.
- Regulatory Frameworks: Varying regulations across regions concerning cable laying permits, environmental impact assessments, and data security compliance.
- Competitive Product Substitutes: Satellite communication offers an alternative, but with limitations in terms of speed, latency, and cost-effectiveness for high-bandwidth applications.
- End-User Demographics: Dominated by telecom operators (xx%), followed by cloud providers (xx%) and content delivery networks (xx%).
- M&A Trends: Approximately xx M&A deals involving submarine cable systems companies were recorded between 2019 and 2024.
Submarine Cabling Systems Market Growth Trends & Insights
The global submarine cabling systems market is experiencing robust growth, driven by the exponential rise in global data traffic and the increasing demand for high-speed, reliable internet connectivity. The market size, estimated at xx Million in 2025, is projected to reach xx Million by 2033, exhibiting a CAGR of xx% during the forecast period. This growth is fueled by several factors: the rapid expansion of 5G networks, the growing adoption of cloud computing and data centers, and the increasing reliance on subsea cables for international connectivity. Technological advancements, such as the development of higher-capacity and more resilient cables, further contribute to market expansion. Consumer behavior shifts towards increased data consumption and streaming services are driving this expansion, creating consistent demand for reliable, high-bandwidth infrastructure. Market penetration of submarine cables in underserved regions presents considerable future growth opportunities.
Dominant Regions, Countries, or Segments in Submarine Cabling Systems Market
The Asia-Pacific region is currently the dominant market for submarine cabling systems, driven by rapid economic growth, expanding digital infrastructure, and increasing demand for high-speed internet access. North America and Europe also hold significant market shares, owing to established telecom infrastructures and a high demand for reliable, international connectivity.
By Ownership Type:
- Multiple Ownership System: This segment currently holds the largest market share (xx%), driven by collaborative investments and risk-sharing among multiple stakeholders.
- Single Ownership System: This segment is projected to see significant growth (xx% CAGR), owing to the expanding investments by major technology companies in private subsea cable networks.
- Multilateral Development Banks: This segment plays a crucial role in funding large-scale submarine cable projects in developing economies.
By Type:
- Dry Plant Products: This segment dominates the market (xx%), reflecting the prevalence of onshore manufacturing and installation capabilities.
- Wet Plant Products: This segment is anticipated to witness gradual growth (xx% CAGR), driven by advancements in underwater installation technologies.
Key Drivers:
- Favorable government policies and investments in digital infrastructure in the Asia-Pacific region.
- High demand for data centers and cloud services in North America and Europe.
- Increasing cross-border data traffic.
Submarine Cabling Systems Market Product Landscape
The submarine cabling systems market offers a diverse range of products, including fiber optic cables with varying capacities and repeater technologies to enhance signal transmission over vast distances. Recent innovations focus on improving cable resilience, reducing latency, and increasing data transmission speeds. These improvements include advanced optical fiber designs and sophisticated repeater systems capable of handling ever-increasing data volumes. The unique selling propositions of these systems hinge on their reliability, capacity, and overall cost-effectiveness compared to alternative technologies.
Key Drivers, Barriers & Challenges in Submarine Cabling Systems Market
Key Drivers:
- The burgeoning demand for high-speed internet access globally.
- The rapid expansion of cloud computing and data centers.
- Increased cross-border data traffic driven by globalization and digitalization.
- Government initiatives to improve digital infrastructure in developing countries.
Key Challenges and Restraints:
- High initial investment costs associated with laying submarine cables.
- Environmental regulations and concerns related to cable laying and maintenance.
- Geopolitical risks and potential disruptions to submarine cable infrastructure.
- Competition from satellite communication technologies.
- Supply chain disruptions impacting the availability of key components. This has resulted in a xx% increase in material costs in 2024.
Emerging Opportunities in Submarine Cabling Systems Market
- Expansion into underserved markets in Africa and Latin America.
- Development of next-generation submarine cables with even higher capacities and lower latency.
- Integration of submarine cables with other communication technologies, such as satellite systems.
- Increased focus on cybersecurity measures to protect submarine cable networks from cyber threats.
Growth Accelerators in the Submarine Cabling Systems Market Industry
Strategic partnerships between telecom operators, technology companies, and governments are accelerating market growth. Significant technological advancements, such as the development of advanced optical fiber and repeater technologies, are also driving progress. Furthermore, expanding data centers and cloud computing, along with increasing investments in digital infrastructure by governments worldwide, act as major catalysts.
Key Players Shaping the Submarine Cabling Systems Market Market
- JDR Cable Systems LLC
- NTT Communications Corporation
- Nexans SA
- Google LLC
- Fujitsu Ltd
- Alcatel Submarine Networks
- SubCom LLC
- NEC Corporation
- Sumitomo Electronics Industries Ltd
- PT Communication Cable System Indonesia Tb
Notable Milestones in Submarine Cabling Systems Market Sector
- September 2023: Google LLC launched Nuvem, a transatlantic subsea cable system connecting Portugal, Bermuda, and the United States, enhancing network resilience and international route diversity.
- July 2023: Alcatel Submarine Networks (ASN), Elettra Tlc, Medusa, and Orange initiated construction of the Medusa submarine cable system, strengthening connectivity across the Mediterranean Sea.
In-Depth Submarine Cabling Systems Market Market Outlook
The future of the submarine cabling systems market appears bright, driven by sustained growth in data consumption, technological advancements, and strategic investments. The market is poised for further expansion, fueled by the increasing need for high-bandwidth, low-latency connectivity across continents. Opportunities abound for companies that can innovate, collaborate, and effectively navigate the regulatory landscape. The market's long-term potential rests on the continuous development of higher-capacity cables and robust, secure network infrastructures capable of meeting the world's burgeoning data needs.
Submarine Cabling Systems Market Segmentation
-
1. Type
- 1.1. Dry Plant Products
- 1.2. Wet Plant Products
-
2. Ownership Type
- 2.1. Multiple Ownership System
- 2.2. Single Ownership System
- 2.3. Multilateral Development Banks
Submarine Cabling Systems Market Segmentation By Geography
- 1. Trans Pacific
- 2. Trans Atlantic
- 3. US Latin America
- 4. Intra Asia
- 5. Europe Asia
- 6. Europe Sub Saharan Africa
Submarine Cabling Systems Market REPORT HIGHLIGHTS
| Aspects | Details |
|---|---|
| Study Period | 2019-2033 |
| Base Year | 2024 |
| Estimated Year | 2025 |
| Forecast Period | 2025-2033 |
| Historical Period | 2019-2024 |
| Growth Rate | CAGR of 10.20% from 2019-2033 |
| Segmentation |
|
Table of Contents
- 1. Introduction
- 1.1. Research Scope
- 1.2. Market Segmentation
- 1.3. Research Methodology
- 1.4. Definitions and Assumptions
- 2. Executive Summary
- 2.1. Introduction
- 3. Market Dynamics
- 3.1. Introduction
- 3.2. Market Drivers
- 3.2.1. Increasing Demand for Internet Bandwidth from Content Providers; Increasing Submarine Cable Connectivity in Emerging Regions; Growing Investments in Offshore Wind Farms
- 3.3. Market Restrains
- 3.3.1. Data Privacy and Localization Initiatives; Geopolitical Tensions Limiting Projects
- 3.4. Market Trends
- 3.4.1. Dry Plant Products to Drive the Market's Growth
- 4. Market Factor Analysis
- 4.1. Porters Five Forces
- 4.2. Supply/Value Chain
- 4.3. PESTEL analysis
- 4.4. Market Entropy
- 4.5. Patent/Trademark Analysis
- 5. Global Submarine Cabling Systems Market Analysis, Insights and Forecast, 2019-2031
- 5.1. Market Analysis, Insights and Forecast - by Type
- 5.1.1. Dry Plant Products
- 5.1.2. Wet Plant Products
- 5.2. Market Analysis, Insights and Forecast - by Ownership Type
- 5.2.1. Multiple Ownership System
- 5.2.2. Single Ownership System
- 5.2.3. Multilateral Development Banks
- 5.3. Market Analysis, Insights and Forecast - by Region
- 5.3.1. Trans Pacific
- 5.3.2. Trans Atlantic
- 5.3.3. US Latin America
- 5.3.4. Intra Asia
- 5.3.5. Europe Asia
- 5.3.6. Europe Sub Saharan Africa
- 5.1. Market Analysis, Insights and Forecast - by Type
- 6. Trans Pacific Submarine Cabling Systems Market Analysis, Insights and Forecast, 2019-2031
- 6.1. Market Analysis, Insights and Forecast - by Type
- 6.1.1. Dry Plant Products
- 6.1.2. Wet Plant Products
- 6.2. Market Analysis, Insights and Forecast - by Ownership Type
- 6.2.1. Multiple Ownership System
- 6.2.2. Single Ownership System
- 6.2.3. Multilateral Development Banks
- 6.1. Market Analysis, Insights and Forecast - by Type
- 7. Trans Atlantic Submarine Cabling Systems Market Analysis, Insights and Forecast, 2019-2031
- 7.1. Market Analysis, Insights and Forecast - by Type
- 7.1.1. Dry Plant Products
- 7.1.2. Wet Plant Products
- 7.2. Market Analysis, Insights and Forecast - by Ownership Type
- 7.2.1. Multiple Ownership System
- 7.2.2. Single Ownership System
- 7.2.3. Multilateral Development Banks
- 7.1. Market Analysis, Insights and Forecast - by Type
- 8. US Latin America Submarine Cabling Systems Market Analysis, Insights and Forecast, 2019-2031
- 8.1. Market Analysis, Insights and Forecast - by Type
- 8.1.1. Dry Plant Products
- 8.1.2. Wet Plant Products
- 8.2. Market Analysis, Insights and Forecast - by Ownership Type
- 8.2.1. Multiple Ownership System
- 8.2.2. Single Ownership System
- 8.2.3. Multilateral Development Banks
- 8.1. Market Analysis, Insights and Forecast - by Type
- 9. Intra Asia Submarine Cabling Systems Market Analysis, Insights and Forecast, 2019-2031
- 9.1. Market Analysis, Insights and Forecast - by Type
- 9.1.1. Dry Plant Products
- 9.1.2. Wet Plant Products
- 9.2. Market Analysis, Insights and Forecast - by Ownership Type
- 9.2.1. Multiple Ownership System
- 9.2.2. Single Ownership System
- 9.2.3. Multilateral Development Banks
- 9.1. Market Analysis, Insights and Forecast - by Type
- 10. Europe Asia Submarine Cabling Systems Market Analysis, Insights and Forecast, 2019-2031
- 10.1. Market Analysis, Insights and Forecast - by Type
- 10.1.1. Dry Plant Products
- 10.1.2. Wet Plant Products
- 10.2. Market Analysis, Insights and Forecast - by Ownership Type
- 10.2.1. Multiple Ownership System
- 10.2.2. Single Ownership System
- 10.2.3. Multilateral Development Banks
- 10.1. Market Analysis, Insights and Forecast - by Type
- 11. Europe Sub Saharan Africa Submarine Cabling Systems Market Analysis, Insights and Forecast, 2019-2031
- 11.1. Market Analysis, Insights and Forecast - by Type
- 11.1.1. Dry Plant Products
- 11.1.2. Wet Plant Products
- 11.2. Market Analysis, Insights and Forecast - by Ownership Type
- 11.2.1. Multiple Ownership System
- 11.2.2. Single Ownership System
- 11.2.3. Multilateral Development Banks
- 11.1. Market Analysis, Insights and Forecast - by Type
- 12. North America Submarine Cabling Systems Market Analysis, Insights and Forecast, 2019-2031
- 12.1. Market Analysis, Insights and Forecast - By Country/Sub-region
- 12.1.1 United States
- 12.1.2 Canada
- 12.1.3 Mexico
- 13. Europe Submarine Cabling Systems Market Analysis, Insights and Forecast, 2019-2031
- 13.1. Market Analysis, Insights and Forecast - By Country/Sub-region
- 13.1.1 Germany
- 13.1.2 United Kingdom
- 13.1.3 France
- 13.1.4 Spain
- 13.1.5 Italy
- 13.1.6 Spain
- 13.1.7 Belgium
- 13.1.8 Netherland
- 13.1.9 Nordics
- 13.1.10 Rest of Europe
- 14. Asia Pacific Submarine Cabling Systems Market Analysis, Insights and Forecast, 2019-2031
- 14.1. Market Analysis, Insights and Forecast - By Country/Sub-region
- 14.1.1 China
- 14.1.2 Japan
- 14.1.3 India
- 14.1.4 South Korea
- 14.1.5 Southeast Asia
- 14.1.6 Australia
- 14.1.7 Indonesia
- 14.1.8 Phillipes
- 14.1.9 Singapore
- 14.1.10 Thailandc
- 14.1.11 Rest of Asia Pacific
- 15. South America Submarine Cabling Systems Market Analysis, Insights and Forecast, 2019-2031
- 15.1. Market Analysis, Insights and Forecast - By Country/Sub-region
- 15.1.1 Brazil
- 15.1.2 Argentina
- 15.1.3 Peru
- 15.1.4 Chile
- 15.1.5 Colombia
- 15.1.6 Ecuador
- 15.1.7 Venezuela
- 15.1.8 Rest of South America
- 16. North America Submarine Cabling Systems Market Analysis, Insights and Forecast, 2019-2031
- 16.1. Market Analysis, Insights and Forecast - By Country/Sub-region
- 16.1.1 United States
- 16.1.2 Canada
- 16.1.3 Mexico
- 17. MEA Submarine Cabling Systems Market Analysis, Insights and Forecast, 2019-2031
- 17.1. Market Analysis, Insights and Forecast - By Country/Sub-region
- 17.1.1 United Arab Emirates
- 17.1.2 Saudi Arabia
- 17.1.3 South Africa
- 17.1.4 Rest of Middle East and Africa
- 18. Competitive Analysis
- 18.1. Global Market Share Analysis 2024
- 18.2. Company Profiles
- 18.2.1 JDR Cable Systems LLC
- 18.2.1.1. Overview
- 18.2.1.2. Products
- 18.2.1.3. SWOT Analysis
- 18.2.1.4. Recent Developments
- 18.2.1.5. Financials (Based on Availability)
- 18.2.2 NTT Communications Corporation
- 18.2.2.1. Overview
- 18.2.2.2. Products
- 18.2.2.3. SWOT Analysis
- 18.2.2.4. Recent Developments
- 18.2.2.5. Financials (Based on Availability)
- 18.2.3 Nexans SA
- 18.2.3.1. Overview
- 18.2.3.2. Products
- 18.2.3.3. SWOT Analysis
- 18.2.3.4. Recent Developments
- 18.2.3.5. Financials (Based on Availability)
- 18.2.4 Google LLC
- 18.2.4.1. Overview
- 18.2.4.2. Products
- 18.2.4.3. SWOT Analysis
- 18.2.4.4. Recent Developments
- 18.2.4.5. Financials (Based on Availability)
- 18.2.5 Fujitsu Ltd
- 18.2.5.1. Overview
- 18.2.5.2. Products
- 18.2.5.3. SWOT Analysis
- 18.2.5.4. Recent Developments
- 18.2.5.5. Financials (Based on Availability)
- 18.2.6 Alcatel Submarine Networks
- 18.2.6.1. Overview
- 18.2.6.2. Products
- 18.2.6.3. SWOT Analysis
- 18.2.6.4. Recent Developments
- 18.2.6.5. Financials (Based on Availability)
- 18.2.7 SubCom LLC
- 18.2.7.1. Overview
- 18.2.7.2. Products
- 18.2.7.3. SWOT Analysis
- 18.2.7.4. Recent Developments
- 18.2.7.5. Financials (Based on Availability)
- 18.2.8 NEC Corporation
- 18.2.8.1. Overview
- 18.2.8.2. Products
- 18.2.8.3. SWOT Analysis
- 18.2.8.4. Recent Developments
- 18.2.8.5. Financials (Based on Availability)
- 18.2.9 Sumitomo Electronics Industries Ltd
- 18.2.9.1. Overview
- 18.2.9.2. Products
- 18.2.9.3. SWOT Analysis
- 18.2.9.4. Recent Developments
- 18.2.9.5. Financials (Based on Availability)
- 18.2.10 PT Communication Cable System Indonesia Tb
- 18.2.10.1. Overview
- 18.2.10.2. Products
- 18.2.10.3. SWOT Analysis
- 18.2.10.4. Recent Developments
- 18.2.10.5. Financials (Based on Availability)
- 18.2.1 JDR Cable Systems LLC
List of Figures
- Figure 1: Global Submarine Cabling Systems Market Revenue Breakdown (Million, %) by Region 2024 & 2032
- Figure 2: Global Submarine Cabling Systems Market Volume Breakdown (K Unit, %) by Region 2024 & 2032
- Figure 3: North America Submarine Cabling Systems Market Revenue (Million), by Country 2024 & 2032
- Figure 4: North America Submarine Cabling Systems Market Volume (K Unit), by Country 2024 & 2032
- Figure 5: North America Submarine Cabling Systems Market Revenue Share (%), by Country 2024 & 2032
- Figure 6: North America Submarine Cabling Systems Market Volume Share (%), by Country 2024 & 2032
- Figure 7: Europe Submarine Cabling Systems Market Revenue (Million), by Country 2024 & 2032
- Figure 8: Europe Submarine Cabling Systems Market Volume (K Unit), by Country 2024 & 2032
- Figure 9: Europe Submarine Cabling Systems Market Revenue Share (%), by Country 2024 & 2032
- Figure 10: Europe Submarine Cabling Systems Market Volume Share (%), by Country 2024 & 2032
- Figure 11: Asia Pacific Submarine Cabling Systems Market Revenue (Million), by Country 2024 & 2032
- Figure 12: Asia Pacific Submarine Cabling Systems Market Volume (K Unit), by Country 2024 & 2032
- Figure 13: Asia Pacific Submarine Cabling Systems Market Revenue Share (%), by Country 2024 & 2032
- Figure 14: Asia Pacific Submarine Cabling Systems Market Volume Share (%), by Country 2024 & 2032
- Figure 15: South America Submarine Cabling Systems Market Revenue (Million), by Country 2024 & 2032
- Figure 16: South America Submarine Cabling Systems Market Volume (K Unit), by Country 2024 & 2032
- Figure 17: South America Submarine Cabling Systems Market Revenue Share (%), by Country 2024 & 2032
- Figure 18: South America Submarine Cabling Systems Market Volume Share (%), by Country 2024 & 2032
- Figure 19: North America Submarine Cabling Systems Market Revenue (Million), by Country 2024 & 2032
- Figure 20: North America Submarine Cabling Systems Market Volume (K Unit), by Country 2024 & 2032
- Figure 21: North America Submarine Cabling Systems Market Revenue Share (%), by Country 2024 & 2032
- Figure 22: North America Submarine Cabling Systems Market Volume Share (%), by Country 2024 & 2032
- Figure 23: MEA Submarine Cabling Systems Market Revenue (Million), by Country 2024 & 2032
- Figure 24: MEA Submarine Cabling Systems Market Volume (K Unit), by Country 2024 & 2032
- Figure 25: MEA Submarine Cabling Systems Market Revenue Share (%), by Country 2024 & 2032
- Figure 26: MEA Submarine Cabling Systems Market Volume Share (%), by Country 2024 & 2032
- Figure 27: Trans Pacific Submarine Cabling Systems Market Revenue (Million), by Type 2024 & 2032
- Figure 28: Trans Pacific Submarine Cabling Systems Market Volume (K Unit), by Type 2024 & 2032
- Figure 29: Trans Pacific Submarine Cabling Systems Market Revenue Share (%), by Type 2024 & 2032
- Figure 30: Trans Pacific Submarine Cabling Systems Market Volume Share (%), by Type 2024 & 2032
- Figure 31: Trans Pacific Submarine Cabling Systems Market Revenue (Million), by Ownership Type 2024 & 2032
- Figure 32: Trans Pacific Submarine Cabling Systems Market Volume (K Unit), by Ownership Type 2024 & 2032
- Figure 33: Trans Pacific Submarine Cabling Systems Market Revenue Share (%), by Ownership Type 2024 & 2032
- Figure 34: Trans Pacific Submarine Cabling Systems Market Volume Share (%), by Ownership Type 2024 & 2032
- Figure 35: Trans Pacific Submarine Cabling Systems Market Revenue (Million), by Country 2024 & 2032
- Figure 36: Trans Pacific Submarine Cabling Systems Market Volume (K Unit), by Country 2024 & 2032
- Figure 37: Trans Pacific Submarine Cabling Systems Market Revenue Share (%), by Country 2024 & 2032
- Figure 38: Trans Pacific Submarine Cabling Systems Market Volume Share (%), by Country 2024 & 2032
- Figure 39: Trans Atlantic Submarine Cabling Systems Market Revenue (Million), by Type 2024 & 2032
- Figure 40: Trans Atlantic Submarine Cabling Systems Market Volume (K Unit), by Type 2024 & 2032
- Figure 41: Trans Atlantic Submarine Cabling Systems Market Revenue Share (%), by Type 2024 & 2032
- Figure 42: Trans Atlantic Submarine Cabling Systems Market Volume Share (%), by Type 2024 & 2032
- Figure 43: Trans Atlantic Submarine Cabling Systems Market Revenue (Million), by Ownership Type 2024 & 2032
- Figure 44: Trans Atlantic Submarine Cabling Systems Market Volume (K Unit), by Ownership Type 2024 & 2032
- Figure 45: Trans Atlantic Submarine Cabling Systems Market Revenue Share (%), by Ownership Type 2024 & 2032
- Figure 46: Trans Atlantic Submarine Cabling Systems Market Volume Share (%), by Ownership Type 2024 & 2032
- Figure 47: Trans Atlantic Submarine Cabling Systems Market Revenue (Million), by Country 2024 & 2032
- Figure 48: Trans Atlantic Submarine Cabling Systems Market Volume (K Unit), by Country 2024 & 2032
- Figure 49: Trans Atlantic Submarine Cabling Systems Market Revenue Share (%), by Country 2024 & 2032
- Figure 50: Trans Atlantic Submarine Cabling Systems Market Volume Share (%), by Country 2024 & 2032
- Figure 51: US Latin America Submarine Cabling Systems Market Revenue (Million), by Type 2024 & 2032
- Figure 52: US Latin America Submarine Cabling Systems Market Volume (K Unit), by Type 2024 & 2032
- Figure 53: US Latin America Submarine Cabling Systems Market Revenue Share (%), by Type 2024 & 2032
- Figure 54: US Latin America Submarine Cabling Systems Market Volume Share (%), by Type 2024 & 2032
- Figure 55: US Latin America Submarine Cabling Systems Market Revenue (Million), by Ownership Type 2024 & 2032
- Figure 56: US Latin America Submarine Cabling Systems Market Volume (K Unit), by Ownership Type 2024 & 2032
- Figure 57: US Latin America Submarine Cabling Systems Market Revenue Share (%), by Ownership Type 2024 & 2032
- Figure 58: US Latin America Submarine Cabling Systems Market Volume Share (%), by Ownership Type 2024 & 2032
- Figure 59: US Latin America Submarine Cabling Systems Market Revenue (Million), by Country 2024 & 2032
- Figure 60: US Latin America Submarine Cabling Systems Market Volume (K Unit), by Country 2024 & 2032
- Figure 61: US Latin America Submarine Cabling Systems Market Revenue Share (%), by Country 2024 & 2032
- Figure 62: US Latin America Submarine Cabling Systems Market Volume Share (%), by Country 2024 & 2032
- Figure 63: Intra Asia Submarine Cabling Systems Market Revenue (Million), by Type 2024 & 2032
- Figure 64: Intra Asia Submarine Cabling Systems Market Volume (K Unit), by Type 2024 & 2032
- Figure 65: Intra Asia Submarine Cabling Systems Market Revenue Share (%), by Type 2024 & 2032
- Figure 66: Intra Asia Submarine Cabling Systems Market Volume Share (%), by Type 2024 & 2032
- Figure 67: Intra Asia Submarine Cabling Systems Market Revenue (Million), by Ownership Type 2024 & 2032
- Figure 68: Intra Asia Submarine Cabling Systems Market Volume (K Unit), by Ownership Type 2024 & 2032
- Figure 69: Intra Asia Submarine Cabling Systems Market Revenue Share (%), by Ownership Type 2024 & 2032
- Figure 70: Intra Asia Submarine Cabling Systems Market Volume Share (%), by Ownership Type 2024 & 2032
- Figure 71: Intra Asia Submarine Cabling Systems Market Revenue (Million), by Country 2024 & 2032
- Figure 72: Intra Asia Submarine Cabling Systems Market Volume (K Unit), by Country 2024 & 2032
- Figure 73: Intra Asia Submarine Cabling Systems Market Revenue Share (%), by Country 2024 & 2032
- Figure 74: Intra Asia Submarine Cabling Systems Market Volume Share (%), by Country 2024 & 2032
- Figure 75: Europe Asia Submarine Cabling Systems Market Revenue (Million), by Type 2024 & 2032
- Figure 76: Europe Asia Submarine Cabling Systems Market Volume (K Unit), by Type 2024 & 2032
- Figure 77: Europe Asia Submarine Cabling Systems Market Revenue Share (%), by Type 2024 & 2032
- Figure 78: Europe Asia Submarine Cabling Systems Market Volume Share (%), by Type 2024 & 2032
- Figure 79: Europe Asia Submarine Cabling Systems Market Revenue (Million), by Ownership Type 2024 & 2032
- Figure 80: Europe Asia Submarine Cabling Systems Market Volume (K Unit), by Ownership Type 2024 & 2032
- Figure 81: Europe Asia Submarine Cabling Systems Market Revenue Share (%), by Ownership Type 2024 & 2032
- Figure 82: Europe Asia Submarine Cabling Systems Market Volume Share (%), by Ownership Type 2024 & 2032
- Figure 83: Europe Asia Submarine Cabling Systems Market Revenue (Million), by Country 2024 & 2032
- Figure 84: Europe Asia Submarine Cabling Systems Market Volume (K Unit), by Country 2024 & 2032
- Figure 85: Europe Asia Submarine Cabling Systems Market Revenue Share (%), by Country 2024 & 2032
- Figure 86: Europe Asia Submarine Cabling Systems Market Volume Share (%), by Country 2024 & 2032
- Figure 87: Europe Sub Saharan Africa Submarine Cabling Systems Market Revenue (Million), by Type 2024 & 2032
- Figure 88: Europe Sub Saharan Africa Submarine Cabling Systems Market Volume (K Unit), by Type 2024 & 2032
- Figure 89: Europe Sub Saharan Africa Submarine Cabling Systems Market Revenue Share (%), by Type 2024 & 2032
- Figure 90: Europe Sub Saharan Africa Submarine Cabling Systems Market Volume Share (%), by Type 2024 & 2032
- Figure 91: Europe Sub Saharan Africa Submarine Cabling Systems Market Revenue (Million), by Ownership Type 2024 & 2032
- Figure 92: Europe Sub Saharan Africa Submarine Cabling Systems Market Volume (K Unit), by Ownership Type 2024 & 2032
- Figure 93: Europe Sub Saharan Africa Submarine Cabling Systems Market Revenue Share (%), by Ownership Type 2024 & 2032
- Figure 94: Europe Sub Saharan Africa Submarine Cabling Systems Market Volume Share (%), by Ownership Type 2024 & 2032
- Figure 95: Europe Sub Saharan Africa Submarine Cabling Systems Market Revenue (Million), by Country 2024 & 2032
- Figure 96: Europe Sub Saharan Africa Submarine Cabling Systems Market Volume (K Unit), by Country 2024 & 2032
- Figure 97: Europe Sub Saharan Africa Submarine Cabling Systems Market Revenue Share (%), by Country 2024 & 2032
- Figure 98: Europe Sub Saharan Africa Submarine Cabling Systems Market Volume Share (%), by Country 2024 & 2032
List of Tables
- Table 1: Global Submarine Cabling Systems Market Revenue Million Forecast, by Region 2019 & 2032
- Table 2: Global Submarine Cabling Systems Market Volume K Unit Forecast, by Region 2019 & 2032
- Table 3: Global Submarine Cabling Systems Market Revenue Million Forecast, by Type 2019 & 2032
- Table 4: Global Submarine Cabling Systems Market Volume K Unit Forecast, by Type 2019 & 2032
- Table 5: Global Submarine Cabling Systems Market Revenue Million Forecast, by Ownership Type 2019 & 2032
- Table 6: Global Submarine Cabling Systems Market Volume K Unit Forecast, by Ownership Type 2019 & 2032
- Table 7: Global Submarine Cabling Systems Market Revenue Million Forecast, by Region 2019 & 2032
- Table 8: Global Submarine Cabling Systems Market Volume K Unit Forecast, by Region 2019 & 2032
- Table 9: Global Submarine Cabling Systems Market Revenue Million Forecast, by Country 2019 & 2032
- Table 10: Global Submarine Cabling Systems Market Volume K Unit Forecast, by Country 2019 & 2032
- Table 11: United States Submarine Cabling Systems Market Revenue (Million) Forecast, by Application 2019 & 2032
- Table 12: United States Submarine Cabling Systems Market Volume (K Unit) Forecast, by Application 2019 & 2032
- Table 13: Canada Submarine Cabling Systems Market Revenue (Million) Forecast, by Application 2019 & 2032
- Table 14: Canada Submarine Cabling Systems Market Volume (K Unit) Forecast, by Application 2019 & 2032
- Table 15: Mexico Submarine Cabling Systems Market Revenue (Million) Forecast, by Application 2019 & 2032
- Table 16: Mexico Submarine Cabling Systems Market Volume (K Unit) Forecast, by Application 2019 & 2032
- Table 17: Global Submarine Cabling Systems Market Revenue Million Forecast, by Country 2019 & 2032
- Table 18: Global Submarine Cabling Systems Market Volume K Unit Forecast, by Country 2019 & 2032
- Table 19: Germany Submarine Cabling Systems Market Revenue (Million) Forecast, by Application 2019 & 2032
- Table 20: Germany Submarine Cabling Systems Market Volume (K Unit) Forecast, by Application 2019 & 2032
- Table 21: United Kingdom Submarine Cabling Systems Market Revenue (Million) Forecast, by Application 2019 & 2032
- Table 22: United Kingdom Submarine Cabling Systems Market Volume (K Unit) Forecast, by Application 2019 & 2032
- Table 23: France Submarine Cabling Systems Market Revenue (Million) Forecast, by Application 2019 & 2032
- Table 24: France Submarine Cabling Systems Market Volume (K Unit) Forecast, by Application 2019 & 2032
- Table 25: Spain Submarine Cabling Systems Market Revenue (Million) Forecast, by Application 2019 & 2032
- Table 26: Spain Submarine Cabling Systems Market Volume (K Unit) Forecast, by Application 2019 & 2032
- Table 27: Italy Submarine Cabling Systems Market Revenue (Million) Forecast, by Application 2019 & 2032
- Table 28: Italy Submarine Cabling Systems Market Volume (K Unit) Forecast, by Application 2019 & 2032
- Table 29: Spain Submarine Cabling Systems Market Revenue (Million) Forecast, by Application 2019 & 2032
- Table 30: Spain Submarine Cabling Systems Market Volume (K Unit) Forecast, by Application 2019 & 2032
- Table 31: Belgium Submarine Cabling Systems Market Revenue (Million) Forecast, by Application 2019 & 2032
- Table 32: Belgium Submarine Cabling Systems Market Volume (K Unit) Forecast, by Application 2019 & 2032
- Table 33: Netherland Submarine Cabling Systems Market Revenue (Million) Forecast, by Application 2019 & 2032
- Table 34: Netherland Submarine Cabling Systems Market Volume (K Unit) Forecast, by Application 2019 & 2032
- Table 35: Nordics Submarine Cabling Systems Market Revenue (Million) Forecast, by Application 2019 & 2032
- Table 36: Nordics Submarine Cabling Systems Market Volume (K Unit) Forecast, by Application 2019 & 2032
- Table 37: Rest of Europe Submarine Cabling Systems Market Revenue (Million) Forecast, by Application 2019 & 2032
- Table 38: Rest of Europe Submarine Cabling Systems Market Volume (K Unit) Forecast, by Application 2019 & 2032
- Table 39: Global Submarine Cabling Systems Market Revenue Million Forecast, by Country 2019 & 2032
- Table 40: Global Submarine Cabling Systems Market Volume K Unit Forecast, by Country 2019 & 2032
- Table 41: China Submarine Cabling Systems Market Revenue (Million) Forecast, by Application 2019 & 2032
- Table 42: China Submarine Cabling Systems Market Volume (K Unit) Forecast, by Application 2019 & 2032
- Table 43: Japan Submarine Cabling Systems Market Revenue (Million) Forecast, by Application 2019 & 2032
- Table 44: Japan Submarine Cabling Systems Market Volume (K Unit) Forecast, by Application 2019 & 2032
- Table 45: India Submarine Cabling Systems Market Revenue (Million) Forecast, by Application 2019 & 2032
- Table 46: India Submarine Cabling Systems Market Volume (K Unit) Forecast, by Application 2019 & 2032
- Table 47: South Korea Submarine Cabling Systems Market Revenue (Million) Forecast, by Application 2019 & 2032
- Table 48: South Korea Submarine Cabling Systems Market Volume (K Unit) Forecast, by Application 2019 & 2032
- Table 49: Southeast Asia Submarine Cabling Systems Market Revenue (Million) Forecast, by Application 2019 & 2032
- Table 50: Southeast Asia Submarine Cabling Systems Market Volume (K Unit) Forecast, by Application 2019 & 2032
- Table 51: Australia Submarine Cabling Systems Market Revenue (Million) Forecast, by Application 2019 & 2032
- Table 52: Australia Submarine Cabling Systems Market Volume (K Unit) Forecast, by Application 2019 & 2032
- Table 53: Indonesia Submarine Cabling Systems Market Revenue (Million) Forecast, by Application 2019 & 2032
- Table 54: Indonesia Submarine Cabling Systems Market Volume (K Unit) Forecast, by Application 2019 & 2032
- Table 55: Phillipes Submarine Cabling Systems Market Revenue (Million) Forecast, by Application 2019 & 2032
- Table 56: Phillipes Submarine Cabling Systems Market Volume (K Unit) Forecast, by Application 2019 & 2032
- Table 57: Singapore Submarine Cabling Systems Market Revenue (Million) Forecast, by Application 2019 & 2032
- Table 58: Singapore Submarine Cabling Systems Market Volume (K Unit) Forecast, by Application 2019 & 2032
- Table 59: Thailandc Submarine Cabling Systems Market Revenue (Million) Forecast, by Application 2019 & 2032
- Table 60: Thailandc Submarine Cabling Systems Market Volume (K Unit) Forecast, by Application 2019 & 2032
- Table 61: Rest of Asia Pacific Submarine Cabling Systems Market Revenue (Million) Forecast, by Application 2019 & 2032
- Table 62: Rest of Asia Pacific Submarine Cabling Systems Market Volume (K Unit) Forecast, by Application 2019 & 2032
- Table 63: Global Submarine Cabling Systems Market Revenue Million Forecast, by Country 2019 & 2032
- Table 64: Global Submarine Cabling Systems Market Volume K Unit Forecast, by Country 2019 & 2032
- Table 65: Brazil Submarine Cabling Systems Market Revenue (Million) Forecast, by Application 2019 & 2032
- Table 66: Brazil Submarine Cabling Systems Market Volume (K Unit) Forecast, by Application 2019 & 2032
- Table 67: Argentina Submarine Cabling Systems Market Revenue (Million) Forecast, by Application 2019 & 2032
- Table 68: Argentina Submarine Cabling Systems Market Volume (K Unit) Forecast, by Application 2019 & 2032
- Table 69: Peru Submarine Cabling Systems Market Revenue (Million) Forecast, by Application 2019 & 2032
- Table 70: Peru Submarine Cabling Systems Market Volume (K Unit) Forecast, by Application 2019 & 2032
- Table 71: Chile Submarine Cabling Systems Market Revenue (Million) Forecast, by Application 2019 & 2032
- Table 72: Chile Submarine Cabling Systems Market Volume (K Unit) Forecast, by Application 2019 & 2032
- Table 73: Colombia Submarine Cabling Systems Market Revenue (Million) Forecast, by Application 2019 & 2032
- Table 74: Colombia Submarine Cabling Systems Market Volume (K Unit) Forecast, by Application 2019 & 2032
- Table 75: Ecuador Submarine Cabling Systems Market Revenue (Million) Forecast, by Application 2019 & 2032
- Table 76: Ecuador Submarine Cabling Systems Market Volume (K Unit) Forecast, by Application 2019 & 2032
- Table 77: Venezuela Submarine Cabling Systems Market Revenue (Million) Forecast, by Application 2019 & 2032
- Table 78: Venezuela Submarine Cabling Systems Market Volume (K Unit) Forecast, by Application 2019 & 2032
- Table 79: Rest of South America Submarine Cabling Systems Market Revenue (Million) Forecast, by Application 2019 & 2032
- Table 80: Rest of South America Submarine Cabling Systems Market Volume (K Unit) Forecast, by Application 2019 & 2032
- Table 81: Global Submarine Cabling Systems Market Revenue Million Forecast, by Country 2019 & 2032
- Table 82: Global Submarine Cabling Systems Market Volume K Unit Forecast, by Country 2019 & 2032
- Table 83: United States Submarine Cabling Systems Market Revenue (Million) Forecast, by Application 2019 & 2032
- Table 84: United States Submarine Cabling Systems Market Volume (K Unit) Forecast, by Application 2019 & 2032
- Table 85: Canada Submarine Cabling Systems Market Revenue (Million) Forecast, by Application 2019 & 2032
- Table 86: Canada Submarine Cabling Systems Market Volume (K Unit) Forecast, by Application 2019 & 2032
- Table 87: Mexico Submarine Cabling Systems Market Revenue (Million) Forecast, by Application 2019 & 2032
- Table 88: Mexico Submarine Cabling Systems Market Volume (K Unit) Forecast, by Application 2019 & 2032
- Table 89: Global Submarine Cabling Systems Market Revenue Million Forecast, by Country 2019 & 2032
- Table 90: Global Submarine Cabling Systems Market Volume K Unit Forecast, by Country 2019 & 2032
- Table 91: United Arab Emirates Submarine Cabling Systems Market Revenue (Million) Forecast, by Application 2019 & 2032
- Table 92: United Arab Emirates Submarine Cabling Systems Market Volume (K Unit) Forecast, by Application 2019 & 2032
- Table 93: Saudi Arabia Submarine Cabling Systems Market Revenue (Million) Forecast, by Application 2019 & 2032
- Table 94: Saudi Arabia Submarine Cabling Systems Market Volume (K Unit) Forecast, by Application 2019 & 2032
- Table 95: South Africa Submarine Cabling Systems Market Revenue (Million) Forecast, by Application 2019 & 2032
- Table 96: South Africa Submarine Cabling Systems Market Volume (K Unit) Forecast, by Application 2019 & 2032
- Table 97: Rest of Middle East and Africa Submarine Cabling Systems Market Revenue (Million) Forecast, by Application 2019 & 2032
- Table 98: Rest of Middle East and Africa Submarine Cabling Systems Market Volume (K Unit) Forecast, by Application 2019 & 2032
- Table 99: Global Submarine Cabling Systems Market Revenue Million Forecast, by Type 2019 & 2032
- Table 100: Global Submarine Cabling Systems Market Volume K Unit Forecast, by Type 2019 & 2032
- Table 101: Global Submarine Cabling Systems Market Revenue Million Forecast, by Ownership Type 2019 & 2032
- Table 102: Global Submarine Cabling Systems Market Volume K Unit Forecast, by Ownership Type 2019 & 2032
- Table 103: Global Submarine Cabling Systems Market Revenue Million Forecast, by Country 2019 & 2032
- Table 104: Global Submarine Cabling Systems Market Volume K Unit Forecast, by Country 2019 & 2032
- Table 105: Global Submarine Cabling Systems Market Revenue Million Forecast, by Type 2019 & 2032
- Table 106: Global Submarine Cabling Systems Market Volume K Unit Forecast, by Type 2019 & 2032
- Table 107: Global Submarine Cabling Systems Market Revenue Million Forecast, by Ownership Type 2019 & 2032
- Table 108: Global Submarine Cabling Systems Market Volume K Unit Forecast, by Ownership Type 2019 & 2032
- Table 109: Global Submarine Cabling Systems Market Revenue Million Forecast, by Country 2019 & 2032
- Table 110: Global Submarine Cabling Systems Market Volume K Unit Forecast, by Country 2019 & 2032
- Table 111: Global Submarine Cabling Systems Market Revenue Million Forecast, by Type 2019 & 2032
- Table 112: Global Submarine Cabling Systems Market Volume K Unit Forecast, by Type 2019 & 2032
- Table 113: Global Submarine Cabling Systems Market Revenue Million Forecast, by Ownership Type 2019 & 2032
- Table 114: Global Submarine Cabling Systems Market Volume K Unit Forecast, by Ownership Type 2019 & 2032
- Table 115: Global Submarine Cabling Systems Market Revenue Million Forecast, by Country 2019 & 2032
- Table 116: Global Submarine Cabling Systems Market Volume K Unit Forecast, by Country 2019 & 2032
- Table 117: Global Submarine Cabling Systems Market Revenue Million Forecast, by Type 2019 & 2032
- Table 118: Global Submarine Cabling Systems Market Volume K Unit Forecast, by Type 2019 & 2032
- Table 119: Global Submarine Cabling Systems Market Revenue Million Forecast, by Ownership Type 2019 & 2032
- Table 120: Global Submarine Cabling Systems Market Volume K Unit Forecast, by Ownership Type 2019 & 2032
- Table 121: Global Submarine Cabling Systems Market Revenue Million Forecast, by Country 2019 & 2032
- Table 122: Global Submarine Cabling Systems Market Volume K Unit Forecast, by Country 2019 & 2032
- Table 123: Global Submarine Cabling Systems Market Revenue Million Forecast, by Type 2019 & 2032
- Table 124: Global Submarine Cabling Systems Market Volume K Unit Forecast, by Type 2019 & 2032
- Table 125: Global Submarine Cabling Systems Market Revenue Million Forecast, by Ownership Type 2019 & 2032
- Table 126: Global Submarine Cabling Systems Market Volume K Unit Forecast, by Ownership Type 2019 & 2032
- Table 127: Global Submarine Cabling Systems Market Revenue Million Forecast, by Country 2019 & 2032
- Table 128: Global Submarine Cabling Systems Market Volume K Unit Forecast, by Country 2019 & 2032
- Table 129: Global Submarine Cabling Systems Market Revenue Million Forecast, by Type 2019 & 2032
- Table 130: Global Submarine Cabling Systems Market Volume K Unit Forecast, by Type 2019 & 2032
- Table 131: Global Submarine Cabling Systems Market Revenue Million Forecast, by Ownership Type 2019 & 2032
- Table 132: Global Submarine Cabling Systems Market Volume K Unit Forecast, by Ownership Type 2019 & 2032
- Table 133: Global Submarine Cabling Systems Market Revenue Million Forecast, by Country 2019 & 2032
- Table 134: Global Submarine Cabling Systems Market Volume K Unit Forecast, by Country 2019 & 2032
Frequently Asked Questions
1. What is the projected Compound Annual Growth Rate (CAGR) of the Submarine Cabling Systems Market?
The projected CAGR is approximately 10.20%.
2. Which companies are prominent players in the Submarine Cabling Systems Market?
Key companies in the market include JDR Cable Systems LLC, NTT Communications Corporation, Nexans SA, Google LLC, Fujitsu Ltd, Alcatel Submarine Networks, SubCom LLC, NEC Corporation, Sumitomo Electronics Industries Ltd, PT Communication Cable System Indonesia Tb.
3. What are the main segments of the Submarine Cabling Systems Market?
The market segments include Type, Ownership Type.
4. Can you provide details about the market size?
The market size is estimated to be USD 13.5 Million as of 2022.
5. What are some drivers contributing to market growth?
Increasing Demand for Internet Bandwidth from Content Providers; Increasing Submarine Cable Connectivity in Emerging Regions; Growing Investments in Offshore Wind Farms.
6. What are the notable trends driving market growth?
Dry Plant Products to Drive the Market's Growth.
7. Are there any restraints impacting market growth?
Data Privacy and Localization Initiatives; Geopolitical Tensions Limiting Projects.
8. Can you provide examples of recent developments in the market?
September 2023: Google LLC announced the launch of Nuvem, a novel transatlantic subsea cable system designed to interconnect Portugal, Bermuda, and the United States. This initiative aims to bolster network resiliency across the Atlantic, meeting the burgeoning demand for digital services. The new cable route will introduce international route diversity, supporting the advancement of information and communications technology (ICT) infrastructure across the involved continents and countries.
9. What pricing options are available for accessing the report?
Pricing options include single-user, multi-user, and enterprise licenses priced at USD 4750, USD 5250, and USD 8750 respectively.
10. Is the market size provided in terms of value or volume?
The market size is provided in terms of value, measured in Million and volume, measured in K Unit.
11. Are there any specific market keywords associated with the report?
Yes, the market keyword associated with the report is "Submarine Cabling Systems Market," which aids in identifying and referencing the specific market segment covered.
12. How do I determine which pricing option suits my needs best?
The pricing options vary based on user requirements and access needs. Individual users may opt for single-user licenses, while businesses requiring broader access may choose multi-user or enterprise licenses for cost-effective access to the report.
13. Are there any additional resources or data provided in the Submarine Cabling Systems Market report?
While the report offers comprehensive insights, it's advisable to review the specific contents or supplementary materials provided to ascertain if additional resources or data are available.
14. How can I stay updated on further developments or reports in the Submarine Cabling Systems Market?
To stay informed about further developments, trends, and reports in the Submarine Cabling Systems Market, consider subscribing to industry newsletters, following relevant companies and organizations, or regularly checking reputable industry news sources and publications.
Methodology
Step 1 - Identification of Relevant Samples Size from Population Database


Step 2 - Approaches for Defining Global Market Size (Value, Volume* & Price*)

Note*: In applicable scenarios
Step 3 - Data Sources
Primary Research
- Web Analytics
- Survey Reports
- Research Institute
- Latest Research Reports
- Opinion Leaders
Secondary Research
- Annual Reports
- White Paper
- Latest Press Release
- Industry Association
- Paid Database
- Investor Presentations

Step 4 - Data Triangulation
Involves using different sources of information in order to increase the validity of a study
These sources are likely to be stakeholders in a program - participants, other researchers, program staff, other community members, and so on.
Then we put all data in single framework & apply various statistical tools to find out the dynamic on the market.
During the analysis stage, feedback from the stakeholder groups would be compared to determine areas of agreement as well as areas of divergence


