
Key Insights
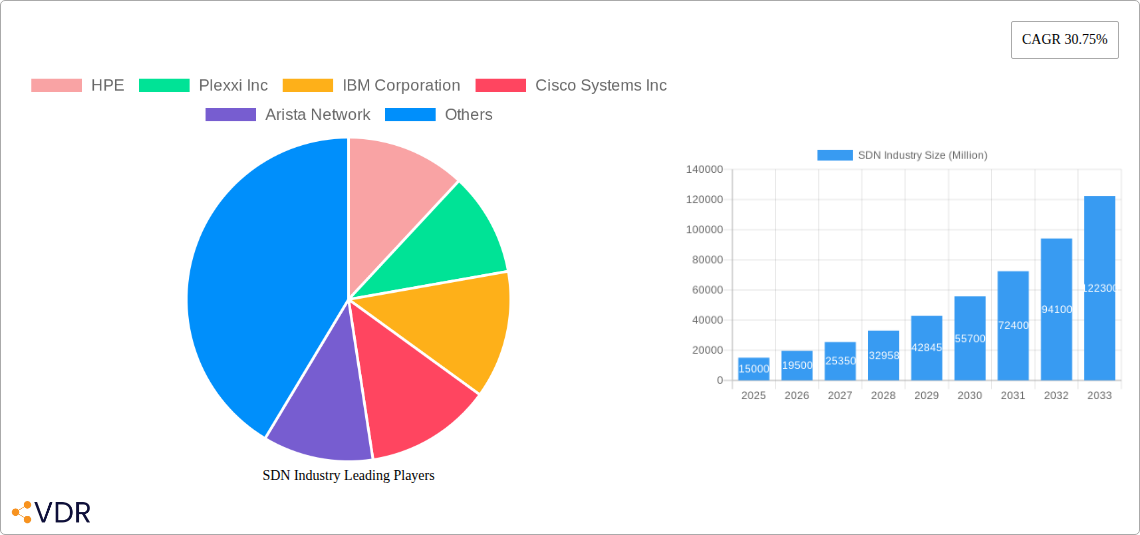
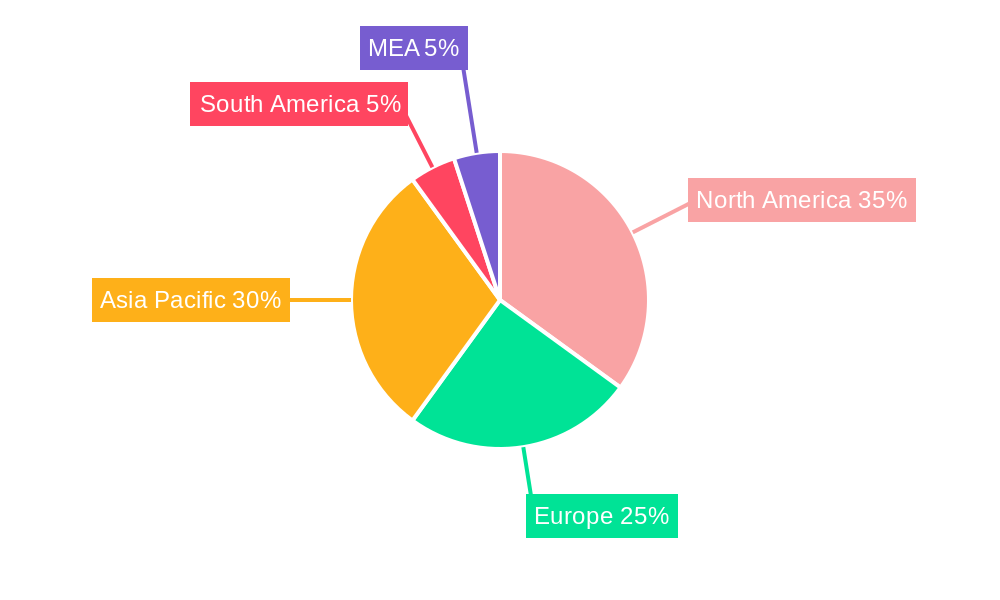
The Software-Defined Networking (SDN) market is experiencing robust growth, driven by the increasing adoption of cloud computing, virtualization, and the need for greater network agility and automation. The market's Compound Annual Growth Rate (CAGR) of 30.75% from 2019 to 2024 indicates a significant expansion, projected to continue into the forecast period (2025-2033). Key drivers include the rising demand for efficient network management in enterprises, particularly among Cloud Service Providers and Telecommunications Service Providers, seeking to optimize infrastructure costs and improve service delivery. The BFSI, Government and Defense, and Telecom & IT sectors are leading adopters, leveraging SDN to enhance security, scalability, and operational efficiency. Trends such as network function virtualization (NFV), 5G deployment, and the increasing complexity of data centers further fuel market growth. While the initial investment costs and potential integration challenges pose some restraints, the long-term benefits of improved network control, flexibility, and cost-effectiveness outweigh these concerns. The global market, segmented by end-user and industry vertical, presents diverse opportunities for established players like HPE, Cisco, and IBM, as well as emerging innovators such as Plexxi and Pluribus. Regional growth is expected to be strongest in Asia-Pacific, driven by rapid technological adoption and expanding digital infrastructure in countries like China and India, followed by North America which benefits from early adoption and large established IT sectors.
The competitive landscape is dynamic, with both established vendors and niche players vying for market share. The success of SDN deployments hinges on addressing security concerns, ensuring seamless integration with existing infrastructure, and fostering skilled workforce development. Future growth will be shaped by advancements in network programmability, Artificial Intelligence (AI) integration for network automation, and the evolving demands of edge computing. The market's expansion will likely be influenced by governmental regulations surrounding data security and network infrastructure, coupled with the ongoing consolidation and strategic partnerships within the industry. Market size estimations for future years can be extrapolated using the provided CAGR and considering market saturation points.
This comprehensive report provides an in-depth analysis of the Software Defined Networking (SDN) industry, covering market dynamics, growth trends, regional segmentation, product landscape, key players, and future outlook. The report utilizes data from 2019-2024 (Historical Period), with a focus on 2025 (Base and Estimated Year), and forecasts extending to 2033 (Forecast Period). The SDN market is analyzed across key segments including Cloud Service Providers, Enterprises, and Telecommunications Service Providers (Parent Market), further broken down by industry verticals like BFSI, Government and Defense, and Telecom & IT (Child Market). The total market size is projected to reach xx Million by 2033.
SDN Industry Market Dynamics & Structure
The SDN market exhibits a moderately concentrated structure with key players such as Cisco Systems Inc, HPE, and IBM Corporation holding significant market share. However, the market is witnessing increased competition from emerging players and niche providers. Technological innovation, particularly in areas like network virtualization and AI-driven network management, is a major growth driver. Regulatory frameworks governing data security and network interoperability influence market adoption. The market faces competition from traditional networking solutions, but SDN's flexibility and scalability are driving its adoption. Mergers and acquisitions (M&A) activity within the sector remains moderate, with xx M&A deals recorded in the historical period, primarily driven by strategic expansion and technology acquisition.
- Market Concentration: Moderately concentrated, with top 5 players holding xx% market share in 2024.
- Technological Innovation: Key drivers include advancements in virtualization, AI/ML, and 5G network slicing.
- Regulatory Landscape: Compliance with data security and privacy regulations is crucial.
- Competitive Substitutes: Traditional networking technologies pose a competitive challenge.
- M&A Activity: xx M&A deals recorded from 2019 to 2024.
- Innovation Barriers: High initial investment costs and integration complexities.
SDN Industry Growth Trends & Insights
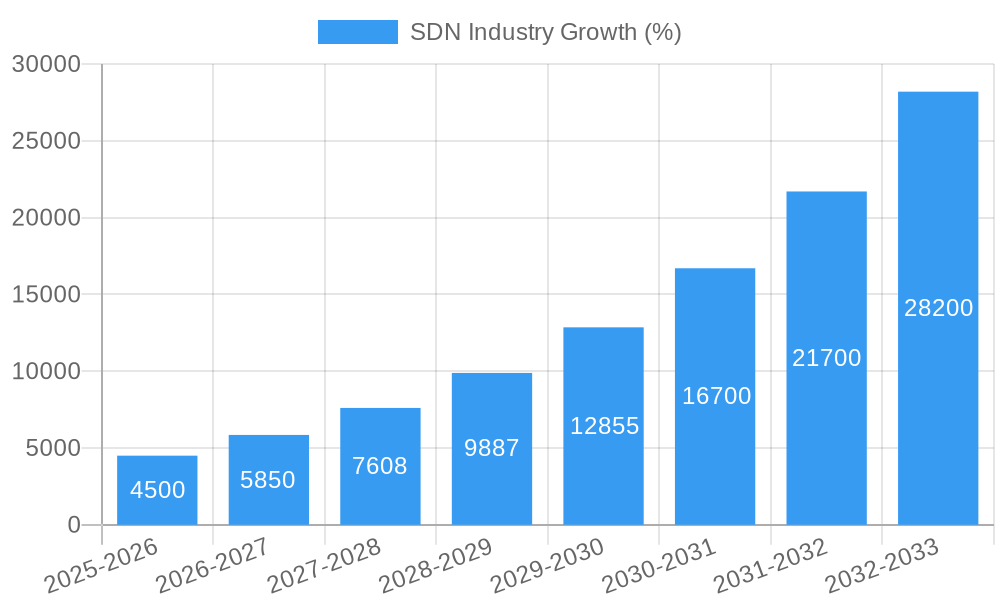
The SDN market experienced robust growth during the historical period (2019-2024), expanding at a CAGR of xx%. This growth is attributed to increasing adoption by cloud service providers, enterprises seeking greater network agility, and the rising demand for efficient network management in diverse sectors. Technological disruptions, particularly the emergence of 5G and the increasing adoption of cloud computing, have fueled market expansion. Consumer behavior shifts toward on-demand services and the need for higher bandwidth capabilities are further propelling growth. The market is projected to maintain a healthy growth trajectory, with a forecasted CAGR of xx% from 2025 to 2033. Market penetration remains relatively low, presenting significant untapped potential, particularly in developing economies.
Dominant Regions, Countries, or Segments in SDN Industry
North America currently dominates the SDN market, driven by robust technological advancements, strong adoption by enterprises and cloud providers, and supportive regulatory environments. Within North America, the United States shows significant growth potential. Europe is another key region witnessing substantial growth due to the increasing demand for high-bandwidth applications and substantial investments in digital transformation initiatives. In terms of segments, Cloud Service Providers represent the largest segment, owing to their extensive reliance on scalable and automated network infrastructures. The BFSI sector exhibits strong growth potential, driven by stringent security needs and the demand for high-availability networks.
- Key Drivers: Technological advancements, digital transformation initiatives, strong cloud adoption, supportive regulatory frameworks.
- North America: High market share, led by the US, due to early adoption and technological innovation.
- Europe: Significant growth potential, driven by increased demand for high-bandwidth applications.
- Cloud Service Providers: Largest segment, fueled by the need for scalable and efficient networking.
- BFSI: High growth potential due to increased focus on security and network reliability.
SDN Industry Product Landscape
The SDN product landscape is dynamic, encompassing SDN controllers, network virtualization platforms, and various application-specific solutions. Recent innovations focus on enhanced security features, automated network management capabilities, and improved interoperability. Products are differentiated based on scalability, performance, security features, and ease of integration with existing network infrastructure. Key technological advancements include AI-powered network analytics, improved orchestration capabilities, and support for advanced networking protocols like SRv6.
Key Drivers, Barriers & Challenges in SDN Industry
Key Drivers:
- Growing demand for network agility and automation.
- Increasing adoption of cloud computing and virtualization.
- Rising need for secure and reliable network connectivity across industries.
- Advancements in 5G and edge computing technologies.
Challenges:
- High initial investment costs and complexity in implementation.
- Security concerns related to network virtualization and centralized control.
- Interoperability challenges with existing network infrastructure.
- Skill gap in managing and maintaining SDN networks. A shortage of skilled professionals could hinder adoption rates by xx% by 2030.
Emerging Opportunities in SDN Industry
- Expansion into untapped markets in developing economies.
- Development of specialized SDN solutions for emerging technologies (e.g., IoT, AI).
- Increased focus on network security and threat mitigation.
- Growth of SDN-based services in the edge computing space.
Growth Accelerators in the SDN Industry
Technological advancements, strategic partnerships between technology vendors and service providers, and expansion into new industry verticals are key growth drivers. The ongoing development of AI-driven network automation, improved network virtualization, and increased adoption of SDN-based services in 5G networks will accelerate market growth significantly.
Key Players Shaping the SDN Industry Market
- HPE
- Plexxi Inc
- IBM Corporation
- Cisco Systems Inc
- Arista Network
- NEC Corporation
- Huawei Technologies Co Ltd
- Pluribus Network
- Big Switch Network
- AT&T Inc
- Intel Corporation
Notable Milestones in SDN Industry Sector
- January 2023: Nokia launches a new SDN controller, enhancing BICS's network capabilities and 5G network slicing.
- November 2022: Liquid Dataport launches a pan-African SDN service, enabling scalable and on-demand network solutions.
In-Depth SDN Industry Market Outlook
The SDN market is poised for sustained growth driven by continuous technological innovations and increasing enterprise adoption. Strategic partnerships and the expansion into new markets will further fuel growth. The market's future potential is substantial, offering significant opportunities for both established and emerging players. Focusing on security, scalability, and ease of integration will be crucial for success in this competitive landscape.
SDN Industry Segmentation
-
1. End User
- 1.1. Cloud Service Providers
- 1.2. Enterprises
- 1.3. Telecommunications Service Providers
-
2. Industry Vertical
- 2.1. Academia and Research
- 2.2. BFSI
- 2.3. Consumer Goods and Retail
- 2.4. Government and Defense
- 2.5. Manufacturing
- 2.6. Telecom and IT
- 2.7. Other Industry Verticals
SDN Industry Segmentation By Geography
-
1. North America
- 1.1. United States
- 1.2. Canada
-
2. Europe
- 2.1. United Kingdom
- 2.2. Germany
- 2.3. France
- 2.4. Rest of Europe
-
3. Asia Pacific
- 3.1. China
- 3.2. Japan
- 3.3. India
- 3.4. Rest of Asia Pacific
- 4. Latin America
- 5. Middle East
SDN Industry REPORT HIGHLIGHTS
| Aspects | Details |
|---|---|
| Study Period | 2019-2033 |
| Base Year | 2024 |
| Estimated Year | 2025 |
| Forecast Period | 2025-2033 |
| Historical Period | 2019-2024 |
| Growth Rate | CAGR of 30.75% from 2019-2033 |
| Segmentation |
|
Table of Contents
- 1. Introduction
- 1.1. Research Scope
- 1.2. Market Segmentation
- 1.3. Research Methodology
- 1.4. Definitions and Assumptions
- 2. Executive Summary
- 2.1. Introduction
- 3. Market Dynamics
- 3.1. Introduction
- 3.2. Market Drivers
- 3.2.1. Rising Adoption of Cloud; Trend of BYOD devices
- 3.3. Market Restrains
- 3.3.1. Concerns related to security
- 3.4. Market Trends
- 3.4.1. BFSI Sector is Benefitting from the Studied Market
- 4. Market Factor Analysis
- 4.1. Porters Five Forces
- 4.2. Supply/Value Chain
- 4.3. PESTEL analysis
- 4.4. Market Entropy
- 4.5. Patent/Trademark Analysis
- 5. Global SDN Industry Analysis, Insights and Forecast, 2019-2031
- 5.1. Market Analysis, Insights and Forecast - by End User
- 5.1.1. Cloud Service Providers
- 5.1.2. Enterprises
- 5.1.3. Telecommunications Service Providers
- 5.2. Market Analysis, Insights and Forecast - by Industry Vertical
- 5.2.1. Academia and Research
- 5.2.2. BFSI
- 5.2.3. Consumer Goods and Retail
- 5.2.4. Government and Defense
- 5.2.5. Manufacturing
- 5.2.6. Telecom and IT
- 5.2.7. Other Industry Verticals
- 5.3. Market Analysis, Insights and Forecast - by Region
- 5.3.1. North America
- 5.3.2. Europe
- 5.3.3. Asia Pacific
- 5.3.4. Latin America
- 5.3.5. Middle East
- 5.1. Market Analysis, Insights and Forecast - by End User
- 6. North America SDN Industry Analysis, Insights and Forecast, 2019-2031
- 6.1. Market Analysis, Insights and Forecast - by End User
- 6.1.1. Cloud Service Providers
- 6.1.2. Enterprises
- 6.1.3. Telecommunications Service Providers
- 6.2. Market Analysis, Insights and Forecast - by Industry Vertical
- 6.2.1. Academia and Research
- 6.2.2. BFSI
- 6.2.3. Consumer Goods and Retail
- 6.2.4. Government and Defense
- 6.2.5. Manufacturing
- 6.2.6. Telecom and IT
- 6.2.7. Other Industry Verticals
- 6.1. Market Analysis, Insights and Forecast - by End User
- 7. Europe SDN Industry Analysis, Insights and Forecast, 2019-2031
- 7.1. Market Analysis, Insights and Forecast - by End User
- 7.1.1. Cloud Service Providers
- 7.1.2. Enterprises
- 7.1.3. Telecommunications Service Providers
- 7.2. Market Analysis, Insights and Forecast - by Industry Vertical
- 7.2.1. Academia and Research
- 7.2.2. BFSI
- 7.2.3. Consumer Goods and Retail
- 7.2.4. Government and Defense
- 7.2.5. Manufacturing
- 7.2.6. Telecom and IT
- 7.2.7. Other Industry Verticals
- 7.1. Market Analysis, Insights and Forecast - by End User
- 8. Asia Pacific SDN Industry Analysis, Insights and Forecast, 2019-2031
- 8.1. Market Analysis, Insights and Forecast - by End User
- 8.1.1. Cloud Service Providers
- 8.1.2. Enterprises
- 8.1.3. Telecommunications Service Providers
- 8.2. Market Analysis, Insights and Forecast - by Industry Vertical
- 8.2.1. Academia and Research
- 8.2.2. BFSI
- 8.2.3. Consumer Goods and Retail
- 8.2.4. Government and Defense
- 8.2.5. Manufacturing
- 8.2.6. Telecom and IT
- 8.2.7. Other Industry Verticals
- 8.1. Market Analysis, Insights and Forecast - by End User
- 9. Latin America SDN Industry Analysis, Insights and Forecast, 2019-2031
- 9.1. Market Analysis, Insights and Forecast - by End User
- 9.1.1. Cloud Service Providers
- 9.1.2. Enterprises
- 9.1.3. Telecommunications Service Providers
- 9.2. Market Analysis, Insights and Forecast - by Industry Vertical
- 9.2.1. Academia and Research
- 9.2.2. BFSI
- 9.2.3. Consumer Goods and Retail
- 9.2.4. Government and Defense
- 9.2.5. Manufacturing
- 9.2.6. Telecom and IT
- 9.2.7. Other Industry Verticals
- 9.1. Market Analysis, Insights and Forecast - by End User
- 10. Middle East SDN Industry Analysis, Insights and Forecast, 2019-2031
- 10.1. Market Analysis, Insights and Forecast - by End User
- 10.1.1. Cloud Service Providers
- 10.1.2. Enterprises
- 10.1.3. Telecommunications Service Providers
- 10.2. Market Analysis, Insights and Forecast - by Industry Vertical
- 10.2.1. Academia and Research
- 10.2.2. BFSI
- 10.2.3. Consumer Goods and Retail
- 10.2.4. Government and Defense
- 10.2.5. Manufacturing
- 10.2.6. Telecom and IT
- 10.2.7. Other Industry Verticals
- 10.1. Market Analysis, Insights and Forecast - by End User
- 11. North America SDN Industry Analysis, Insights and Forecast, 2019-2031
- 11.1. Market Analysis, Insights and Forecast - By Country/Sub-region
- 11.1.1 United States
- 11.1.2 Canada
- 11.1.3 Mexico
- 12. Europe SDN Industry Analysis, Insights and Forecast, 2019-2031
- 12.1. Market Analysis, Insights and Forecast - By Country/Sub-region
- 12.1.1 Germany
- 12.1.2 United Kingdom
- 12.1.3 France
- 12.1.4 Spain
- 12.1.5 Italy
- 12.1.6 Spain
- 12.1.7 Belgium
- 12.1.8 Netherland
- 12.1.9 Nordics
- 12.1.10 Rest of Europe
- 13. Asia Pacific SDN Industry Analysis, Insights and Forecast, 2019-2031
- 13.1. Market Analysis, Insights and Forecast - By Country/Sub-region
- 13.1.1 China
- 13.1.2 Japan
- 13.1.3 India
- 13.1.4 South Korea
- 13.1.5 Southeast Asia
- 13.1.6 Australia
- 13.1.7 Indonesia
- 13.1.8 Phillipes
- 13.1.9 Singapore
- 13.1.10 Thailandc
- 13.1.11 Rest of Asia Pacific
- 14. South America SDN Industry Analysis, Insights and Forecast, 2019-2031
- 14.1. Market Analysis, Insights and Forecast - By Country/Sub-region
- 14.1.1 Brazil
- 14.1.2 Argentina
- 14.1.3 Peru
- 14.1.4 Chile
- 14.1.5 Colombia
- 14.1.6 Ecuador
- 14.1.7 Venezuela
- 14.1.8 Rest of South America
- 15. North America SDN Industry Analysis, Insights and Forecast, 2019-2031
- 15.1. Market Analysis, Insights and Forecast - By Country/Sub-region
- 15.1.1 United States
- 15.1.2 Canada
- 15.1.3 Mexico
- 16. MEA SDN Industry Analysis, Insights and Forecast, 2019-2031
- 16.1. Market Analysis, Insights and Forecast - By Country/Sub-region
- 16.1.1 United Arab Emirates
- 16.1.2 Saudi Arabia
- 16.1.3 South Africa
- 16.1.4 Rest of Middle East and Africa
- 17. Competitive Analysis
- 17.1. Global Market Share Analysis 2024
- 17.2. Company Profiles
- 17.2.1 HPE
- 17.2.1.1. Overview
- 17.2.1.2. Products
- 17.2.1.3. SWOT Analysis
- 17.2.1.4. Recent Developments
- 17.2.1.5. Financials (Based on Availability)
- 17.2.2 Plexxi Inc
- 17.2.2.1. Overview
- 17.2.2.2. Products
- 17.2.2.3. SWOT Analysis
- 17.2.2.4. Recent Developments
- 17.2.2.5. Financials (Based on Availability)
- 17.2.3 IBM Corporation
- 17.2.3.1. Overview
- 17.2.3.2. Products
- 17.2.3.3. SWOT Analysis
- 17.2.3.4. Recent Developments
- 17.2.3.5. Financials (Based on Availability)
- 17.2.4 Cisco Systems Inc
- 17.2.4.1. Overview
- 17.2.4.2. Products
- 17.2.4.3. SWOT Analysis
- 17.2.4.4. Recent Developments
- 17.2.4.5. Financials (Based on Availability)
- 17.2.5 Arista Network
- 17.2.5.1. Overview
- 17.2.5.2. Products
- 17.2.5.3. SWOT Analysis
- 17.2.5.4. Recent Developments
- 17.2.5.5. Financials (Based on Availability)
- 17.2.6 NEC Corporation
- 17.2.6.1. Overview
- 17.2.6.2. Products
- 17.2.6.3. SWOT Analysis
- 17.2.6.4. Recent Developments
- 17.2.6.5. Financials (Based on Availability)
- 17.2.7 Huawei Technologies Co Ltd
- 17.2.7.1. Overview
- 17.2.7.2. Products
- 17.2.7.3. SWOT Analysis
- 17.2.7.4. Recent Developments
- 17.2.7.5. Financials (Based on Availability)
- 17.2.8 Pluribus Network
- 17.2.8.1. Overview
- 17.2.8.2. Products
- 17.2.8.3. SWOT Analysis
- 17.2.8.4. Recent Developments
- 17.2.8.5. Financials (Based on Availability)
- 17.2.9 Big Switch Network
- 17.2.9.1. Overview
- 17.2.9.2. Products
- 17.2.9.3. SWOT Analysis
- 17.2.9.4. Recent Developments
- 17.2.9.5. Financials (Based on Availability)
- 17.2.10 AT&T Inc
- 17.2.10.1. Overview
- 17.2.10.2. Products
- 17.2.10.3. SWOT Analysis
- 17.2.10.4. Recent Developments
- 17.2.10.5. Financials (Based on Availability)
- 17.2.11 Intel Corporation
- 17.2.11.1. Overview
- 17.2.11.2. Products
- 17.2.11.3. SWOT Analysis
- 17.2.11.4. Recent Developments
- 17.2.11.5. Financials (Based on Availability)
- 17.2.1 HPE
List of Figures
- Figure 1: Global SDN Industry Revenue Breakdown (Million, %) by Region 2024 & 2032
- Figure 2: North America SDN Industry Revenue (Million), by Country 2024 & 2032
- Figure 3: North America SDN Industry Revenue Share (%), by Country 2024 & 2032
- Figure 4: Europe SDN Industry Revenue (Million), by Country 2024 & 2032
- Figure 5: Europe SDN Industry Revenue Share (%), by Country 2024 & 2032
- Figure 6: Asia Pacific SDN Industry Revenue (Million), by Country 2024 & 2032
- Figure 7: Asia Pacific SDN Industry Revenue Share (%), by Country 2024 & 2032
- Figure 8: South America SDN Industry Revenue (Million), by Country 2024 & 2032
- Figure 9: South America SDN Industry Revenue Share (%), by Country 2024 & 2032
- Figure 10: North America SDN Industry Revenue (Million), by Country 2024 & 2032
- Figure 11: North America SDN Industry Revenue Share (%), by Country 2024 & 2032
- Figure 12: MEA SDN Industry Revenue (Million), by Country 2024 & 2032
- Figure 13: MEA SDN Industry Revenue Share (%), by Country 2024 & 2032
- Figure 14: North America SDN Industry Revenue (Million), by End User 2024 & 2032
- Figure 15: North America SDN Industry Revenue Share (%), by End User 2024 & 2032
- Figure 16: North America SDN Industry Revenue (Million), by Industry Vertical 2024 & 2032
- Figure 17: North America SDN Industry Revenue Share (%), by Industry Vertical 2024 & 2032
- Figure 18: North America SDN Industry Revenue (Million), by Country 2024 & 2032
- Figure 19: North America SDN Industry Revenue Share (%), by Country 2024 & 2032
- Figure 20: Europe SDN Industry Revenue (Million), by End User 2024 & 2032
- Figure 21: Europe SDN Industry Revenue Share (%), by End User 2024 & 2032
- Figure 22: Europe SDN Industry Revenue (Million), by Industry Vertical 2024 & 2032
- Figure 23: Europe SDN Industry Revenue Share (%), by Industry Vertical 2024 & 2032
- Figure 24: Europe SDN Industry Revenue (Million), by Country 2024 & 2032
- Figure 25: Europe SDN Industry Revenue Share (%), by Country 2024 & 2032
- Figure 26: Asia Pacific SDN Industry Revenue (Million), by End User 2024 & 2032
- Figure 27: Asia Pacific SDN Industry Revenue Share (%), by End User 2024 & 2032
- Figure 28: Asia Pacific SDN Industry Revenue (Million), by Industry Vertical 2024 & 2032
- Figure 29: Asia Pacific SDN Industry Revenue Share (%), by Industry Vertical 2024 & 2032
- Figure 30: Asia Pacific SDN Industry Revenue (Million), by Country 2024 & 2032
- Figure 31: Asia Pacific SDN Industry Revenue Share (%), by Country 2024 & 2032
- Figure 32: Latin America SDN Industry Revenue (Million), by End User 2024 & 2032
- Figure 33: Latin America SDN Industry Revenue Share (%), by End User 2024 & 2032
- Figure 34: Latin America SDN Industry Revenue (Million), by Industry Vertical 2024 & 2032
- Figure 35: Latin America SDN Industry Revenue Share (%), by Industry Vertical 2024 & 2032
- Figure 36: Latin America SDN Industry Revenue (Million), by Country 2024 & 2032
- Figure 37: Latin America SDN Industry Revenue Share (%), by Country 2024 & 2032
- Figure 38: Middle East SDN Industry Revenue (Million), by End User 2024 & 2032
- Figure 39: Middle East SDN Industry Revenue Share (%), by End User 2024 & 2032
- Figure 40: Middle East SDN Industry Revenue (Million), by Industry Vertical 2024 & 2032
- Figure 41: Middle East SDN Industry Revenue Share (%), by Industry Vertical 2024 & 2032
- Figure 42: Middle East SDN Industry Revenue (Million), by Country 2024 & 2032
- Figure 43: Middle East SDN Industry Revenue Share (%), by Country 2024 & 2032
List of Tables
- Table 1: Global SDN Industry Revenue Million Forecast, by Region 2019 & 2032
- Table 2: Global SDN Industry Revenue Million Forecast, by End User 2019 & 2032
- Table 3: Global SDN Industry Revenue Million Forecast, by Industry Vertical 2019 & 2032
- Table 4: Global SDN Industry Revenue Million Forecast, by Region 2019 & 2032
- Table 5: Global SDN Industry Revenue Million Forecast, by Country 2019 & 2032
- Table 6: United States SDN Industry Revenue (Million) Forecast, by Application 2019 & 2032
- Table 7: Canada SDN Industry Revenue (Million) Forecast, by Application 2019 & 2032
- Table 8: Mexico SDN Industry Revenue (Million) Forecast, by Application 2019 & 2032
- Table 9: Global SDN Industry Revenue Million Forecast, by Country 2019 & 2032
- Table 10: Germany SDN Industry Revenue (Million) Forecast, by Application 2019 & 2032
- Table 11: United Kingdom SDN Industry Revenue (Million) Forecast, by Application 2019 & 2032
- Table 12: France SDN Industry Revenue (Million) Forecast, by Application 2019 & 2032
- Table 13: Spain SDN Industry Revenue (Million) Forecast, by Application 2019 & 2032
- Table 14: Italy SDN Industry Revenue (Million) Forecast, by Application 2019 & 2032
- Table 15: Spain SDN Industry Revenue (Million) Forecast, by Application 2019 & 2032
- Table 16: Belgium SDN Industry Revenue (Million) Forecast, by Application 2019 & 2032
- Table 17: Netherland SDN Industry Revenue (Million) Forecast, by Application 2019 & 2032
- Table 18: Nordics SDN Industry Revenue (Million) Forecast, by Application 2019 & 2032
- Table 19: Rest of Europe SDN Industry Revenue (Million) Forecast, by Application 2019 & 2032
- Table 20: Global SDN Industry Revenue Million Forecast, by Country 2019 & 2032
- Table 21: China SDN Industry Revenue (Million) Forecast, by Application 2019 & 2032
- Table 22: Japan SDN Industry Revenue (Million) Forecast, by Application 2019 & 2032
- Table 23: India SDN Industry Revenue (Million) Forecast, by Application 2019 & 2032
- Table 24: South Korea SDN Industry Revenue (Million) Forecast, by Application 2019 & 2032
- Table 25: Southeast Asia SDN Industry Revenue (Million) Forecast, by Application 2019 & 2032
- Table 26: Australia SDN Industry Revenue (Million) Forecast, by Application 2019 & 2032
- Table 27: Indonesia SDN Industry Revenue (Million) Forecast, by Application 2019 & 2032
- Table 28: Phillipes SDN Industry Revenue (Million) Forecast, by Application 2019 & 2032
- Table 29: Singapore SDN Industry Revenue (Million) Forecast, by Application 2019 & 2032
- Table 30: Thailandc SDN Industry Revenue (Million) Forecast, by Application 2019 & 2032
- Table 31: Rest of Asia Pacific SDN Industry Revenue (Million) Forecast, by Application 2019 & 2032
- Table 32: Global SDN Industry Revenue Million Forecast, by Country 2019 & 2032
- Table 33: Brazil SDN Industry Revenue (Million) Forecast, by Application 2019 & 2032
- Table 34: Argentina SDN Industry Revenue (Million) Forecast, by Application 2019 & 2032
- Table 35: Peru SDN Industry Revenue (Million) Forecast, by Application 2019 & 2032
- Table 36: Chile SDN Industry Revenue (Million) Forecast, by Application 2019 & 2032
- Table 37: Colombia SDN Industry Revenue (Million) Forecast, by Application 2019 & 2032
- Table 38: Ecuador SDN Industry Revenue (Million) Forecast, by Application 2019 & 2032
- Table 39: Venezuela SDN Industry Revenue (Million) Forecast, by Application 2019 & 2032
- Table 40: Rest of South America SDN Industry Revenue (Million) Forecast, by Application 2019 & 2032
- Table 41: Global SDN Industry Revenue Million Forecast, by Country 2019 & 2032
- Table 42: United States SDN Industry Revenue (Million) Forecast, by Application 2019 & 2032
- Table 43: Canada SDN Industry Revenue (Million) Forecast, by Application 2019 & 2032
- Table 44: Mexico SDN Industry Revenue (Million) Forecast, by Application 2019 & 2032
- Table 45: Global SDN Industry Revenue Million Forecast, by Country 2019 & 2032
- Table 46: United Arab Emirates SDN Industry Revenue (Million) Forecast, by Application 2019 & 2032
- Table 47: Saudi Arabia SDN Industry Revenue (Million) Forecast, by Application 2019 & 2032
- Table 48: South Africa SDN Industry Revenue (Million) Forecast, by Application 2019 & 2032
- Table 49: Rest of Middle East and Africa SDN Industry Revenue (Million) Forecast, by Application 2019 & 2032
- Table 50: Global SDN Industry Revenue Million Forecast, by End User 2019 & 2032
- Table 51: Global SDN Industry Revenue Million Forecast, by Industry Vertical 2019 & 2032
- Table 52: Global SDN Industry Revenue Million Forecast, by Country 2019 & 2032
- Table 53: United States SDN Industry Revenue (Million) Forecast, by Application 2019 & 2032
- Table 54: Canada SDN Industry Revenue (Million) Forecast, by Application 2019 & 2032
- Table 55: Global SDN Industry Revenue Million Forecast, by End User 2019 & 2032
- Table 56: Global SDN Industry Revenue Million Forecast, by Industry Vertical 2019 & 2032
- Table 57: Global SDN Industry Revenue Million Forecast, by Country 2019 & 2032
- Table 58: United Kingdom SDN Industry Revenue (Million) Forecast, by Application 2019 & 2032
- Table 59: Germany SDN Industry Revenue (Million) Forecast, by Application 2019 & 2032
- Table 60: France SDN Industry Revenue (Million) Forecast, by Application 2019 & 2032
- Table 61: Rest of Europe SDN Industry Revenue (Million) Forecast, by Application 2019 & 2032
- Table 62: Global SDN Industry Revenue Million Forecast, by End User 2019 & 2032
- Table 63: Global SDN Industry Revenue Million Forecast, by Industry Vertical 2019 & 2032
- Table 64: Global SDN Industry Revenue Million Forecast, by Country 2019 & 2032
- Table 65: China SDN Industry Revenue (Million) Forecast, by Application 2019 & 2032
- Table 66: Japan SDN Industry Revenue (Million) Forecast, by Application 2019 & 2032
- Table 67: India SDN Industry Revenue (Million) Forecast, by Application 2019 & 2032
- Table 68: Rest of Asia Pacific SDN Industry Revenue (Million) Forecast, by Application 2019 & 2032
- Table 69: Global SDN Industry Revenue Million Forecast, by End User 2019 & 2032
- Table 70: Global SDN Industry Revenue Million Forecast, by Industry Vertical 2019 & 2032
- Table 71: Global SDN Industry Revenue Million Forecast, by Country 2019 & 2032
- Table 72: Global SDN Industry Revenue Million Forecast, by End User 2019 & 2032
- Table 73: Global SDN Industry Revenue Million Forecast, by Industry Vertical 2019 & 2032
- Table 74: Global SDN Industry Revenue Million Forecast, by Country 2019 & 2032
Frequently Asked Questions
1. What is the projected Compound Annual Growth Rate (CAGR) of the SDN Industry?
The projected CAGR is approximately 30.75%.
2. Which companies are prominent players in the SDN Industry?
Key companies in the market include HPE, Plexxi Inc, IBM Corporation, Cisco Systems Inc, Arista Network, NEC Corporation, Huawei Technologies Co Ltd, Pluribus Network, Big Switch Network, AT&T Inc, Intel Corporation.
3. What are the main segments of the SDN Industry?
The market segments include End User, Industry Vertical.
4. Can you provide details about the market size?
The market size is estimated to be USD XX Million as of 2022.
5. What are some drivers contributing to market growth?
Rising Adoption of Cloud; Trend of BYOD devices.
6. What are the notable trends driving market growth?
BFSI Sector is Benefitting from the Studied Market.
7. Are there any restraints impacting market growth?
Concerns related to security.
8. Can you provide examples of recent developments in the market?
January 2023 - A new SDN (Software Defined Network) controller developed by Nokia has boosted the network of global communications platform provider BICS. The module will automate the network's traffic routing, enhancing user experience while laying the 5G network slicing framework. It will further guide intelligent bandwidth utilization across 5G networks, opening up new possibilities for meeting the growing connectivity requirements for enterprises. It will be used to schedule an activity at predefined times, such as calendaring bandwidth every month for a cloud data backup.
9. What pricing options are available for accessing the report?
Pricing options include single-user, multi-user, and enterprise licenses priced at USD 4750, USD 5250, and USD 8750 respectively.
10. Is the market size provided in terms of value or volume?
The market size is provided in terms of value, measured in Million.
11. Are there any specific market keywords associated with the report?
Yes, the market keyword associated with the report is "SDN Industry," which aids in identifying and referencing the specific market segment covered.
12. How do I determine which pricing option suits my needs best?
The pricing options vary based on user requirements and access needs. Individual users may opt for single-user licenses, while businesses requiring broader access may choose multi-user or enterprise licenses for cost-effective access to the report.
13. Are there any additional resources or data provided in the SDN Industry report?
While the report offers comprehensive insights, it's advisable to review the specific contents or supplementary materials provided to ascertain if additional resources or data are available.
14. How can I stay updated on further developments or reports in the SDN Industry?
To stay informed about further developments, trends, and reports in the SDN Industry, consider subscribing to industry newsletters, following relevant companies and organizations, or regularly checking reputable industry news sources and publications.
Methodology
Step 1 - Identification of Relevant Samples Size from Population Database


Step 2 - Approaches for Defining Global Market Size (Value, Volume* & Price*)

Note*: In applicable scenarios
Step 3 - Data Sources
Primary Research
- Web Analytics
- Survey Reports
- Research Institute
- Latest Research Reports
- Opinion Leaders
Secondary Research
- Annual Reports
- White Paper
- Latest Press Release
- Industry Association
- Paid Database
- Investor Presentations

Step 4 - Data Triangulation
Involves using different sources of information in order to increase the validity of a study
These sources are likely to be stakeholders in a program - participants, other researchers, program staff, other community members, and so on.
Then we put all data in single framework & apply various statistical tools to find out the dynamic on the market.
During the analysis stage, feedback from the stakeholder groups would be compared to determine areas of agreement as well as areas of divergence


