
Key Insights
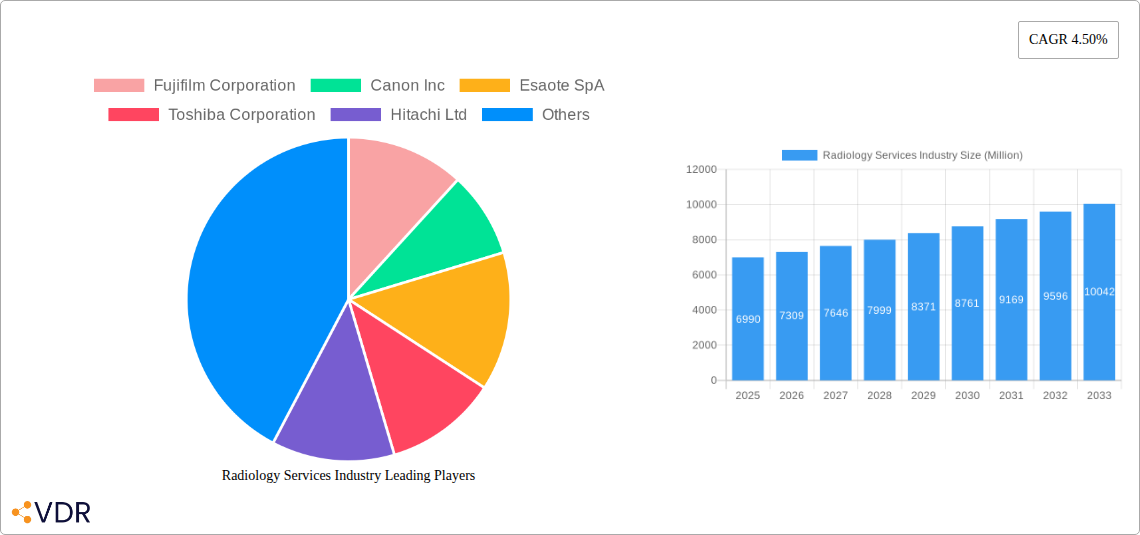
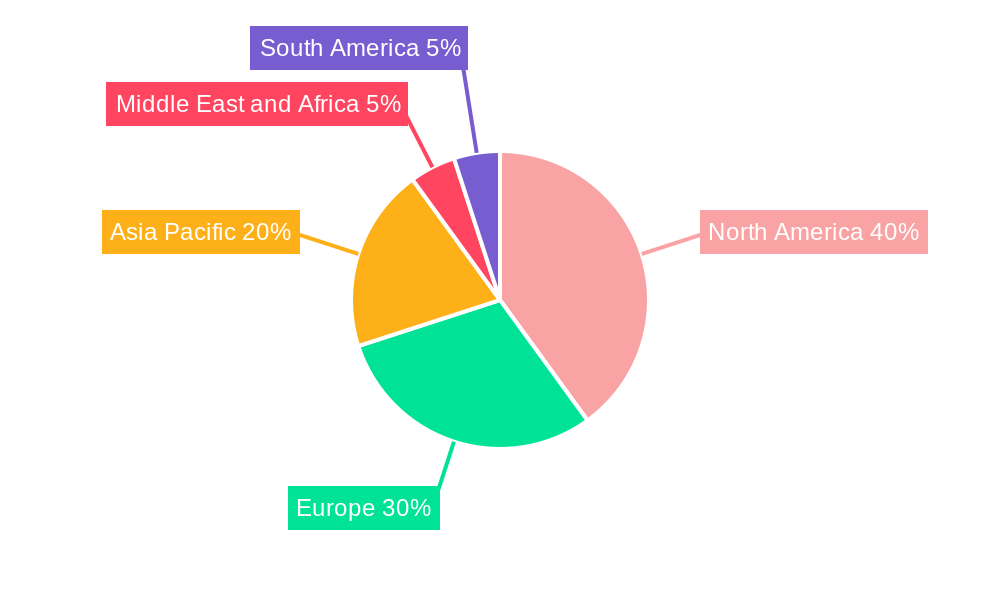
The global radiology services market, valued at $6.99 billion in 2025, is projected to experience robust growth, driven by a compound annual growth rate (CAGR) of 4.50% from 2025 to 2033. This expansion is fueled by several key factors. Technological advancements in imaging modalities, such as the development of more sophisticated ultrasound, MRI, and CT scanners with enhanced image quality and faster scan times, are significantly impacting market growth. The increasing prevalence of chronic diseases, aging populations globally demanding more diagnostic procedures, and the rising adoption of minimally invasive surgical procedures all contribute to heightened demand for radiology services. Furthermore, the expansion of healthcare infrastructure, particularly in emerging economies, is creating new opportunities for market growth. The increasing accessibility of advanced imaging technologies in these regions coupled with rising healthcare expenditure is a significant growth driver. However, high costs associated with advanced imaging equipment and procedures, coupled with stringent regulatory frameworks surrounding medical device approval and reimbursement policies, pose potential challenges to market expansion. The market is segmented by product type (ultrasound, MRI, X-ray, CT scanners, others), modality (standalone, tabletop, portable), and end-user (pediatric clinics, diagnostic centers, hospitals, others). North America currently holds a significant market share, followed by Europe and Asia Pacific, with the latter experiencing rapid growth due to increasing healthcare investments and rising awareness of preventative healthcare.
The competitive landscape is characterized by the presence of both established multinational corporations and specialized radiology service providers. Key players such as Fujifilm, Canon, Esaote, Toshiba, Hitachi, Philips, Samsung Medison, Analogic, Siemens, and General Electric are actively engaged in innovation and strategic partnerships to maintain their market positions. These companies are focusing on developing advanced imaging technologies, expanding their service portfolios, and forging strategic alliances to enhance their market reach and competitiveness. Future growth will be shaped by ongoing technological innovations, regulatory landscape changes, and evolving healthcare delivery models, including telehealth and remote diagnostics. The market is expected to witness consolidation through mergers and acquisitions as companies strive to broaden their service offerings and enhance their market share.
Radiology Services Industry Market Report: 2019-2033
This comprehensive report provides an in-depth analysis of the Radiology Services Industry, encompassing market dynamics, growth trends, regional analysis, product landscape, key players, and future outlook. The study period covers 2019-2033, with 2025 as the base and estimated year. The report segments the market by product type (Ultrasound, MRI, X-Ray, Computed Tomography Scanner, Other Product Types), modality (Standalone Devices, Table-top Devices, Portable Devices), and end-user (Pediatric Clinics, Diagnostic Centers, Hospitals, Other End-Users). Key players analyzed include Fujifilm Corporation, Canon Inc, Esaote SpA, Toshiba Corporation, Hitachi Ltd, Koninklijke Philips N V, Samsung Medison Co Ltd, Analogic Corporation, Siemens AG, and General Electric Company. The market value is presented in Million units.
Radiology Services Industry Market Dynamics & Structure
The radiology services market is characterized by a moderately consolidated structure with several major players holding significant market share. Technological innovation, particularly in AI-powered image analysis and minimally invasive procedures, is a key driver. Stringent regulatory frameworks concerning medical device approvals and data privacy influence market dynamics. The industry faces competition from substitute technologies, like advanced ultrasound techniques offering comparable diagnostic capabilities in certain applications. End-user demographics play a crucial role, with aging populations increasing demand for diagnostic services. M&A activity is moderate, with strategic acquisitions aiming to expand product portfolios and geographic reach.
- Market Concentration: Top 10 players hold approximately xx% market share in 2025.
- Technological Innovation: AI-powered image analysis is driving growth, with a xx% increase in adoption since 2020.
- Regulatory Framework: Stringent FDA and CE marking requirements impact product launches and market entry.
- M&A Activity: xx major mergers and acquisitions were recorded between 2019 and 2024.
- Innovation Barriers: High R&D costs and lengthy regulatory approval processes hinder innovation.
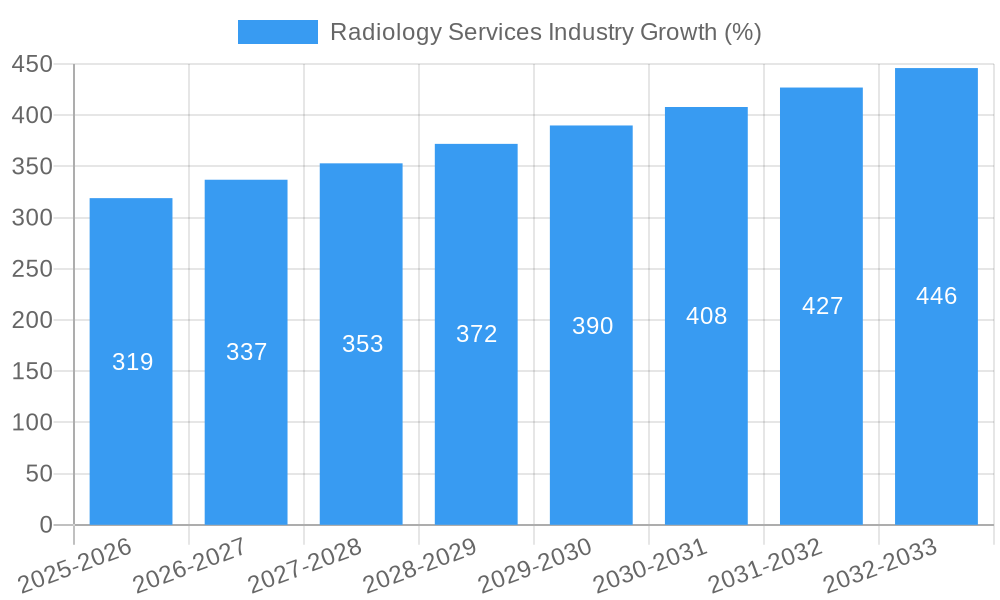
Radiology Services Industry Growth Trends & Insights
The radiology services market exhibits a robust growth trajectory, fueled by technological advancements, rising prevalence of chronic diseases, and increasing healthcare expenditure. The market size is projected to reach xx Million in 2025 and is expected to register a CAGR of xx% during the forecast period (2025-2033). Adoption rates for advanced imaging technologies, such as MRI and CT scans, are steadily increasing, driven by improved diagnostic accuracy and minimally invasive procedures. Technological disruptions, like AI-assisted diagnosis, are transforming the industry landscape, enhancing efficiency and reducing diagnostic errors. Consumer behavior is shifting towards greater transparency and patient-centric care, driving demand for improved patient experience and personalized treatments.
Dominant Regions, Countries, or Segments in Radiology Services Industry
North America currently dominates the global radiology services market, driven by high healthcare spending, advanced infrastructure, and a high prevalence of chronic diseases. Within this region, the US holds the largest market share. Hospitals are the leading end-users, accounting for approximately xx% of the market. Among product types, Computed Tomography Scanners are the highest-revenue generating segment, followed by MRI and Ultrasound systems. The portable devices segment is showing strong growth due to increased demand for point-of-care diagnostics.
- Key Drivers (North America): High healthcare expenditure, advanced medical infrastructure, high prevalence of chronic diseases.
- Key Drivers (Europe): Growing geriatric population, increasing government initiatives, rising adoption of advanced imaging techniques.
- Key Drivers (Asia Pacific): Expanding healthcare infrastructure, rising disposable incomes, growing awareness of preventive healthcare.
Radiology Services Industry Product Landscape
The radiology services market offers a diverse range of products, from conventional X-ray systems to advanced MRI and CT scanners. Recent innovations include AI-powered image analysis software, improving diagnostic accuracy and workflow efficiency. Portable and table-top devices are gaining traction due to their flexibility and convenience, particularly in remote areas and point-of-care settings. Product differentiation is driven by factors like image quality, speed, ease of use, and integration with other healthcare IT systems. Key performance indicators include image resolution, radiation dose, scan time, and overall cost-effectiveness.
Key Drivers, Barriers & Challenges in Radiology Services Industry
Key Drivers: Technological advancements (AI, minimally invasive procedures), rising prevalence of chronic diseases, increasing healthcare spending, and growing geriatric population.
Challenges: High initial investment costs for advanced equipment, stringent regulatory approvals, skilled personnel shortages, and increasing competition. The global supply chain disruptions experienced post-2020 led to a xx% increase in equipment costs in 2022.
Emerging Opportunities in Radiology Services Industry
Emerging opportunities lie in the expansion of tele radiology services, the integration of AI in diagnostic workflows, and the development of personalized radiology solutions. Untapped markets in developing economies present significant growth potential, and demand for point-of-care diagnostics is creating opportunities for portable and mobile devices. The development of advanced imaging techniques that minimize radiation exposure will fuel further market growth.
Growth Accelerators in the Radiology Services Industry
Technological breakthroughs, strategic partnerships, and market expansion into untapped regions are key growth accelerators. AI-driven image analysis, cloud-based platforms, and remote diagnostics are transforming the industry, while partnerships with healthcare providers and IT companies expand service offerings.
Key Players Shaping the Radiology Services Industry Market
- Fujifilm Corporation
- Canon Inc
- Esaote SpA
- Toshiba Corporation
- Hitachi Ltd
- Koninklijke Philips N V
- Samsung Medison Co Ltd
- Analogic Corporation
- Siemens AG
- General Electric Company
Notable Milestones in Radiology Services Industry Sector
- August 2022: Children's Hospital New Orleans and Cleveland Clinic announced a new affiliation, expanding access to pediatric radiology expertise. This highlights a trend toward specialized services and partnerships.
- February 2022: The LEGO Foundation donated 600 LEGO MRI Scanners to hospitals globally, demonstrating efforts to improve the patient experience, particularly for children.
In-Depth Radiology Services Industry Market Outlook
The radiology services market is poised for continued growth, driven by technological innovation and expanding healthcare infrastructure. Strategic partnerships, investments in AI, and expansion into emerging markets will be crucial for success. The focus on personalized medicine and improved patient experience will shape future market developments. The market presents significant opportunities for companies that can deliver innovative solutions, efficient workflows, and cost-effective services.
Radiology Services Industry Segmentation
-
1. Product Type
- 1.1. Ultrasound
- 1.2. MRI
- 1.3. X-ray
- 1.4. Computed Tomography Scanner
- 1.5. Other Product Types
-
2. Modality
- 2.1. Standalone Devices
- 2.2. Table-top Devices
- 2.3. Portable Devices
-
3. End User
- 3.1. Pediatric Clinics
- 3.2. Diagnostic Centers
- 3.3. Hospitals
- 3.4. Other End Users
Radiology Services Industry Segmentation By Geography
-
1. North America
- 1.1. United States
- 1.2. Canada
- 1.3. Mexico
-
2. Europe
- 2.1. Germany
- 2.2. United Kingdom
- 2.3. France
- 2.4. Italy
- 2.5. Spain
- 2.6. Rest of Europe
-
3. Asia Pacific
- 3.1. China
- 3.2. Japan
- 3.3. India
- 3.4. Australia
- 3.5. South Korea
- 3.6. Rest of Asia Pacific
-
4. Middle East and Africa
- 4.1. GCC
- 4.2. South Africa
- 4.3. Rest of Middle East and Africa
-
5. South America
- 5.1. Brazil
- 5.2. Argentina
- 5.3. Rest of South America
Radiology Services Industry REPORT HIGHLIGHTS
| Aspects | Details |
|---|---|
| Study Period | 2019-2033 |
| Base Year | 2024 |
| Estimated Year | 2025 |
| Forecast Period | 2025-2033 |
| Historical Period | 2019-2024 |
| Growth Rate | CAGR of 4.50% from 2019-2033 |
| Segmentation |
|
Table of Contents
- 1. Introduction
- 1.1. Research Scope
- 1.2. Market Segmentation
- 1.3. Research Methodology
- 1.4. Definitions and Assumptions
- 2. Executive Summary
- 2.1. Introduction
- 3. Market Dynamics
- 3.1. Introduction
- 3.2. Market Drivers
- 3.2.1 Increasing Burden of Pediatric Diseases
- 3.2.2 such as Coronary Heart Failures
- 3.2.3 Pneumonia
- 3.2.4 and Rise in Affordability; Increased Government Initiatives and R&D Activities to Develop Advanced Pediatric Radiology Devices
- 3.3. Market Restrains
- 3.3.1. Ethical Issues in Pediatric Research; Lack of Skilled Healthcare Professionals
- 3.4. Market Trends
- 3.4.1. Magnetic Resonance Imaging (MRI) Segment is Expected to Hold the Major Market Share in the Pediatric Radiology Market
- 4. Market Factor Analysis
- 4.1. Porters Five Forces
- 4.2. Supply/Value Chain
- 4.3. PESTEL analysis
- 4.4. Market Entropy
- 4.5. Patent/Trademark Analysis
- 5. Global Radiology Services Industry Analysis, Insights and Forecast, 2019-2031
- 5.1. Market Analysis, Insights and Forecast - by Product Type
- 5.1.1. Ultrasound
- 5.1.2. MRI
- 5.1.3. X-ray
- 5.1.4. Computed Tomography Scanner
- 5.1.5. Other Product Types
- 5.2. Market Analysis, Insights and Forecast - by Modality
- 5.2.1. Standalone Devices
- 5.2.2. Table-top Devices
- 5.2.3. Portable Devices
- 5.3. Market Analysis, Insights and Forecast - by End User
- 5.3.1. Pediatric Clinics
- 5.3.2. Diagnostic Centers
- 5.3.3. Hospitals
- 5.3.4. Other End Users
- 5.4. Market Analysis, Insights and Forecast - by Region
- 5.4.1. North America
- 5.4.2. Europe
- 5.4.3. Asia Pacific
- 5.4.4. Middle East and Africa
- 5.4.5. South America
- 5.1. Market Analysis, Insights and Forecast - by Product Type
- 6. North America Radiology Services Industry Analysis, Insights and Forecast, 2019-2031
- 6.1. Market Analysis, Insights and Forecast - by Product Type
- 6.1.1. Ultrasound
- 6.1.2. MRI
- 6.1.3. X-ray
- 6.1.4. Computed Tomography Scanner
- 6.1.5. Other Product Types
- 6.2. Market Analysis, Insights and Forecast - by Modality
- 6.2.1. Standalone Devices
- 6.2.2. Table-top Devices
- 6.2.3. Portable Devices
- 6.3. Market Analysis, Insights and Forecast - by End User
- 6.3.1. Pediatric Clinics
- 6.3.2. Diagnostic Centers
- 6.3.3. Hospitals
- 6.3.4. Other End Users
- 6.1. Market Analysis, Insights and Forecast - by Product Type
- 7. Europe Radiology Services Industry Analysis, Insights and Forecast, 2019-2031
- 7.1. Market Analysis, Insights and Forecast - by Product Type
- 7.1.1. Ultrasound
- 7.1.2. MRI
- 7.1.3. X-ray
- 7.1.4. Computed Tomography Scanner
- 7.1.5. Other Product Types
- 7.2. Market Analysis, Insights and Forecast - by Modality
- 7.2.1. Standalone Devices
- 7.2.2. Table-top Devices
- 7.2.3. Portable Devices
- 7.3. Market Analysis, Insights and Forecast - by End User
- 7.3.1. Pediatric Clinics
- 7.3.2. Diagnostic Centers
- 7.3.3. Hospitals
- 7.3.4. Other End Users
- 7.1. Market Analysis, Insights and Forecast - by Product Type
- 8. Asia Pacific Radiology Services Industry Analysis, Insights and Forecast, 2019-2031
- 8.1. Market Analysis, Insights and Forecast - by Product Type
- 8.1.1. Ultrasound
- 8.1.2. MRI
- 8.1.3. X-ray
- 8.1.4. Computed Tomography Scanner
- 8.1.5. Other Product Types
- 8.2. Market Analysis, Insights and Forecast - by Modality
- 8.2.1. Standalone Devices
- 8.2.2. Table-top Devices
- 8.2.3. Portable Devices
- 8.3. Market Analysis, Insights and Forecast - by End User
- 8.3.1. Pediatric Clinics
- 8.3.2. Diagnostic Centers
- 8.3.3. Hospitals
- 8.3.4. Other End Users
- 8.1. Market Analysis, Insights and Forecast - by Product Type
- 9. Middle East and Africa Radiology Services Industry Analysis, Insights and Forecast, 2019-2031
- 9.1. Market Analysis, Insights and Forecast - by Product Type
- 9.1.1. Ultrasound
- 9.1.2. MRI
- 9.1.3. X-ray
- 9.1.4. Computed Tomography Scanner
- 9.1.5. Other Product Types
- 9.2. Market Analysis, Insights and Forecast - by Modality
- 9.2.1. Standalone Devices
- 9.2.2. Table-top Devices
- 9.2.3. Portable Devices
- 9.3. Market Analysis, Insights and Forecast - by End User
- 9.3.1. Pediatric Clinics
- 9.3.2. Diagnostic Centers
- 9.3.3. Hospitals
- 9.3.4. Other End Users
- 9.1. Market Analysis, Insights and Forecast - by Product Type
- 10. South America Radiology Services Industry Analysis, Insights and Forecast, 2019-2031
- 10.1. Market Analysis, Insights and Forecast - by Product Type
- 10.1.1. Ultrasound
- 10.1.2. MRI
- 10.1.3. X-ray
- 10.1.4. Computed Tomography Scanner
- 10.1.5. Other Product Types
- 10.2. Market Analysis, Insights and Forecast - by Modality
- 10.2.1. Standalone Devices
- 10.2.2. Table-top Devices
- 10.2.3. Portable Devices
- 10.3. Market Analysis, Insights and Forecast - by End User
- 10.3.1. Pediatric Clinics
- 10.3.2. Diagnostic Centers
- 10.3.3. Hospitals
- 10.3.4. Other End Users
- 10.1. Market Analysis, Insights and Forecast - by Product Type
- 11. North America Radiology Services Industry Analysis, Insights and Forecast, 2019-2031
- 11.1. Market Analysis, Insights and Forecast - By Country/Sub-region
- 11.1.1 United States
- 11.1.2 Canada
- 11.1.3 Mexico
- 12. Europe Radiology Services Industry Analysis, Insights and Forecast, 2019-2031
- 12.1. Market Analysis, Insights and Forecast - By Country/Sub-region
- 12.1.1 Germany
- 12.1.2 United Kingdom
- 12.1.3 France
- 12.1.4 Italy
- 12.1.5 Spain
- 12.1.6 Rest of Europe
- 13. Asia Pacific Radiology Services Industry Analysis, Insights and Forecast, 2019-2031
- 13.1. Market Analysis, Insights and Forecast - By Country/Sub-region
- 13.1.1 China
- 13.1.2 Japan
- 13.1.3 India
- 13.1.4 Australia
- 13.1.5 South Korea
- 13.1.6 Rest of Asia Pacific
- 14. Middle East and Africa Radiology Services Industry Analysis, Insights and Forecast, 2019-2031
- 14.1. Market Analysis, Insights and Forecast - By Country/Sub-region
- 14.1.1 GCC
- 14.1.2 South Africa
- 14.1.3 Rest of Middle East and Africa
- 15. South America Radiology Services Industry Analysis, Insights and Forecast, 2019-2031
- 15.1. Market Analysis, Insights and Forecast - By Country/Sub-region
- 15.1.1 Brazil
- 15.1.2 Argentina
- 15.1.3 Rest of South America
- 16. Competitive Analysis
- 16.1. Global Market Share Analysis 2024
- 16.2. Company Profiles
- 16.2.1 Fujifilm Corporation
- 16.2.1.1. Overview
- 16.2.1.2. Products
- 16.2.1.3. SWOT Analysis
- 16.2.1.4. Recent Developments
- 16.2.1.5. Financials (Based on Availability)
- 16.2.2 Canon Inc
- 16.2.2.1. Overview
- 16.2.2.2. Products
- 16.2.2.3. SWOT Analysis
- 16.2.2.4. Recent Developments
- 16.2.2.5. Financials (Based on Availability)
- 16.2.3 Esaote SpA
- 16.2.3.1. Overview
- 16.2.3.2. Products
- 16.2.3.3. SWOT Analysis
- 16.2.3.4. Recent Developments
- 16.2.3.5. Financials (Based on Availability)
- 16.2.4 Toshiba Corporation
- 16.2.4.1. Overview
- 16.2.4.2. Products
- 16.2.4.3. SWOT Analysis
- 16.2.4.4. Recent Developments
- 16.2.4.5. Financials (Based on Availability)
- 16.2.5 Hitachi Ltd
- 16.2.5.1. Overview
- 16.2.5.2. Products
- 16.2.5.3. SWOT Analysis
- 16.2.5.4. Recent Developments
- 16.2.5.5. Financials (Based on Availability)
- 16.2.6 Koninklijke Philips N V
- 16.2.6.1. Overview
- 16.2.6.2. Products
- 16.2.6.3. SWOT Analysis
- 16.2.6.4. Recent Developments
- 16.2.6.5. Financials (Based on Availability)
- 16.2.7 Samsung Medison Co Ltd
- 16.2.7.1. Overview
- 16.2.7.2. Products
- 16.2.7.3. SWOT Analysis
- 16.2.7.4. Recent Developments
- 16.2.7.5. Financials (Based on Availability)
- 16.2.8 Analogic Corporation
- 16.2.8.1. Overview
- 16.2.8.2. Products
- 16.2.8.3. SWOT Analysis
- 16.2.8.4. Recent Developments
- 16.2.8.5. Financials (Based on Availability)
- 16.2.9 Siemens AG
- 16.2.9.1. Overview
- 16.2.9.2. Products
- 16.2.9.3. SWOT Analysis
- 16.2.9.4. Recent Developments
- 16.2.9.5. Financials (Based on Availability)
- 16.2.10 General Electric Company
- 16.2.10.1. Overview
- 16.2.10.2. Products
- 16.2.10.3. SWOT Analysis
- 16.2.10.4. Recent Developments
- 16.2.10.5. Financials (Based on Availability)
- 16.2.1 Fujifilm Corporation
List of Figures
- Figure 1: Global Radiology Services Industry Revenue Breakdown (Million, %) by Region 2024 & 2032
- Figure 2: North America Radiology Services Industry Revenue (Million), by Country 2024 & 2032
- Figure 3: North America Radiology Services Industry Revenue Share (%), by Country 2024 & 2032
- Figure 4: Europe Radiology Services Industry Revenue (Million), by Country 2024 & 2032
- Figure 5: Europe Radiology Services Industry Revenue Share (%), by Country 2024 & 2032
- Figure 6: Asia Pacific Radiology Services Industry Revenue (Million), by Country 2024 & 2032
- Figure 7: Asia Pacific Radiology Services Industry Revenue Share (%), by Country 2024 & 2032
- Figure 8: Middle East and Africa Radiology Services Industry Revenue (Million), by Country 2024 & 2032
- Figure 9: Middle East and Africa Radiology Services Industry Revenue Share (%), by Country 2024 & 2032
- Figure 10: South America Radiology Services Industry Revenue (Million), by Country 2024 & 2032
- Figure 11: South America Radiology Services Industry Revenue Share (%), by Country 2024 & 2032
- Figure 12: North America Radiology Services Industry Revenue (Million), by Product Type 2024 & 2032
- Figure 13: North America Radiology Services Industry Revenue Share (%), by Product Type 2024 & 2032
- Figure 14: North America Radiology Services Industry Revenue (Million), by Modality 2024 & 2032
- Figure 15: North America Radiology Services Industry Revenue Share (%), by Modality 2024 & 2032
- Figure 16: North America Radiology Services Industry Revenue (Million), by End User 2024 & 2032
- Figure 17: North America Radiology Services Industry Revenue Share (%), by End User 2024 & 2032
- Figure 18: North America Radiology Services Industry Revenue (Million), by Country 2024 & 2032
- Figure 19: North America Radiology Services Industry Revenue Share (%), by Country 2024 & 2032
- Figure 20: Europe Radiology Services Industry Revenue (Million), by Product Type 2024 & 2032
- Figure 21: Europe Radiology Services Industry Revenue Share (%), by Product Type 2024 & 2032
- Figure 22: Europe Radiology Services Industry Revenue (Million), by Modality 2024 & 2032
- Figure 23: Europe Radiology Services Industry Revenue Share (%), by Modality 2024 & 2032
- Figure 24: Europe Radiology Services Industry Revenue (Million), by End User 2024 & 2032
- Figure 25: Europe Radiology Services Industry Revenue Share (%), by End User 2024 & 2032
- Figure 26: Europe Radiology Services Industry Revenue (Million), by Country 2024 & 2032
- Figure 27: Europe Radiology Services Industry Revenue Share (%), by Country 2024 & 2032
- Figure 28: Asia Pacific Radiology Services Industry Revenue (Million), by Product Type 2024 & 2032
- Figure 29: Asia Pacific Radiology Services Industry Revenue Share (%), by Product Type 2024 & 2032
- Figure 30: Asia Pacific Radiology Services Industry Revenue (Million), by Modality 2024 & 2032
- Figure 31: Asia Pacific Radiology Services Industry Revenue Share (%), by Modality 2024 & 2032
- Figure 32: Asia Pacific Radiology Services Industry Revenue (Million), by End User 2024 & 2032
- Figure 33: Asia Pacific Radiology Services Industry Revenue Share (%), by End User 2024 & 2032
- Figure 34: Asia Pacific Radiology Services Industry Revenue (Million), by Country 2024 & 2032
- Figure 35: Asia Pacific Radiology Services Industry Revenue Share (%), by Country 2024 & 2032
- Figure 36: Middle East and Africa Radiology Services Industry Revenue (Million), by Product Type 2024 & 2032
- Figure 37: Middle East and Africa Radiology Services Industry Revenue Share (%), by Product Type 2024 & 2032
- Figure 38: Middle East and Africa Radiology Services Industry Revenue (Million), by Modality 2024 & 2032
- Figure 39: Middle East and Africa Radiology Services Industry Revenue Share (%), by Modality 2024 & 2032
- Figure 40: Middle East and Africa Radiology Services Industry Revenue (Million), by End User 2024 & 2032
- Figure 41: Middle East and Africa Radiology Services Industry Revenue Share (%), by End User 2024 & 2032
- Figure 42: Middle East and Africa Radiology Services Industry Revenue (Million), by Country 2024 & 2032
- Figure 43: Middle East and Africa Radiology Services Industry Revenue Share (%), by Country 2024 & 2032
- Figure 44: South America Radiology Services Industry Revenue (Million), by Product Type 2024 & 2032
- Figure 45: South America Radiology Services Industry Revenue Share (%), by Product Type 2024 & 2032
- Figure 46: South America Radiology Services Industry Revenue (Million), by Modality 2024 & 2032
- Figure 47: South America Radiology Services Industry Revenue Share (%), by Modality 2024 & 2032
- Figure 48: South America Radiology Services Industry Revenue (Million), by End User 2024 & 2032
- Figure 49: South America Radiology Services Industry Revenue Share (%), by End User 2024 & 2032
- Figure 50: South America Radiology Services Industry Revenue (Million), by Country 2024 & 2032
- Figure 51: South America Radiology Services Industry Revenue Share (%), by Country 2024 & 2032
List of Tables
- Table 1: Global Radiology Services Industry Revenue Million Forecast, by Region 2019 & 2032
- Table 2: Global Radiology Services Industry Revenue Million Forecast, by Product Type 2019 & 2032
- Table 3: Global Radiology Services Industry Revenue Million Forecast, by Modality 2019 & 2032
- Table 4: Global Radiology Services Industry Revenue Million Forecast, by End User 2019 & 2032
- Table 5: Global Radiology Services Industry Revenue Million Forecast, by Region 2019 & 2032
- Table 6: Global Radiology Services Industry Revenue Million Forecast, by Country 2019 & 2032
- Table 7: United States Radiology Services Industry Revenue (Million) Forecast, by Application 2019 & 2032
- Table 8: Canada Radiology Services Industry Revenue (Million) Forecast, by Application 2019 & 2032
- Table 9: Mexico Radiology Services Industry Revenue (Million) Forecast, by Application 2019 & 2032
- Table 10: Global Radiology Services Industry Revenue Million Forecast, by Country 2019 & 2032
- Table 11: Germany Radiology Services Industry Revenue (Million) Forecast, by Application 2019 & 2032
- Table 12: United Kingdom Radiology Services Industry Revenue (Million) Forecast, by Application 2019 & 2032
- Table 13: France Radiology Services Industry Revenue (Million) Forecast, by Application 2019 & 2032
- Table 14: Italy Radiology Services Industry Revenue (Million) Forecast, by Application 2019 & 2032
- Table 15: Spain Radiology Services Industry Revenue (Million) Forecast, by Application 2019 & 2032
- Table 16: Rest of Europe Radiology Services Industry Revenue (Million) Forecast, by Application 2019 & 2032
- Table 17: Global Radiology Services Industry Revenue Million Forecast, by Country 2019 & 2032
- Table 18: China Radiology Services Industry Revenue (Million) Forecast, by Application 2019 & 2032
- Table 19: Japan Radiology Services Industry Revenue (Million) Forecast, by Application 2019 & 2032
- Table 20: India Radiology Services Industry Revenue (Million) Forecast, by Application 2019 & 2032
- Table 21: Australia Radiology Services Industry Revenue (Million) Forecast, by Application 2019 & 2032
- Table 22: South Korea Radiology Services Industry Revenue (Million) Forecast, by Application 2019 & 2032
- Table 23: Rest of Asia Pacific Radiology Services Industry Revenue (Million) Forecast, by Application 2019 & 2032
- Table 24: Global Radiology Services Industry Revenue Million Forecast, by Country 2019 & 2032
- Table 25: GCC Radiology Services Industry Revenue (Million) Forecast, by Application 2019 & 2032
- Table 26: South Africa Radiology Services Industry Revenue (Million) Forecast, by Application 2019 & 2032
- Table 27: Rest of Middle East and Africa Radiology Services Industry Revenue (Million) Forecast, by Application 2019 & 2032
- Table 28: Global Radiology Services Industry Revenue Million Forecast, by Country 2019 & 2032
- Table 29: Brazil Radiology Services Industry Revenue (Million) Forecast, by Application 2019 & 2032
- Table 30: Argentina Radiology Services Industry Revenue (Million) Forecast, by Application 2019 & 2032
- Table 31: Rest of South America Radiology Services Industry Revenue (Million) Forecast, by Application 2019 & 2032
- Table 32: Global Radiology Services Industry Revenue Million Forecast, by Product Type 2019 & 2032
- Table 33: Global Radiology Services Industry Revenue Million Forecast, by Modality 2019 & 2032
- Table 34: Global Radiology Services Industry Revenue Million Forecast, by End User 2019 & 2032
- Table 35: Global Radiology Services Industry Revenue Million Forecast, by Country 2019 & 2032
- Table 36: United States Radiology Services Industry Revenue (Million) Forecast, by Application 2019 & 2032
- Table 37: Canada Radiology Services Industry Revenue (Million) Forecast, by Application 2019 & 2032
- Table 38: Mexico Radiology Services Industry Revenue (Million) Forecast, by Application 2019 & 2032
- Table 39: Global Radiology Services Industry Revenue Million Forecast, by Product Type 2019 & 2032
- Table 40: Global Radiology Services Industry Revenue Million Forecast, by Modality 2019 & 2032
- Table 41: Global Radiology Services Industry Revenue Million Forecast, by End User 2019 & 2032
- Table 42: Global Radiology Services Industry Revenue Million Forecast, by Country 2019 & 2032
- Table 43: Germany Radiology Services Industry Revenue (Million) Forecast, by Application 2019 & 2032
- Table 44: United Kingdom Radiology Services Industry Revenue (Million) Forecast, by Application 2019 & 2032
- Table 45: France Radiology Services Industry Revenue (Million) Forecast, by Application 2019 & 2032
- Table 46: Italy Radiology Services Industry Revenue (Million) Forecast, by Application 2019 & 2032
- Table 47: Spain Radiology Services Industry Revenue (Million) Forecast, by Application 2019 & 2032
- Table 48: Rest of Europe Radiology Services Industry Revenue (Million) Forecast, by Application 2019 & 2032
- Table 49: Global Radiology Services Industry Revenue Million Forecast, by Product Type 2019 & 2032
- Table 50: Global Radiology Services Industry Revenue Million Forecast, by Modality 2019 & 2032
- Table 51: Global Radiology Services Industry Revenue Million Forecast, by End User 2019 & 2032
- Table 52: Global Radiology Services Industry Revenue Million Forecast, by Country 2019 & 2032
- Table 53: China Radiology Services Industry Revenue (Million) Forecast, by Application 2019 & 2032
- Table 54: Japan Radiology Services Industry Revenue (Million) Forecast, by Application 2019 & 2032
- Table 55: India Radiology Services Industry Revenue (Million) Forecast, by Application 2019 & 2032
- Table 56: Australia Radiology Services Industry Revenue (Million) Forecast, by Application 2019 & 2032
- Table 57: South Korea Radiology Services Industry Revenue (Million) Forecast, by Application 2019 & 2032
- Table 58: Rest of Asia Pacific Radiology Services Industry Revenue (Million) Forecast, by Application 2019 & 2032
- Table 59: Global Radiology Services Industry Revenue Million Forecast, by Product Type 2019 & 2032
- Table 60: Global Radiology Services Industry Revenue Million Forecast, by Modality 2019 & 2032
- Table 61: Global Radiology Services Industry Revenue Million Forecast, by End User 2019 & 2032
- Table 62: Global Radiology Services Industry Revenue Million Forecast, by Country 2019 & 2032
- Table 63: GCC Radiology Services Industry Revenue (Million) Forecast, by Application 2019 & 2032
- Table 64: South Africa Radiology Services Industry Revenue (Million) Forecast, by Application 2019 & 2032
- Table 65: Rest of Middle East and Africa Radiology Services Industry Revenue (Million) Forecast, by Application 2019 & 2032
- Table 66: Global Radiology Services Industry Revenue Million Forecast, by Product Type 2019 & 2032
- Table 67: Global Radiology Services Industry Revenue Million Forecast, by Modality 2019 & 2032
- Table 68: Global Radiology Services Industry Revenue Million Forecast, by End User 2019 & 2032
- Table 69: Global Radiology Services Industry Revenue Million Forecast, by Country 2019 & 2032
- Table 70: Brazil Radiology Services Industry Revenue (Million) Forecast, by Application 2019 & 2032
- Table 71: Argentina Radiology Services Industry Revenue (Million) Forecast, by Application 2019 & 2032
- Table 72: Rest of South America Radiology Services Industry Revenue (Million) Forecast, by Application 2019 & 2032
Frequently Asked Questions
1. What is the projected Compound Annual Growth Rate (CAGR) of the Radiology Services Industry?
The projected CAGR is approximately 4.50%.
2. Which companies are prominent players in the Radiology Services Industry?
Key companies in the market include Fujifilm Corporation, Canon Inc, Esaote SpA, Toshiba Corporation, Hitachi Ltd, Koninklijke Philips N V, Samsung Medison Co Ltd, Analogic Corporation, Siemens AG, General Electric Company.
3. What are the main segments of the Radiology Services Industry?
The market segments include Product Type, Modality, End User.
4. Can you provide details about the market size?
The market size is estimated to be USD 6.99 Million as of 2022.
5. What are some drivers contributing to market growth?
Increasing Burden of Pediatric Diseases. such as Coronary Heart Failures. Pneumonia. and Rise in Affordability; Increased Government Initiatives and R&D Activities to Develop Advanced Pediatric Radiology Devices.
6. What are the notable trends driving market growth?
Magnetic Resonance Imaging (MRI) Segment is Expected to Hold the Major Market Share in the Pediatric Radiology Market.
7. Are there any restraints impacting market growth?
Ethical Issues in Pediatric Research; Lack of Skilled Healthcare Professionals.
8. Can you provide examples of recent developments in the market?
August 2022: Children's Hospital New Orleans and Cleveland Clinic announced a new affiliation to expand access to board-certified pediatric radiology experts for children and families in New Orleans and Louisiana.
9. What pricing options are available for accessing the report?
Pricing options include single-user, multi-user, and enterprise licenses priced at USD 4750, USD 5250, and USD 8750 respectively.
10. Is the market size provided in terms of value or volume?
The market size is provided in terms of value, measured in Million.
11. Are there any specific market keywords associated with the report?
Yes, the market keyword associated with the report is "Radiology Services Industry," which aids in identifying and referencing the specific market segment covered.
12. How do I determine which pricing option suits my needs best?
The pricing options vary based on user requirements and access needs. Individual users may opt for single-user licenses, while businesses requiring broader access may choose multi-user or enterprise licenses for cost-effective access to the report.
13. Are there any additional resources or data provided in the Radiology Services Industry report?
While the report offers comprehensive insights, it's advisable to review the specific contents or supplementary materials provided to ascertain if additional resources or data are available.
14. How can I stay updated on further developments or reports in the Radiology Services Industry?
To stay informed about further developments, trends, and reports in the Radiology Services Industry, consider subscribing to industry newsletters, following relevant companies and organizations, or regularly checking reputable industry news sources and publications.
Methodology
Step 1 - Identification of Relevant Samples Size from Population Database


Step 2 - Approaches for Defining Global Market Size (Value, Volume* & Price*)

Note*: In applicable scenarios
Step 3 - Data Sources
Primary Research
- Web Analytics
- Survey Reports
- Research Institute
- Latest Research Reports
- Opinion Leaders
Secondary Research
- Annual Reports
- White Paper
- Latest Press Release
- Industry Association
- Paid Database
- Investor Presentations

Step 4 - Data Triangulation
Involves using different sources of information in order to increase the validity of a study
These sources are likely to be stakeholders in a program - participants, other researchers, program staff, other community members, and so on.
Then we put all data in single framework & apply various statistical tools to find out the dynamic on the market.
During the analysis stage, feedback from the stakeholder groups would be compared to determine areas of agreement as well as areas of divergence


