
Key Insights
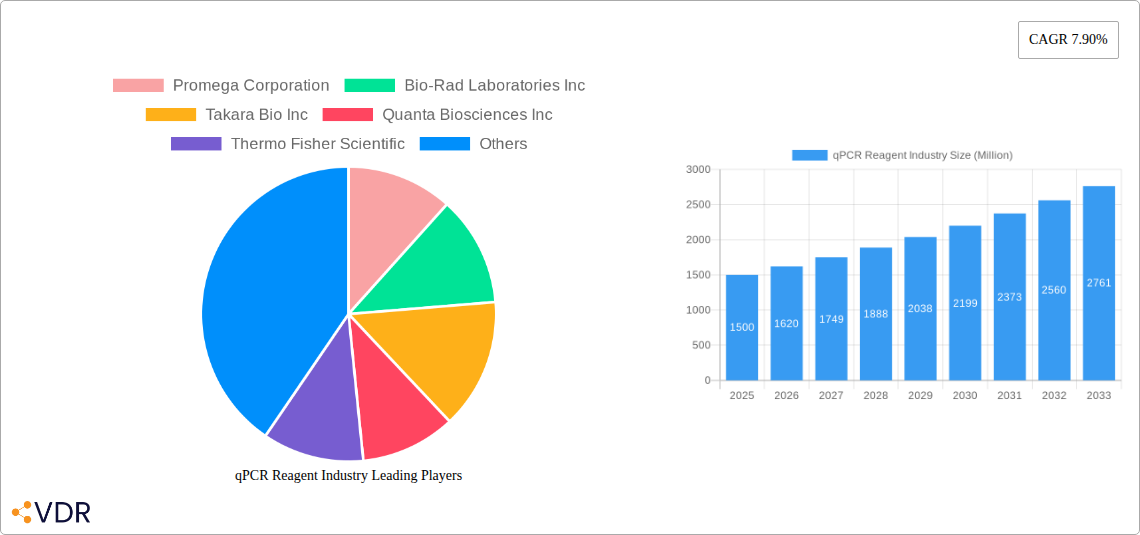
The global qPCR reagent market, valued at approximately $1.5 billion in 2025, is experiencing robust growth, projected to expand at a compound annual growth rate (CAGR) of 7.90% from 2025 to 2033. This expansion is driven primarily by the increasing prevalence of infectious diseases, the rising demand for accurate and rapid diagnostic testing, and the growing adoption of qPCR technology in research and development across various fields, including oncology, genetics, and infectious disease research. Advancements in qPCR technology, such as the development of more sensitive and specific reagents and the integration of automation, are further fueling market growth. The market is segmented by detection method (dye-based and probe-based qPCR reagents), packaging type (core kits and master mixes), and end-user (hospitals & diagnostic centers, research laboratories & academic institutes, and others). The significant investments in healthcare infrastructure, especially in emerging economies, are also contributing to the market's expansion. While the relatively high cost of qPCR reagents compared to other molecular diagnostic techniques could act as a restraint, the increasing demand for accurate results and the benefits of qPCR technology outweigh this constraint, particularly in critical applications.
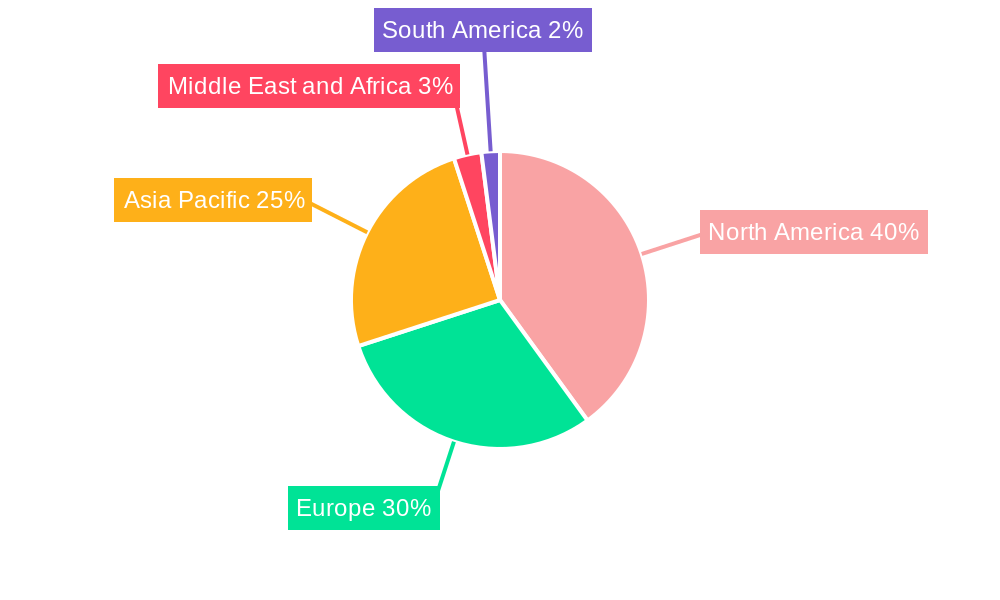
The North American region currently holds a dominant share of the global qPCR reagent market, owing to well-established healthcare infrastructure, significant research funding, and a strong presence of key players in the region. However, the Asia-Pacific region is expected to witness the fastest growth during the forecast period, driven by factors such as increasing healthcare expenditure, a burgeoning pharmaceutical industry, and growing awareness of the benefits of molecular diagnostic techniques. Europe, while showing steady growth, faces challenges related to regulatory hurdles and varying healthcare spending across different countries. Competitive landscape analysis reveals a highly consolidated market with major players such as Promega, Bio-Rad, Takara Bio, Thermo Fisher, and others competing based on product innovation, technological advancements, and global reach. The future of the qPCR reagent market appears bright, promising further expansion and diversification of products and services to meet the evolving needs of researchers and healthcare professionals.
qPCR Reagent Industry: A Comprehensive Market Report (2019-2033)
This in-depth report provides a comprehensive analysis of the qPCR Reagent market, encompassing market dynamics, growth trends, regional analysis, product landscape, key players, and future outlook. The study period covers 2019-2033, with 2025 as the base and estimated year. The report is invaluable for industry professionals, investors, and researchers seeking to understand and capitalize on opportunities within this rapidly evolving sector. The total market value is projected to reach xx Million by 2033.
qPCR Reagent Industry Market Dynamics & Structure
The qPCR reagent market is characterized by a moderately concentrated structure, with key players such as Promega Corporation, Bio-Rad Laboratories Inc, and Thermo Fisher Scientific holding significant market share. The market is driven by technological advancements, particularly in real-time PCR technology, leading to increased sensitivity, accuracy, and throughput. Stringent regulatory frameworks governing diagnostic applications impact market dynamics, while the availability of substitute technologies presents a competitive challenge. The end-user landscape comprises hospitals & diagnostic centers, research laboratories & academic institutes, and others, with research laboratories currently leading in adoption. M&A activity has been moderate, with xx deals recorded between 2019 and 2024, primarily focused on expanding product portfolios and geographic reach.
- Market Concentration: Moderately concentrated, with top 5 players holding approximately xx% market share in 2024.
- Technological Innovation: Continuous improvements in reagent performance (sensitivity, specificity), automation, and multiplex capabilities.
- Regulatory Framework: Stringent regulations in diagnostic applications, impacting product development and approval timelines.
- Competitive Substitutes: Digital PCR and other nucleic acid quantification methods offer competitive alternatives.
- M&A Activity: xx deals recorded between 2019 and 2024, primarily driven by expansion and diversification strategies.
- End-User Demographics: Research laboratories currently dominate, followed by hospitals and diagnostic centers.
qPCR Reagent Industry Growth Trends & Insights
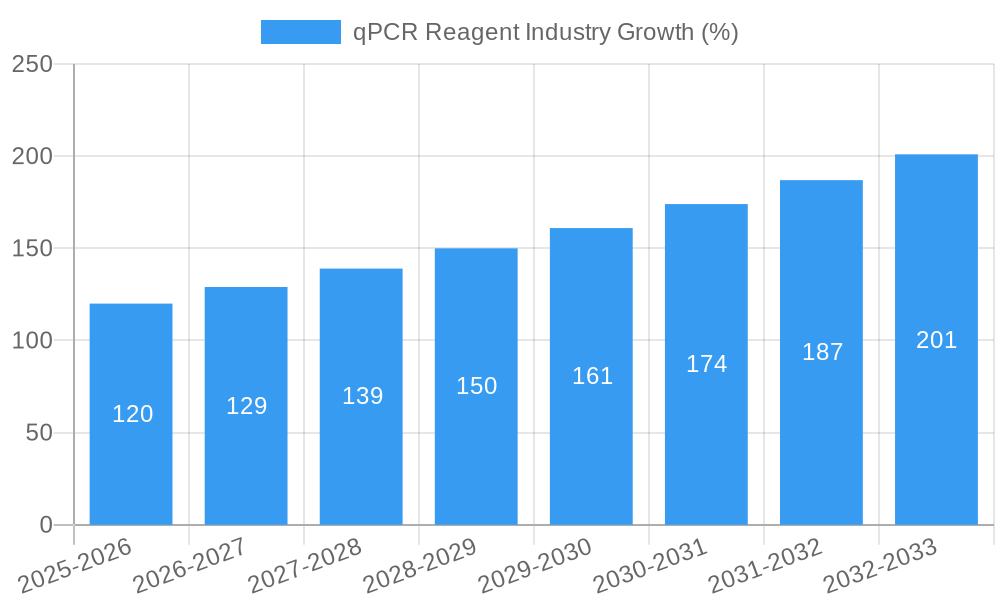
The qPCR reagent market witnessed substantial growth between 2019 and 2024, driven by increasing demand for accurate and high-throughput gene expression analysis across diverse applications. The market size expanded from xx Million in 2019 to xx Million in 2024, registering a CAGR of xx%. This growth is fueled by technological advancements leading to improved reagent performance, increased adoption in various fields (e.g., diagnostics, life sciences research), and rising investments in research and development. Market penetration in emerging economies is also contributing to overall growth. Future growth is projected to be driven by the rising adoption of multiplex qPCR assays, the expanding applications of qPCR in personalized medicine, and the continuous development of advanced qPCR technologies. Shifts in consumer behavior include a preference for higher-throughput, automated solutions and a growing demand for user-friendly reagents.
- Market Size (2019-2024): xx Million to xx Million, CAGR xx%
- Market Size (2025-2033): Projected to reach xx Million by 2033, CAGR xx%
- Market Penetration: Increased penetration in emerging markets driving growth.
- Technological Disruptions: Automation, multiplex assays, and improved reagent performance boosting adoption.
Dominant Regions, Countries, or Segments in qPCR Reagent Industry
North America currently holds the largest market share in the qPCR reagent industry, driven by high research and development spending, robust healthcare infrastructure, and the presence of major market players. Europe follows as a significant market, with strong growth potential in Asia-Pacific due to increasing healthcare investments and expanding research activities. Within the product segments, Probes and Primer-Based qPCR Reagents dominate due to their superior sensitivity and specificity compared to Dye-Based qPCR Reagents. Similarly, qPCR Mastermixes hold a larger share in packaging type due to their convenience and ease of use. Hospitals & Diagnostic Centers are the largest end-user segment, although the Research Laboratories & Academic Institutes segment is exhibiting faster growth due to a higher demand for research applications.
- Dominant Region: North America, followed by Europe.
- Fastest Growing Region: Asia-Pacific, fueled by healthcare infrastructure development and R&D investments.
- Dominant Segment (Detection Method): Probes and Primer-Based qPCR Reagents
- Dominant Segment (Packaging Type): qPCR Mastermixes
- Dominant End-User: Hospitals & Diagnostic Centers, with Research Laboratories exhibiting faster growth.
- Key Drivers: Strong R&D investments, supportive government policies, and expanding healthcare infrastructure.
qPCR Reagent Industry Product Landscape
The qPCR reagent market offers a diverse range of products, including dye-based and probe/primer-based reagents, available in various formats such as core kits and master mixes. Recent innovations focus on enhanced sensitivity, specificity, and multiplex capabilities. Products are tailored for specific applications, such as gene expression analysis, pathogen detection, and genetic testing. Unique selling propositions often involve superior performance metrics (e.g., higher sensitivity, wider dynamic range), streamlined workflows (e.g., one-step master mixes), and improved user-friendliness. Technological advancements include the development of novel enzymes, improved fluorescent probes, and innovative reagent formulations.
Key Drivers, Barriers & Challenges in qPCR Reagent Industry
Key Drivers:
The market is driven by factors such as the growing demand for accurate and high-throughput gene expression analysis, increasing investments in life sciences research, advancements in PCR technology, and the expansion of diagnostic applications in personalized medicine.
Key Barriers & Challenges:
- High cost of reagents: Limiting accessibility, especially in resource-constrained settings.
- Stringent regulatory requirements: Lengthy approval processes and compliance costs.
- Intense competition: Pressure on pricing and margins.
- Supply chain disruptions: Impacts reagent availability and cost. Estimated impact on market growth is xx%.
Emerging Opportunities in qPCR Reagent Industry
Emerging opportunities include the growing demand for multiplex qPCR assays, enabling simultaneous detection of multiple targets. Expansion into new applications, such as environmental monitoring and food safety testing, present significant untapped market potential. Development of user-friendly and affordable qPCR reagents tailored for point-of-care diagnostics is also gaining traction. The increasing focus on personalized medicine provides further growth prospects for customized qPCR assays.
Growth Accelerators in the qPCR Reagent Industry
Technological breakthroughs, particularly in enzyme engineering and probe design, are key catalysts. Strategic partnerships between reagent manufacturers and instrument providers are facilitating market penetration and driving adoption. Expanding market access in emerging economies, fueled by investments in healthcare infrastructure and research capabilities, will further accelerate market growth.
Key Players Shaping the qPCR Reagent Industry Market
- Promega Corporation
- Bio-Rad Laboratories Inc
- Takara Bio Inc
- Quanta Biosciences Inc
- Thermo Fisher Scientific
- Sigma-Aldrich Corporation (Merck KGaA)
- Agilent Technologies Inc
- F Hoffman-La Roche Ltd
- Kaneka Eurogentec S A
Notable Milestones in qPCR Reagent Industry Sector
- September 2022: Integrated DNA Technologies introduced PrimeTime qPCR One-Step Master Mix with a mutant enzyme, simplifying viral research workflows.
- November 2022: PCR Biosystems launched the Clara family of qPCR reagent mixes (Probe Mix, Probe 1-Step Mix, and HRM Mix), enhancing performance capabilities.
In-Depth qPCR Reagent Industry Market Outlook
The qPCR reagent market is poised for continued growth, driven by technological advancements, expanding applications, and increasing investments in life sciences research. Strategic partnerships and market expansion into emerging economies will further fuel market expansion. The development of innovative products addressing unmet clinical needs and the integration of qPCR into personalized medicine strategies will shape the future of this dynamic sector. The market is expected to experience a robust CAGR exceeding xx% throughout the forecast period, presenting significant opportunities for established players and new entrants alike.
qPCR Reagent Industry Segmentation
-
1. Detection Method
- 1.1. Dye-Based qPCR Reagents
- 1.2. Probes and Primer-Based qPCR Reagents
-
2. Packaging Type
- 2.1. qPCR Core Kits
- 2.2. qPCR Mastermixes
-
3. End-User
- 3.1. Hospitals & Diagnostic Centers
- 3.2. Research Laboratories & Academic Institutes
- 3.3. Others
qPCR Reagent Industry Segmentation By Geography
-
1. North America
- 1.1. United States
- 1.2. Canada
- 1.3. Mexico
-
2. Europe
- 2.1. Germany
- 2.2. United Kingdom
- 2.3. France
- 2.4. Italy
- 2.5. Spain
- 2.6. Rest of Europe
-
3. Asia Pacific
- 3.1. China
- 3.2. Japan
- 3.3. India
- 3.4. Australia
- 3.5. South Korea
- 3.6. Rest of Asia Pacific
-
4. Middle East and Africa
- 4.1. GCC
- 4.2. South Africa
- 4.3. Rest of Middle East and Africa
-
5. South America
- 5.1. Brazil
- 5.2. Argentina
- 5.3. Rest of South America
qPCR Reagent Industry REPORT HIGHLIGHTS
| Aspects | Details |
|---|---|
| Study Period | 2019-2033 |
| Base Year | 2024 |
| Estimated Year | 2025 |
| Forecast Period | 2025-2033 |
| Historical Period | 2019-2024 |
| Growth Rate | CAGR of 7.90% from 2019-2033 |
| Segmentation |
|
Table of Contents
- 1. Introduction
- 1.1. Research Scope
- 1.2. Market Segmentation
- 1.3. Research Methodology
- 1.4. Definitions and Assumptions
- 2. Executive Summary
- 2.1. Introduction
- 3. Market Dynamics
- 3.1. Introduction
- 3.2. Market Drivers
- 3.2.1. Rising Incidence of Infectious Diseases and Genetic Disorders; Growing Geriatric Population; Increasing Focus on Human Genome Projects
- 3.3. Market Restrains
- 3.3.1. High Cost of Reagents and qPCR Equipment; Lack of Technical Expertise to Operate the qPCR instrument
- 3.4. Market Trends
- 3.4.1. Dye-Based qPCR Reagents are Expected to Dominate the Market
- 4. Market Factor Analysis
- 4.1. Porters Five Forces
- 4.2. Supply/Value Chain
- 4.3. PESTEL analysis
- 4.4. Market Entropy
- 4.5. Patent/Trademark Analysis
- 5. Global qPCR Reagent Industry Analysis, Insights and Forecast, 2019-2031
- 5.1. Market Analysis, Insights and Forecast - by Detection Method
- 5.1.1. Dye-Based qPCR Reagents
- 5.1.2. Probes and Primer-Based qPCR Reagents
- 5.2. Market Analysis, Insights and Forecast - by Packaging Type
- 5.2.1. qPCR Core Kits
- 5.2.2. qPCR Mastermixes
- 5.3. Market Analysis, Insights and Forecast - by End-User
- 5.3.1. Hospitals & Diagnostic Centers
- 5.3.2. Research Laboratories & Academic Institutes
- 5.3.3. Others
- 5.4. Market Analysis, Insights and Forecast - by Region
- 5.4.1. North America
- 5.4.2. Europe
- 5.4.3. Asia Pacific
- 5.4.4. Middle East and Africa
- 5.4.5. South America
- 5.1. Market Analysis, Insights and Forecast - by Detection Method
- 6. North America qPCR Reagent Industry Analysis, Insights and Forecast, 2019-2031
- 6.1. Market Analysis, Insights and Forecast - by Detection Method
- 6.1.1. Dye-Based qPCR Reagents
- 6.1.2. Probes and Primer-Based qPCR Reagents
- 6.2. Market Analysis, Insights and Forecast - by Packaging Type
- 6.2.1. qPCR Core Kits
- 6.2.2. qPCR Mastermixes
- 6.3. Market Analysis, Insights and Forecast - by End-User
- 6.3.1. Hospitals & Diagnostic Centers
- 6.3.2. Research Laboratories & Academic Institutes
- 6.3.3. Others
- 6.1. Market Analysis, Insights and Forecast - by Detection Method
- 7. Europe qPCR Reagent Industry Analysis, Insights and Forecast, 2019-2031
- 7.1. Market Analysis, Insights and Forecast - by Detection Method
- 7.1.1. Dye-Based qPCR Reagents
- 7.1.2. Probes and Primer-Based qPCR Reagents
- 7.2. Market Analysis, Insights and Forecast - by Packaging Type
- 7.2.1. qPCR Core Kits
- 7.2.2. qPCR Mastermixes
- 7.3. Market Analysis, Insights and Forecast - by End-User
- 7.3.1. Hospitals & Diagnostic Centers
- 7.3.2. Research Laboratories & Academic Institutes
- 7.3.3. Others
- 7.1. Market Analysis, Insights and Forecast - by Detection Method
- 8. Asia Pacific qPCR Reagent Industry Analysis, Insights and Forecast, 2019-2031
- 8.1. Market Analysis, Insights and Forecast - by Detection Method
- 8.1.1. Dye-Based qPCR Reagents
- 8.1.2. Probes and Primer-Based qPCR Reagents
- 8.2. Market Analysis, Insights and Forecast - by Packaging Type
- 8.2.1. qPCR Core Kits
- 8.2.2. qPCR Mastermixes
- 8.3. Market Analysis, Insights and Forecast - by End-User
- 8.3.1. Hospitals & Diagnostic Centers
- 8.3.2. Research Laboratories & Academic Institutes
- 8.3.3. Others
- 8.1. Market Analysis, Insights and Forecast - by Detection Method
- 9. Middle East and Africa qPCR Reagent Industry Analysis, Insights and Forecast, 2019-2031
- 9.1. Market Analysis, Insights and Forecast - by Detection Method
- 9.1.1. Dye-Based qPCR Reagents
- 9.1.2. Probes and Primer-Based qPCR Reagents
- 9.2. Market Analysis, Insights and Forecast - by Packaging Type
- 9.2.1. qPCR Core Kits
- 9.2.2. qPCR Mastermixes
- 9.3. Market Analysis, Insights and Forecast - by End-User
- 9.3.1. Hospitals & Diagnostic Centers
- 9.3.2. Research Laboratories & Academic Institutes
- 9.3.3. Others
- 9.1. Market Analysis, Insights and Forecast - by Detection Method
- 10. South America qPCR Reagent Industry Analysis, Insights and Forecast, 2019-2031
- 10.1. Market Analysis, Insights and Forecast - by Detection Method
- 10.1.1. Dye-Based qPCR Reagents
- 10.1.2. Probes and Primer-Based qPCR Reagents
- 10.2. Market Analysis, Insights and Forecast - by Packaging Type
- 10.2.1. qPCR Core Kits
- 10.2.2. qPCR Mastermixes
- 10.3. Market Analysis, Insights and Forecast - by End-User
- 10.3.1. Hospitals & Diagnostic Centers
- 10.3.2. Research Laboratories & Academic Institutes
- 10.3.3. Others
- 10.1. Market Analysis, Insights and Forecast - by Detection Method
- 11. North America qPCR Reagent Industry Analysis, Insights and Forecast, 2019-2031
- 11.1. Market Analysis, Insights and Forecast - By Country/Sub-region
- 11.1.1 United States
- 11.1.2 Canada
- 11.1.3 Mexico
- 12. Europe qPCR Reagent Industry Analysis, Insights and Forecast, 2019-2031
- 12.1. Market Analysis, Insights and Forecast - By Country/Sub-region
- 12.1.1 Germany
- 12.1.2 United Kingdom
- 12.1.3 France
- 12.1.4 Italy
- 12.1.5 Spain
- 12.1.6 Rest of Europe
- 13. Asia Pacific qPCR Reagent Industry Analysis, Insights and Forecast, 2019-2031
- 13.1. Market Analysis, Insights and Forecast - By Country/Sub-region
- 13.1.1 China
- 13.1.2 Japan
- 13.1.3 India
- 13.1.4 Australia
- 13.1.5 South Korea
- 13.1.6 Rest of Asia Pacific
- 14. Middle East and Africa qPCR Reagent Industry Analysis, Insights and Forecast, 2019-2031
- 14.1. Market Analysis, Insights and Forecast - By Country/Sub-region
- 14.1.1 GCC
- 14.1.2 South Africa
- 14.1.3 Rest of Middle East and Africa
- 15. South America qPCR Reagent Industry Analysis, Insights and Forecast, 2019-2031
- 15.1. Market Analysis, Insights and Forecast - By Country/Sub-region
- 15.1.1 Brazil
- 15.1.2 Argentina
- 15.1.3 Rest of South America
- 16. Competitive Analysis
- 16.1. Global Market Share Analysis 2024
- 16.2. Company Profiles
- 16.2.1 Promega Corporation
- 16.2.1.1. Overview
- 16.2.1.2. Products
- 16.2.1.3. SWOT Analysis
- 16.2.1.4. Recent Developments
- 16.2.1.5. Financials (Based on Availability)
- 16.2.2 Bio-Rad Laboratories Inc
- 16.2.2.1. Overview
- 16.2.2.2. Products
- 16.2.2.3. SWOT Analysis
- 16.2.2.4. Recent Developments
- 16.2.2.5. Financials (Based on Availability)
- 16.2.3 Takara Bio Inc
- 16.2.3.1. Overview
- 16.2.3.2. Products
- 16.2.3.3. SWOT Analysis
- 16.2.3.4. Recent Developments
- 16.2.3.5. Financials (Based on Availability)
- 16.2.4 Quanta Biosciences Inc
- 16.2.4.1. Overview
- 16.2.4.2. Products
- 16.2.4.3. SWOT Analysis
- 16.2.4.4. Recent Developments
- 16.2.4.5. Financials (Based on Availability)
- 16.2.5 Thermo Fisher Scientific
- 16.2.5.1. Overview
- 16.2.5.2. Products
- 16.2.5.3. SWOT Analysis
- 16.2.5.4. Recent Developments
- 16.2.5.5. Financials (Based on Availability)
- 16.2.6 Sigma-Aldrich Corporation (Merck KGaA)
- 16.2.6.1. Overview
- 16.2.6.2. Products
- 16.2.6.3. SWOT Analysis
- 16.2.6.4. Recent Developments
- 16.2.6.5. Financials (Based on Availability)
- 16.2.7 Agilent Technologies Inc
- 16.2.7.1. Overview
- 16.2.7.2. Products
- 16.2.7.3. SWOT Analysis
- 16.2.7.4. Recent Developments
- 16.2.7.5. Financials (Based on Availability)
- 16.2.8 F Hoffman-La Roche Ltd
- 16.2.8.1. Overview
- 16.2.8.2. Products
- 16.2.8.3. SWOT Analysis
- 16.2.8.4. Recent Developments
- 16.2.8.5. Financials (Based on Availability)
- 16.2.9 Kaneka Eurogentec S A
- 16.2.9.1. Overview
- 16.2.9.2. Products
- 16.2.9.3. SWOT Analysis
- 16.2.9.4. Recent Developments
- 16.2.9.5. Financials (Based on Availability)
- 16.2.1 Promega Corporation
List of Figures
- Figure 1: Global qPCR Reagent Industry Revenue Breakdown (Million, %) by Region 2024 & 2032
- Figure 2: North America qPCR Reagent Industry Revenue (Million), by Country 2024 & 2032
- Figure 3: North America qPCR Reagent Industry Revenue Share (%), by Country 2024 & 2032
- Figure 4: Europe qPCR Reagent Industry Revenue (Million), by Country 2024 & 2032
- Figure 5: Europe qPCR Reagent Industry Revenue Share (%), by Country 2024 & 2032
- Figure 6: Asia Pacific qPCR Reagent Industry Revenue (Million), by Country 2024 & 2032
- Figure 7: Asia Pacific qPCR Reagent Industry Revenue Share (%), by Country 2024 & 2032
- Figure 8: Middle East and Africa qPCR Reagent Industry Revenue (Million), by Country 2024 & 2032
- Figure 9: Middle East and Africa qPCR Reagent Industry Revenue Share (%), by Country 2024 & 2032
- Figure 10: South America qPCR Reagent Industry Revenue (Million), by Country 2024 & 2032
- Figure 11: South America qPCR Reagent Industry Revenue Share (%), by Country 2024 & 2032
- Figure 12: North America qPCR Reagent Industry Revenue (Million), by Detection Method 2024 & 2032
- Figure 13: North America qPCR Reagent Industry Revenue Share (%), by Detection Method 2024 & 2032
- Figure 14: North America qPCR Reagent Industry Revenue (Million), by Packaging Type 2024 & 2032
- Figure 15: North America qPCR Reagent Industry Revenue Share (%), by Packaging Type 2024 & 2032
- Figure 16: North America qPCR Reagent Industry Revenue (Million), by End-User 2024 & 2032
- Figure 17: North America qPCR Reagent Industry Revenue Share (%), by End-User 2024 & 2032
- Figure 18: North America qPCR Reagent Industry Revenue (Million), by Country 2024 & 2032
- Figure 19: North America qPCR Reagent Industry Revenue Share (%), by Country 2024 & 2032
- Figure 20: Europe qPCR Reagent Industry Revenue (Million), by Detection Method 2024 & 2032
- Figure 21: Europe qPCR Reagent Industry Revenue Share (%), by Detection Method 2024 & 2032
- Figure 22: Europe qPCR Reagent Industry Revenue (Million), by Packaging Type 2024 & 2032
- Figure 23: Europe qPCR Reagent Industry Revenue Share (%), by Packaging Type 2024 & 2032
- Figure 24: Europe qPCR Reagent Industry Revenue (Million), by End-User 2024 & 2032
- Figure 25: Europe qPCR Reagent Industry Revenue Share (%), by End-User 2024 & 2032
- Figure 26: Europe qPCR Reagent Industry Revenue (Million), by Country 2024 & 2032
- Figure 27: Europe qPCR Reagent Industry Revenue Share (%), by Country 2024 & 2032
- Figure 28: Asia Pacific qPCR Reagent Industry Revenue (Million), by Detection Method 2024 & 2032
- Figure 29: Asia Pacific qPCR Reagent Industry Revenue Share (%), by Detection Method 2024 & 2032
- Figure 30: Asia Pacific qPCR Reagent Industry Revenue (Million), by Packaging Type 2024 & 2032
- Figure 31: Asia Pacific qPCR Reagent Industry Revenue Share (%), by Packaging Type 2024 & 2032
- Figure 32: Asia Pacific qPCR Reagent Industry Revenue (Million), by End-User 2024 & 2032
- Figure 33: Asia Pacific qPCR Reagent Industry Revenue Share (%), by End-User 2024 & 2032
- Figure 34: Asia Pacific qPCR Reagent Industry Revenue (Million), by Country 2024 & 2032
- Figure 35: Asia Pacific qPCR Reagent Industry Revenue Share (%), by Country 2024 & 2032
- Figure 36: Middle East and Africa qPCR Reagent Industry Revenue (Million), by Detection Method 2024 & 2032
- Figure 37: Middle East and Africa qPCR Reagent Industry Revenue Share (%), by Detection Method 2024 & 2032
- Figure 38: Middle East and Africa qPCR Reagent Industry Revenue (Million), by Packaging Type 2024 & 2032
- Figure 39: Middle East and Africa qPCR Reagent Industry Revenue Share (%), by Packaging Type 2024 & 2032
- Figure 40: Middle East and Africa qPCR Reagent Industry Revenue (Million), by End-User 2024 & 2032
- Figure 41: Middle East and Africa qPCR Reagent Industry Revenue Share (%), by End-User 2024 & 2032
- Figure 42: Middle East and Africa qPCR Reagent Industry Revenue (Million), by Country 2024 & 2032
- Figure 43: Middle East and Africa qPCR Reagent Industry Revenue Share (%), by Country 2024 & 2032
- Figure 44: South America qPCR Reagent Industry Revenue (Million), by Detection Method 2024 & 2032
- Figure 45: South America qPCR Reagent Industry Revenue Share (%), by Detection Method 2024 & 2032
- Figure 46: South America qPCR Reagent Industry Revenue (Million), by Packaging Type 2024 & 2032
- Figure 47: South America qPCR Reagent Industry Revenue Share (%), by Packaging Type 2024 & 2032
- Figure 48: South America qPCR Reagent Industry Revenue (Million), by End-User 2024 & 2032
- Figure 49: South America qPCR Reagent Industry Revenue Share (%), by End-User 2024 & 2032
- Figure 50: South America qPCR Reagent Industry Revenue (Million), by Country 2024 & 2032
- Figure 51: South America qPCR Reagent Industry Revenue Share (%), by Country 2024 & 2032
List of Tables
- Table 1: Global qPCR Reagent Industry Revenue Million Forecast, by Region 2019 & 2032
- Table 2: Global qPCR Reagent Industry Revenue Million Forecast, by Detection Method 2019 & 2032
- Table 3: Global qPCR Reagent Industry Revenue Million Forecast, by Packaging Type 2019 & 2032
- Table 4: Global qPCR Reagent Industry Revenue Million Forecast, by End-User 2019 & 2032
- Table 5: Global qPCR Reagent Industry Revenue Million Forecast, by Region 2019 & 2032
- Table 6: Global qPCR Reagent Industry Revenue Million Forecast, by Country 2019 & 2032
- Table 7: United States qPCR Reagent Industry Revenue (Million) Forecast, by Application 2019 & 2032
- Table 8: Canada qPCR Reagent Industry Revenue (Million) Forecast, by Application 2019 & 2032
- Table 9: Mexico qPCR Reagent Industry Revenue (Million) Forecast, by Application 2019 & 2032
- Table 10: Global qPCR Reagent Industry Revenue Million Forecast, by Country 2019 & 2032
- Table 11: Germany qPCR Reagent Industry Revenue (Million) Forecast, by Application 2019 & 2032
- Table 12: United Kingdom qPCR Reagent Industry Revenue (Million) Forecast, by Application 2019 & 2032
- Table 13: France qPCR Reagent Industry Revenue (Million) Forecast, by Application 2019 & 2032
- Table 14: Italy qPCR Reagent Industry Revenue (Million) Forecast, by Application 2019 & 2032
- Table 15: Spain qPCR Reagent Industry Revenue (Million) Forecast, by Application 2019 & 2032
- Table 16: Rest of Europe qPCR Reagent Industry Revenue (Million) Forecast, by Application 2019 & 2032
- Table 17: Global qPCR Reagent Industry Revenue Million Forecast, by Country 2019 & 2032
- Table 18: China qPCR Reagent Industry Revenue (Million) Forecast, by Application 2019 & 2032
- Table 19: Japan qPCR Reagent Industry Revenue (Million) Forecast, by Application 2019 & 2032
- Table 20: India qPCR Reagent Industry Revenue (Million) Forecast, by Application 2019 & 2032
- Table 21: Australia qPCR Reagent Industry Revenue (Million) Forecast, by Application 2019 & 2032
- Table 22: South Korea qPCR Reagent Industry Revenue (Million) Forecast, by Application 2019 & 2032
- Table 23: Rest of Asia Pacific qPCR Reagent Industry Revenue (Million) Forecast, by Application 2019 & 2032
- Table 24: Global qPCR Reagent Industry Revenue Million Forecast, by Country 2019 & 2032
- Table 25: GCC qPCR Reagent Industry Revenue (Million) Forecast, by Application 2019 & 2032
- Table 26: South Africa qPCR Reagent Industry Revenue (Million) Forecast, by Application 2019 & 2032
- Table 27: Rest of Middle East and Africa qPCR Reagent Industry Revenue (Million) Forecast, by Application 2019 & 2032
- Table 28: Global qPCR Reagent Industry Revenue Million Forecast, by Country 2019 & 2032
- Table 29: Brazil qPCR Reagent Industry Revenue (Million) Forecast, by Application 2019 & 2032
- Table 30: Argentina qPCR Reagent Industry Revenue (Million) Forecast, by Application 2019 & 2032
- Table 31: Rest of South America qPCR Reagent Industry Revenue (Million) Forecast, by Application 2019 & 2032
- Table 32: Global qPCR Reagent Industry Revenue Million Forecast, by Detection Method 2019 & 2032
- Table 33: Global qPCR Reagent Industry Revenue Million Forecast, by Packaging Type 2019 & 2032
- Table 34: Global qPCR Reagent Industry Revenue Million Forecast, by End-User 2019 & 2032
- Table 35: Global qPCR Reagent Industry Revenue Million Forecast, by Country 2019 & 2032
- Table 36: United States qPCR Reagent Industry Revenue (Million) Forecast, by Application 2019 & 2032
- Table 37: Canada qPCR Reagent Industry Revenue (Million) Forecast, by Application 2019 & 2032
- Table 38: Mexico qPCR Reagent Industry Revenue (Million) Forecast, by Application 2019 & 2032
- Table 39: Global qPCR Reagent Industry Revenue Million Forecast, by Detection Method 2019 & 2032
- Table 40: Global qPCR Reagent Industry Revenue Million Forecast, by Packaging Type 2019 & 2032
- Table 41: Global qPCR Reagent Industry Revenue Million Forecast, by End-User 2019 & 2032
- Table 42: Global qPCR Reagent Industry Revenue Million Forecast, by Country 2019 & 2032
- Table 43: Germany qPCR Reagent Industry Revenue (Million) Forecast, by Application 2019 & 2032
- Table 44: United Kingdom qPCR Reagent Industry Revenue (Million) Forecast, by Application 2019 & 2032
- Table 45: France qPCR Reagent Industry Revenue (Million) Forecast, by Application 2019 & 2032
- Table 46: Italy qPCR Reagent Industry Revenue (Million) Forecast, by Application 2019 & 2032
- Table 47: Spain qPCR Reagent Industry Revenue (Million) Forecast, by Application 2019 & 2032
- Table 48: Rest of Europe qPCR Reagent Industry Revenue (Million) Forecast, by Application 2019 & 2032
- Table 49: Global qPCR Reagent Industry Revenue Million Forecast, by Detection Method 2019 & 2032
- Table 50: Global qPCR Reagent Industry Revenue Million Forecast, by Packaging Type 2019 & 2032
- Table 51: Global qPCR Reagent Industry Revenue Million Forecast, by End-User 2019 & 2032
- Table 52: Global qPCR Reagent Industry Revenue Million Forecast, by Country 2019 & 2032
- Table 53: China qPCR Reagent Industry Revenue (Million) Forecast, by Application 2019 & 2032
- Table 54: Japan qPCR Reagent Industry Revenue (Million) Forecast, by Application 2019 & 2032
- Table 55: India qPCR Reagent Industry Revenue (Million) Forecast, by Application 2019 & 2032
- Table 56: Australia qPCR Reagent Industry Revenue (Million) Forecast, by Application 2019 & 2032
- Table 57: South Korea qPCR Reagent Industry Revenue (Million) Forecast, by Application 2019 & 2032
- Table 58: Rest of Asia Pacific qPCR Reagent Industry Revenue (Million) Forecast, by Application 2019 & 2032
- Table 59: Global qPCR Reagent Industry Revenue Million Forecast, by Detection Method 2019 & 2032
- Table 60: Global qPCR Reagent Industry Revenue Million Forecast, by Packaging Type 2019 & 2032
- Table 61: Global qPCR Reagent Industry Revenue Million Forecast, by End-User 2019 & 2032
- Table 62: Global qPCR Reagent Industry Revenue Million Forecast, by Country 2019 & 2032
- Table 63: GCC qPCR Reagent Industry Revenue (Million) Forecast, by Application 2019 & 2032
- Table 64: South Africa qPCR Reagent Industry Revenue (Million) Forecast, by Application 2019 & 2032
- Table 65: Rest of Middle East and Africa qPCR Reagent Industry Revenue (Million) Forecast, by Application 2019 & 2032
- Table 66: Global qPCR Reagent Industry Revenue Million Forecast, by Detection Method 2019 & 2032
- Table 67: Global qPCR Reagent Industry Revenue Million Forecast, by Packaging Type 2019 & 2032
- Table 68: Global qPCR Reagent Industry Revenue Million Forecast, by End-User 2019 & 2032
- Table 69: Global qPCR Reagent Industry Revenue Million Forecast, by Country 2019 & 2032
- Table 70: Brazil qPCR Reagent Industry Revenue (Million) Forecast, by Application 2019 & 2032
- Table 71: Argentina qPCR Reagent Industry Revenue (Million) Forecast, by Application 2019 & 2032
- Table 72: Rest of South America qPCR Reagent Industry Revenue (Million) Forecast, by Application 2019 & 2032
Frequently Asked Questions
1. What is the projected Compound Annual Growth Rate (CAGR) of the qPCR Reagent Industry?
The projected CAGR is approximately 7.90%.
2. Which companies are prominent players in the qPCR Reagent Industry?
Key companies in the market include Promega Corporation, Bio-Rad Laboratories Inc, Takara Bio Inc, Quanta Biosciences Inc, Thermo Fisher Scientific, Sigma-Aldrich Corporation (Merck KGaA), Agilent Technologies Inc, F Hoffman-La Roche Ltd, Kaneka Eurogentec S A.
3. What are the main segments of the qPCR Reagent Industry?
The market segments include Detection Method, Packaging Type, End-User.
4. Can you provide details about the market size?
The market size is estimated to be USD XX Million as of 2022.
5. What are some drivers contributing to market growth?
Rising Incidence of Infectious Diseases and Genetic Disorders; Growing Geriatric Population; Increasing Focus on Human Genome Projects.
6. What are the notable trends driving market growth?
Dye-Based qPCR Reagents are Expected to Dominate the Market.
7. Are there any restraints impacting market growth?
High Cost of Reagents and qPCR Equipment; Lack of Technical Expertise to Operate the qPCR instrument.
8. Can you provide examples of recent developments in the market?
November 2022: PCR Biosystems launched a new family of qPCR reagent mixes: Clara Probe Mix, Clara Probe 1-Step Mix, and Clara HRM Mix. The cutting-edge Clara family of mixes relies on a novel composition to push the boundaries of performance to meet the challenges of laboratories.
9. What pricing options are available for accessing the report?
Pricing options include single-user, multi-user, and enterprise licenses priced at USD 4750, USD 5250, and USD 8750 respectively.
10. Is the market size provided in terms of value or volume?
The market size is provided in terms of value, measured in Million.
11. Are there any specific market keywords associated with the report?
Yes, the market keyword associated with the report is "qPCR Reagent Industry," which aids in identifying and referencing the specific market segment covered.
12. How do I determine which pricing option suits my needs best?
The pricing options vary based on user requirements and access needs. Individual users may opt for single-user licenses, while businesses requiring broader access may choose multi-user or enterprise licenses for cost-effective access to the report.
13. Are there any additional resources or data provided in the qPCR Reagent Industry report?
While the report offers comprehensive insights, it's advisable to review the specific contents or supplementary materials provided to ascertain if additional resources or data are available.
14. How can I stay updated on further developments or reports in the qPCR Reagent Industry?
To stay informed about further developments, trends, and reports in the qPCR Reagent Industry, consider subscribing to industry newsletters, following relevant companies and organizations, or regularly checking reputable industry news sources and publications.
Methodology
Step 1 - Identification of Relevant Samples Size from Population Database


Step 2 - Approaches for Defining Global Market Size (Value, Volume* & Price*)

Note*: In applicable scenarios
Step 3 - Data Sources
Primary Research
- Web Analytics
- Survey Reports
- Research Institute
- Latest Research Reports
- Opinion Leaders
Secondary Research
- Annual Reports
- White Paper
- Latest Press Release
- Industry Association
- Paid Database
- Investor Presentations

Step 4 - Data Triangulation
Involves using different sources of information in order to increase the validity of a study
These sources are likely to be stakeholders in a program - participants, other researchers, program staff, other community members, and so on.
Then we put all data in single framework & apply various statistical tools to find out the dynamic on the market.
During the analysis stage, feedback from the stakeholder groups would be compared to determine areas of agreement as well as areas of divergence


