
Key Insights
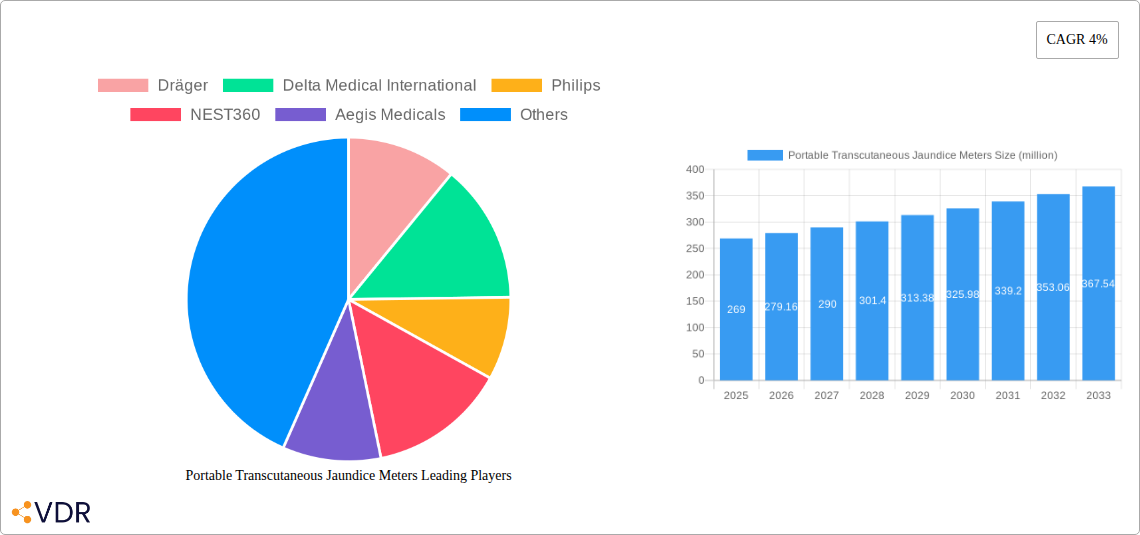
The portable transcutaneous jaundice meter market, currently valued at $269 million in 2025, is projected to experience steady growth, driven by factors such as the increasing prevalence of neonatal jaundice, advancements in non-invasive diagnostic technologies, and a growing preference for point-of-care testing in both developed and developing nations. The market's 4% CAGR suggests a consistent demand for these devices, fueled by the need for rapid and accurate diagnosis in diverse healthcare settings, including hospitals, neonatal intensive care units (NICUs), and even home healthcare environments. Technological advancements leading to smaller, more user-friendly, and cost-effective devices are further bolstering market expansion. While challenges such as the high initial investment cost for advanced models and the potential for variations in measurement accuracy depending on skin pigmentation might act as restraints, the overall market outlook remains positive. The competitive landscape is populated by a mix of established medical device manufacturers like Dräger, Philips, and Natus Medical, alongside emerging players focusing on innovative solutions. Growth is expected across all regions, with North America and Europe maintaining a significant market share due to advanced healthcare infrastructure and high awareness of neonatal jaundice. However, Asia-Pacific is poised for significant growth, driven by increasing healthcare expenditure and rising birth rates.
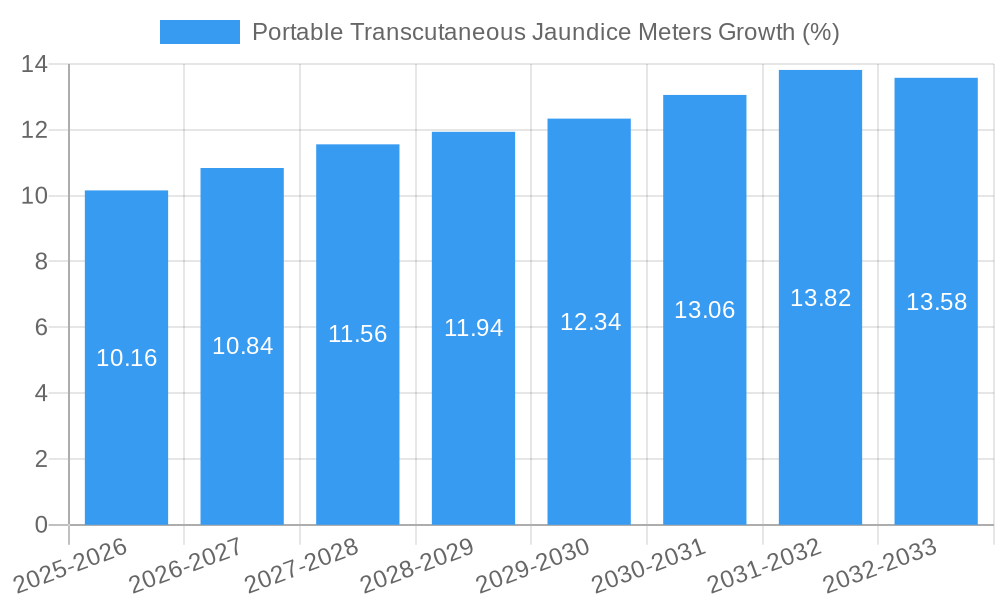
The forecast period (2025-2033) anticipates continued market expansion, primarily driven by improved affordability of the devices and their increasing adoption in resource-constrained settings. This growth will likely be accompanied by further technological innovation, focusing on enhanced accuracy, portability, and integration with electronic health records (EHRs). Companies are likely to focus on strategic partnerships and collaborations to expand their market reach and offer comprehensive solutions encompassing not just the device but also associated services and training. The competitive landscape is expected to become even more dynamic with the potential entry of new players focused on specific market niches or innovative technologies. The increasing demand for remote patient monitoring and telemedicine further enhances the future prospects of portable transcutaneous jaundice meters, allowing for convenient and timely monitoring of jaundice levels even in geographically dispersed populations.
Portable Transcutaneous Jaundice Meters Market Report: 2019-2033
This comprehensive report provides an in-depth analysis of the Portable Transcutaneous Jaundice Meters market, encompassing market dynamics, growth trends, regional dominance, product landscape, key players, and future outlook. The report covers the period 2019-2033, with a base year of 2025 and a forecast period of 2025-2033. The parent market is the medical device industry, while the child market is neonatal care and diagnostics. The global market size is estimated at xx million units in 2025.
Portable Transcutaneous Jaundice Meters Market Dynamics & Structure
The portable transcutaneous jaundice meter market is characterized by moderate concentration, with key players holding significant market share. Technological innovation, driven by advancements in sensor technology and miniaturization, is a primary growth driver. Stringent regulatory frameworks governing medical device approvals influence market entry and product development. Competitive substitutes include laboratory-based bilirubin tests; however, the portability and ease of use of transcutaneous meters offer a significant advantage. The end-user demographic primarily comprises neonatal intensive care units (NICUs) and hospitals. M&A activity in the sector has been moderate, with xx deals recorded between 2019 and 2024, primarily focused on expanding product portfolios and geographical reach.
- Market Concentration: Moderately concentrated, with top 5 players holding approximately xx% market share in 2025.
- Technological Innovation: Miniaturization, improved sensor accuracy, and wireless connectivity are key drivers.
- Regulatory Landscape: Compliance with FDA (USA) and CE (Europe) standards is crucial.
- Competitive Substitutes: Laboratory-based bilirubin tests present competition, but portability gives transcutaneous meters an edge.
- M&A Activity: xx deals recorded from 2019-2024, primarily driven by expansion strategies.
- Innovation Barriers: High regulatory hurdles and significant R&D investment requirements.
Portable Transcutaneous Jaundice Meters Growth Trends & Insights
The global portable transcutaneous jaundice meter market is experiencing robust growth, driven by increasing prevalence of neonatal jaundice, rising awareness of early diagnosis and treatment, and technological advancements. The market size exhibited a CAGR of xx% during the historical period (2019-2024) and is projected to grow at a CAGR of xx% during the forecast period (2025-2033), reaching xx million units by 2033. This growth is fueled by increasing adoption rates in both developed and developing economies, improved healthcare infrastructure, and a growing preference for non-invasive diagnostic techniques. Technological disruptions, such as the integration of artificial intelligence for improved accuracy and remote monitoring capabilities, are further accelerating market expansion. Consumer behavior shifts towards personalized healthcare and demand for home-based diagnostics are also contributing to market growth.
Dominant Regions, Countries, or Segments in Portable Transcutaneous Jaundice Meters
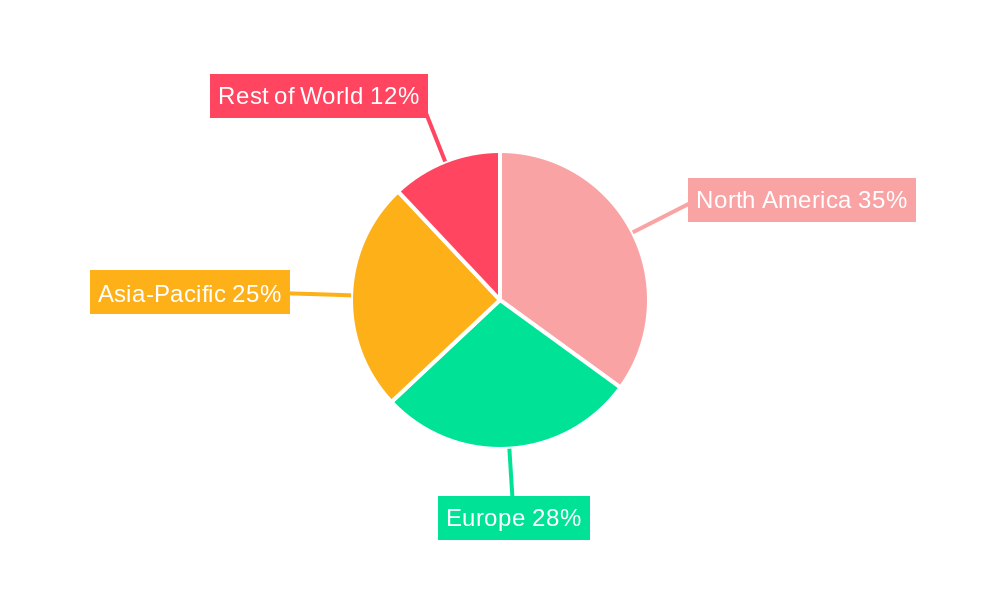
North America currently holds the largest market share for portable transcutaneous jaundice meters, driven by advanced healthcare infrastructure, high adoption rates in NICUs, and a robust regulatory framework supporting innovation. Europe follows as the second-largest market, characterized by strong healthcare spending and a growing focus on early detection of neonatal jaundice. Asia-Pacific is expected to witness significant growth during the forecast period, fueled by increasing healthcare expenditure, rising birth rates, and improving healthcare infrastructure in developing economies such as India and China. The hospital segment dominates the market, followed by NICUs and home care settings.
- North America: High adoption rates, advanced healthcare infrastructure, and robust regulatory framework.
- Europe: Strong healthcare spending and focus on early detection of neonatal jaundice.
- Asia-Pacific: High birth rates, increasing healthcare expenditure, and improving infrastructure.
- Hospital Segment: Largest market share due to high patient volume and advanced diagnostic facilities.
Portable Transcutaneous Jaundice Meters Product Landscape
The market offers a range of portable transcutaneous jaundice meters varying in features, accuracy, and price points. Recent innovations include smaller, more portable devices with improved user interfaces and wireless connectivity for data transmission and remote monitoring. These advancements enhance ease of use, improve diagnostic accuracy, and facilitate efficient data management. Unique selling propositions include faster measurement times, enhanced accuracy, and integration with existing hospital information systems.
Key Drivers, Barriers & Challenges in Portable Transcutaneous Jaundice Meters
Key Drivers: Rising prevalence of neonatal jaundice, increasing awareness of early detection and treatment, technological advancements, and growing demand for non-invasive diagnostic techniques are key market drivers. Government initiatives promoting early intervention in newborn healthcare also contribute significantly.
Challenges & Restraints: High initial investment costs for hospitals and clinics can hinder adoption. The need for skilled personnel to operate and interpret results poses a barrier, especially in resource-constrained settings. Stringent regulatory approvals and potential supply chain disruptions (e.g., component shortages) also impact market growth.
Emerging Opportunities in Portable Transcutaneous Jaundice Meters
Emerging opportunities include expanding into untapped markets in developing economies, integrating advanced technologies like AI for improved diagnostic accuracy and remote monitoring, and developing home-based testing solutions. The focus on point-of-care diagnostics and the growth of telehealth present significant opportunities for expansion.
Growth Accelerators in the Portable Transcutaneous Jaundice Meters Industry
Technological breakthroughs, such as the development of more accurate and miniaturized sensors, coupled with strategic partnerships between device manufacturers and healthcare providers, are accelerating market growth. Expanding into emerging markets and focusing on cost-effective solutions are also vital growth catalysts.
Key Players Shaping the Portable Transcutaneous Jaundice Meters Market
- Dräger
- Delta Medical International
- Philips
- NEST360
- Aegis Medicals
- Natus Medical
- Micro Lab
- Heal Force
- mbelec
- Xuzhou Kejian Hi-tech
- Refine Medical Technology
- Zhengzhou Dison Instrument And Meter Co.,Ltd.
Notable Milestones in Portable Transcutaneous Jaundice Meters Sector
- 2020: Launch of a new portable jaundice meter with improved accuracy by Dräger.
- 2022: Acquisition of a smaller jaundice meter company by Philips.
- 2023: FDA approval for a wireless, cloud-connected jaundice meter. (Specific company not publicly available - xx).
In-Depth Portable Transcutaneous Jaundice Meters Market Outlook
The portable transcutaneous jaundice meter market is poised for continued strong growth, driven by technological advancements, increased awareness of neonatal jaundice, and expansion into emerging markets. Strategic partnerships, product innovation, and focusing on cost-effective solutions will be crucial for companies to capitalize on the significant market potential. The market is expected to witness a substantial increase in adoption across diverse healthcare settings, leading to a significant market expansion in the coming years.
Portable Transcutaneous Jaundice Meters Segmentation
-
1. Application
- 1.1. Hospital
- 1.2. Community
- 1.3. Family
-
2. Types
- 2.1. Direct Reading Type
- 2.2. Indirect Reading Type
Portable Transcutaneous Jaundice Meters Segmentation By Geography
-
1. North America
- 1.1. United States
- 1.2. Canada
- 1.3. Mexico
-
2. South America
- 2.1. Brazil
- 2.2. Argentina
- 2.3. Rest of South America
-
3. Europe
- 3.1. United Kingdom
- 3.2. Germany
- 3.3. France
- 3.4. Italy
- 3.5. Spain
- 3.6. Russia
- 3.7. Benelux
- 3.8. Nordics
- 3.9. Rest of Europe
-
4. Middle East & Africa
- 4.1. Turkey
- 4.2. Israel
- 4.3. GCC
- 4.4. North Africa
- 4.5. South Africa
- 4.6. Rest of Middle East & Africa
-
5. Asia Pacific
- 5.1. China
- 5.2. India
- 5.3. Japan
- 5.4. South Korea
- 5.5. ASEAN
- 5.6. Oceania
- 5.7. Rest of Asia Pacific
Portable Transcutaneous Jaundice Meters REPORT HIGHLIGHTS
| Aspects | Details |
|---|---|
| Study Period | 2019-2033 |
| Base Year | 2024 |
| Estimated Year | 2025 |
| Forecast Period | 2025-2033 |
| Historical Period | 2019-2024 |
| Growth Rate | CAGR of 4% from 2019-2033 |
| Segmentation |
|
Table of Contents
- 1. Introduction
- 1.1. Research Scope
- 1.2. Market Segmentation
- 1.3. Research Methodology
- 1.4. Definitions and Assumptions
- 2. Executive Summary
- 2.1. Introduction
- 3. Market Dynamics
- 3.1. Introduction
- 3.2. Market Drivers
- 3.3. Market Restrains
- 3.4. Market Trends
- 4. Market Factor Analysis
- 4.1. Porters Five Forces
- 4.2. Supply/Value Chain
- 4.3. PESTEL analysis
- 4.4. Market Entropy
- 4.5. Patent/Trademark Analysis
- 5. Global Portable Transcutaneous Jaundice Meters Analysis, Insights and Forecast, 2019-2031
- 5.1. Market Analysis, Insights and Forecast - by Application
- 5.1.1. Hospital
- 5.1.2. Community
- 5.1.3. Family
- 5.2. Market Analysis, Insights and Forecast - by Types
- 5.2.1. Direct Reading Type
- 5.2.2. Indirect Reading Type
- 5.3. Market Analysis, Insights and Forecast - by Region
- 5.3.1. North America
- 5.3.2. South America
- 5.3.3. Europe
- 5.3.4. Middle East & Africa
- 5.3.5. Asia Pacific
- 5.1. Market Analysis, Insights and Forecast - by Application
- 6. North America Portable Transcutaneous Jaundice Meters Analysis, Insights and Forecast, 2019-2031
- 6.1. Market Analysis, Insights and Forecast - by Application
- 6.1.1. Hospital
- 6.1.2. Community
- 6.1.3. Family
- 6.2. Market Analysis, Insights and Forecast - by Types
- 6.2.1. Direct Reading Type
- 6.2.2. Indirect Reading Type
- 6.1. Market Analysis, Insights and Forecast - by Application
- 7. South America Portable Transcutaneous Jaundice Meters Analysis, Insights and Forecast, 2019-2031
- 7.1. Market Analysis, Insights and Forecast - by Application
- 7.1.1. Hospital
- 7.1.2. Community
- 7.1.3. Family
- 7.2. Market Analysis, Insights and Forecast - by Types
- 7.2.1. Direct Reading Type
- 7.2.2. Indirect Reading Type
- 7.1. Market Analysis, Insights and Forecast - by Application
- 8. Europe Portable Transcutaneous Jaundice Meters Analysis, Insights and Forecast, 2019-2031
- 8.1. Market Analysis, Insights and Forecast - by Application
- 8.1.1. Hospital
- 8.1.2. Community
- 8.1.3. Family
- 8.2. Market Analysis, Insights and Forecast - by Types
- 8.2.1. Direct Reading Type
- 8.2.2. Indirect Reading Type
- 8.1. Market Analysis, Insights and Forecast - by Application
- 9. Middle East & Africa Portable Transcutaneous Jaundice Meters Analysis, Insights and Forecast, 2019-2031
- 9.1. Market Analysis, Insights and Forecast - by Application
- 9.1.1. Hospital
- 9.1.2. Community
- 9.1.3. Family
- 9.2. Market Analysis, Insights and Forecast - by Types
- 9.2.1. Direct Reading Type
- 9.2.2. Indirect Reading Type
- 9.1. Market Analysis, Insights and Forecast - by Application
- 10. Asia Pacific Portable Transcutaneous Jaundice Meters Analysis, Insights and Forecast, 2019-2031
- 10.1. Market Analysis, Insights and Forecast - by Application
- 10.1.1. Hospital
- 10.1.2. Community
- 10.1.3. Family
- 10.2. Market Analysis, Insights and Forecast - by Types
- 10.2.1. Direct Reading Type
- 10.2.2. Indirect Reading Type
- 10.1. Market Analysis, Insights and Forecast - by Application
- 11. Competitive Analysis
- 11.1. Global Market Share Analysis 2024
- 11.2. Company Profiles
- 11.2.1 Dräger
- 11.2.1.1. Overview
- 11.2.1.2. Products
- 11.2.1.3. SWOT Analysis
- 11.2.1.4. Recent Developments
- 11.2.1.5. Financials (Based on Availability)
- 11.2.2 Delta Medical International
- 11.2.2.1. Overview
- 11.2.2.2. Products
- 11.2.2.3. SWOT Analysis
- 11.2.2.4. Recent Developments
- 11.2.2.5. Financials (Based on Availability)
- 11.2.3 Philips
- 11.2.3.1. Overview
- 11.2.3.2. Products
- 11.2.3.3. SWOT Analysis
- 11.2.3.4. Recent Developments
- 11.2.3.5. Financials (Based on Availability)
- 11.2.4 NEST360
- 11.2.4.1. Overview
- 11.2.4.2. Products
- 11.2.4.3. SWOT Analysis
- 11.2.4.4. Recent Developments
- 11.2.4.5. Financials (Based on Availability)
- 11.2.5 Aegis Medicals
- 11.2.5.1. Overview
- 11.2.5.2. Products
- 11.2.5.3. SWOT Analysis
- 11.2.5.4. Recent Developments
- 11.2.5.5. Financials (Based on Availability)
- 11.2.6 Natus Medical
- 11.2.6.1. Overview
- 11.2.6.2. Products
- 11.2.6.3. SWOT Analysis
- 11.2.6.4. Recent Developments
- 11.2.6.5. Financials (Based on Availability)
- 11.2.7 Micro Lab
- 11.2.7.1. Overview
- 11.2.7.2. Products
- 11.2.7.3. SWOT Analysis
- 11.2.7.4. Recent Developments
- 11.2.7.5. Financials (Based on Availability)
- 11.2.8 Heal Force
- 11.2.8.1. Overview
- 11.2.8.2. Products
- 11.2.8.3. SWOT Analysis
- 11.2.8.4. Recent Developments
- 11.2.8.5. Financials (Based on Availability)
- 11.2.9 mbelec
- 11.2.9.1. Overview
- 11.2.9.2. Products
- 11.2.9.3. SWOT Analysis
- 11.2.9.4. Recent Developments
- 11.2.9.5. Financials (Based on Availability)
- 11.2.10 Xuzhou Kejian Hi-tech
- 11.2.10.1. Overview
- 11.2.10.2. Products
- 11.2.10.3. SWOT Analysis
- 11.2.10.4. Recent Developments
- 11.2.10.5. Financials (Based on Availability)
- 11.2.11 Refine Medical Technology
- 11.2.11.1. Overview
- 11.2.11.2. Products
- 11.2.11.3. SWOT Analysis
- 11.2.11.4. Recent Developments
- 11.2.11.5. Financials (Based on Availability)
- 11.2.12 Zhengzhou Dison Instrument And Meter Co.
- 11.2.12.1. Overview
- 11.2.12.2. Products
- 11.2.12.3. SWOT Analysis
- 11.2.12.4. Recent Developments
- 11.2.12.5. Financials (Based on Availability)
- 11.2.13 Ltd.
- 11.2.13.1. Overview
- 11.2.13.2. Products
- 11.2.13.3. SWOT Analysis
- 11.2.13.4. Recent Developments
- 11.2.13.5. Financials (Based on Availability)
- 11.2.1 Dräger
List of Figures
- Figure 1: Global Portable Transcutaneous Jaundice Meters Revenue Breakdown (million, %) by Region 2024 & 2032
- Figure 2: Global Portable Transcutaneous Jaundice Meters Volume Breakdown (K, %) by Region 2024 & 2032
- Figure 3: North America Portable Transcutaneous Jaundice Meters Revenue (million), by Application 2024 & 2032
- Figure 4: North America Portable Transcutaneous Jaundice Meters Volume (K), by Application 2024 & 2032
- Figure 5: North America Portable Transcutaneous Jaundice Meters Revenue Share (%), by Application 2024 & 2032
- Figure 6: North America Portable Transcutaneous Jaundice Meters Volume Share (%), by Application 2024 & 2032
- Figure 7: North America Portable Transcutaneous Jaundice Meters Revenue (million), by Types 2024 & 2032
- Figure 8: North America Portable Transcutaneous Jaundice Meters Volume (K), by Types 2024 & 2032
- Figure 9: North America Portable Transcutaneous Jaundice Meters Revenue Share (%), by Types 2024 & 2032
- Figure 10: North America Portable Transcutaneous Jaundice Meters Volume Share (%), by Types 2024 & 2032
- Figure 11: North America Portable Transcutaneous Jaundice Meters Revenue (million), by Country 2024 & 2032
- Figure 12: North America Portable Transcutaneous Jaundice Meters Volume (K), by Country 2024 & 2032
- Figure 13: North America Portable Transcutaneous Jaundice Meters Revenue Share (%), by Country 2024 & 2032
- Figure 14: North America Portable Transcutaneous Jaundice Meters Volume Share (%), by Country 2024 & 2032
- Figure 15: South America Portable Transcutaneous Jaundice Meters Revenue (million), by Application 2024 & 2032
- Figure 16: South America Portable Transcutaneous Jaundice Meters Volume (K), by Application 2024 & 2032
- Figure 17: South America Portable Transcutaneous Jaundice Meters Revenue Share (%), by Application 2024 & 2032
- Figure 18: South America Portable Transcutaneous Jaundice Meters Volume Share (%), by Application 2024 & 2032
- Figure 19: South America Portable Transcutaneous Jaundice Meters Revenue (million), by Types 2024 & 2032
- Figure 20: South America Portable Transcutaneous Jaundice Meters Volume (K), by Types 2024 & 2032
- Figure 21: South America Portable Transcutaneous Jaundice Meters Revenue Share (%), by Types 2024 & 2032
- Figure 22: South America Portable Transcutaneous Jaundice Meters Volume Share (%), by Types 2024 & 2032
- Figure 23: South America Portable Transcutaneous Jaundice Meters Revenue (million), by Country 2024 & 2032
- Figure 24: South America Portable Transcutaneous Jaundice Meters Volume (K), by Country 2024 & 2032
- Figure 25: South America Portable Transcutaneous Jaundice Meters Revenue Share (%), by Country 2024 & 2032
- Figure 26: South America Portable Transcutaneous Jaundice Meters Volume Share (%), by Country 2024 & 2032
- Figure 27: Europe Portable Transcutaneous Jaundice Meters Revenue (million), by Application 2024 & 2032
- Figure 28: Europe Portable Transcutaneous Jaundice Meters Volume (K), by Application 2024 & 2032
- Figure 29: Europe Portable Transcutaneous Jaundice Meters Revenue Share (%), by Application 2024 & 2032
- Figure 30: Europe Portable Transcutaneous Jaundice Meters Volume Share (%), by Application 2024 & 2032
- Figure 31: Europe Portable Transcutaneous Jaundice Meters Revenue (million), by Types 2024 & 2032
- Figure 32: Europe Portable Transcutaneous Jaundice Meters Volume (K), by Types 2024 & 2032
- Figure 33: Europe Portable Transcutaneous Jaundice Meters Revenue Share (%), by Types 2024 & 2032
- Figure 34: Europe Portable Transcutaneous Jaundice Meters Volume Share (%), by Types 2024 & 2032
- Figure 35: Europe Portable Transcutaneous Jaundice Meters Revenue (million), by Country 2024 & 2032
- Figure 36: Europe Portable Transcutaneous Jaundice Meters Volume (K), by Country 2024 & 2032
- Figure 37: Europe Portable Transcutaneous Jaundice Meters Revenue Share (%), by Country 2024 & 2032
- Figure 38: Europe Portable Transcutaneous Jaundice Meters Volume Share (%), by Country 2024 & 2032
- Figure 39: Middle East & Africa Portable Transcutaneous Jaundice Meters Revenue (million), by Application 2024 & 2032
- Figure 40: Middle East & Africa Portable Transcutaneous Jaundice Meters Volume (K), by Application 2024 & 2032
- Figure 41: Middle East & Africa Portable Transcutaneous Jaundice Meters Revenue Share (%), by Application 2024 & 2032
- Figure 42: Middle East & Africa Portable Transcutaneous Jaundice Meters Volume Share (%), by Application 2024 & 2032
- Figure 43: Middle East & Africa Portable Transcutaneous Jaundice Meters Revenue (million), by Types 2024 & 2032
- Figure 44: Middle East & Africa Portable Transcutaneous Jaundice Meters Volume (K), by Types 2024 & 2032
- Figure 45: Middle East & Africa Portable Transcutaneous Jaundice Meters Revenue Share (%), by Types 2024 & 2032
- Figure 46: Middle East & Africa Portable Transcutaneous Jaundice Meters Volume Share (%), by Types 2024 & 2032
- Figure 47: Middle East & Africa Portable Transcutaneous Jaundice Meters Revenue (million), by Country 2024 & 2032
- Figure 48: Middle East & Africa Portable Transcutaneous Jaundice Meters Volume (K), by Country 2024 & 2032
- Figure 49: Middle East & Africa Portable Transcutaneous Jaundice Meters Revenue Share (%), by Country 2024 & 2032
- Figure 50: Middle East & Africa Portable Transcutaneous Jaundice Meters Volume Share (%), by Country 2024 & 2032
- Figure 51: Asia Pacific Portable Transcutaneous Jaundice Meters Revenue (million), by Application 2024 & 2032
- Figure 52: Asia Pacific Portable Transcutaneous Jaundice Meters Volume (K), by Application 2024 & 2032
- Figure 53: Asia Pacific Portable Transcutaneous Jaundice Meters Revenue Share (%), by Application 2024 & 2032
- Figure 54: Asia Pacific Portable Transcutaneous Jaundice Meters Volume Share (%), by Application 2024 & 2032
- Figure 55: Asia Pacific Portable Transcutaneous Jaundice Meters Revenue (million), by Types 2024 & 2032
- Figure 56: Asia Pacific Portable Transcutaneous Jaundice Meters Volume (K), by Types 2024 & 2032
- Figure 57: Asia Pacific Portable Transcutaneous Jaundice Meters Revenue Share (%), by Types 2024 & 2032
- Figure 58: Asia Pacific Portable Transcutaneous Jaundice Meters Volume Share (%), by Types 2024 & 2032
- Figure 59: Asia Pacific Portable Transcutaneous Jaundice Meters Revenue (million), by Country 2024 & 2032
- Figure 60: Asia Pacific Portable Transcutaneous Jaundice Meters Volume (K), by Country 2024 & 2032
- Figure 61: Asia Pacific Portable Transcutaneous Jaundice Meters Revenue Share (%), by Country 2024 & 2032
- Figure 62: Asia Pacific Portable Transcutaneous Jaundice Meters Volume Share (%), by Country 2024 & 2032
List of Tables
- Table 1: Global Portable Transcutaneous Jaundice Meters Revenue million Forecast, by Region 2019 & 2032
- Table 2: Global Portable Transcutaneous Jaundice Meters Volume K Forecast, by Region 2019 & 2032
- Table 3: Global Portable Transcutaneous Jaundice Meters Revenue million Forecast, by Application 2019 & 2032
- Table 4: Global Portable Transcutaneous Jaundice Meters Volume K Forecast, by Application 2019 & 2032
- Table 5: Global Portable Transcutaneous Jaundice Meters Revenue million Forecast, by Types 2019 & 2032
- Table 6: Global Portable Transcutaneous Jaundice Meters Volume K Forecast, by Types 2019 & 2032
- Table 7: Global Portable Transcutaneous Jaundice Meters Revenue million Forecast, by Region 2019 & 2032
- Table 8: Global Portable Transcutaneous Jaundice Meters Volume K Forecast, by Region 2019 & 2032
- Table 9: Global Portable Transcutaneous Jaundice Meters Revenue million Forecast, by Application 2019 & 2032
- Table 10: Global Portable Transcutaneous Jaundice Meters Volume K Forecast, by Application 2019 & 2032
- Table 11: Global Portable Transcutaneous Jaundice Meters Revenue million Forecast, by Types 2019 & 2032
- Table 12: Global Portable Transcutaneous Jaundice Meters Volume K Forecast, by Types 2019 & 2032
- Table 13: Global Portable Transcutaneous Jaundice Meters Revenue million Forecast, by Country 2019 & 2032
- Table 14: Global Portable Transcutaneous Jaundice Meters Volume K Forecast, by Country 2019 & 2032
- Table 15: United States Portable Transcutaneous Jaundice Meters Revenue (million) Forecast, by Application 2019 & 2032
- Table 16: United States Portable Transcutaneous Jaundice Meters Volume (K) Forecast, by Application 2019 & 2032
- Table 17: Canada Portable Transcutaneous Jaundice Meters Revenue (million) Forecast, by Application 2019 & 2032
- Table 18: Canada Portable Transcutaneous Jaundice Meters Volume (K) Forecast, by Application 2019 & 2032
- Table 19: Mexico Portable Transcutaneous Jaundice Meters Revenue (million) Forecast, by Application 2019 & 2032
- Table 20: Mexico Portable Transcutaneous Jaundice Meters Volume (K) Forecast, by Application 2019 & 2032
- Table 21: Global Portable Transcutaneous Jaundice Meters Revenue million Forecast, by Application 2019 & 2032
- Table 22: Global Portable Transcutaneous Jaundice Meters Volume K Forecast, by Application 2019 & 2032
- Table 23: Global Portable Transcutaneous Jaundice Meters Revenue million Forecast, by Types 2019 & 2032
- Table 24: Global Portable Transcutaneous Jaundice Meters Volume K Forecast, by Types 2019 & 2032
- Table 25: Global Portable Transcutaneous Jaundice Meters Revenue million Forecast, by Country 2019 & 2032
- Table 26: Global Portable Transcutaneous Jaundice Meters Volume K Forecast, by Country 2019 & 2032
- Table 27: Brazil Portable Transcutaneous Jaundice Meters Revenue (million) Forecast, by Application 2019 & 2032
- Table 28: Brazil Portable Transcutaneous Jaundice Meters Volume (K) Forecast, by Application 2019 & 2032
- Table 29: Argentina Portable Transcutaneous Jaundice Meters Revenue (million) Forecast, by Application 2019 & 2032
- Table 30: Argentina Portable Transcutaneous Jaundice Meters Volume (K) Forecast, by Application 2019 & 2032
- Table 31: Rest of South America Portable Transcutaneous Jaundice Meters Revenue (million) Forecast, by Application 2019 & 2032
- Table 32: Rest of South America Portable Transcutaneous Jaundice Meters Volume (K) Forecast, by Application 2019 & 2032
- Table 33: Global Portable Transcutaneous Jaundice Meters Revenue million Forecast, by Application 2019 & 2032
- Table 34: Global Portable Transcutaneous Jaundice Meters Volume K Forecast, by Application 2019 & 2032
- Table 35: Global Portable Transcutaneous Jaundice Meters Revenue million Forecast, by Types 2019 & 2032
- Table 36: Global Portable Transcutaneous Jaundice Meters Volume K Forecast, by Types 2019 & 2032
- Table 37: Global Portable Transcutaneous Jaundice Meters Revenue million Forecast, by Country 2019 & 2032
- Table 38: Global Portable Transcutaneous Jaundice Meters Volume K Forecast, by Country 2019 & 2032
- Table 39: United Kingdom Portable Transcutaneous Jaundice Meters Revenue (million) Forecast, by Application 2019 & 2032
- Table 40: United Kingdom Portable Transcutaneous Jaundice Meters Volume (K) Forecast, by Application 2019 & 2032
- Table 41: Germany Portable Transcutaneous Jaundice Meters Revenue (million) Forecast, by Application 2019 & 2032
- Table 42: Germany Portable Transcutaneous Jaundice Meters Volume (K) Forecast, by Application 2019 & 2032
- Table 43: France Portable Transcutaneous Jaundice Meters Revenue (million) Forecast, by Application 2019 & 2032
- Table 44: France Portable Transcutaneous Jaundice Meters Volume (K) Forecast, by Application 2019 & 2032
- Table 45: Italy Portable Transcutaneous Jaundice Meters Revenue (million) Forecast, by Application 2019 & 2032
- Table 46: Italy Portable Transcutaneous Jaundice Meters Volume (K) Forecast, by Application 2019 & 2032
- Table 47: Spain Portable Transcutaneous Jaundice Meters Revenue (million) Forecast, by Application 2019 & 2032
- Table 48: Spain Portable Transcutaneous Jaundice Meters Volume (K) Forecast, by Application 2019 & 2032
- Table 49: Russia Portable Transcutaneous Jaundice Meters Revenue (million) Forecast, by Application 2019 & 2032
- Table 50: Russia Portable Transcutaneous Jaundice Meters Volume (K) Forecast, by Application 2019 & 2032
- Table 51: Benelux Portable Transcutaneous Jaundice Meters Revenue (million) Forecast, by Application 2019 & 2032
- Table 52: Benelux Portable Transcutaneous Jaundice Meters Volume (K) Forecast, by Application 2019 & 2032
- Table 53: Nordics Portable Transcutaneous Jaundice Meters Revenue (million) Forecast, by Application 2019 & 2032
- Table 54: Nordics Portable Transcutaneous Jaundice Meters Volume (K) Forecast, by Application 2019 & 2032
- Table 55: Rest of Europe Portable Transcutaneous Jaundice Meters Revenue (million) Forecast, by Application 2019 & 2032
- Table 56: Rest of Europe Portable Transcutaneous Jaundice Meters Volume (K) Forecast, by Application 2019 & 2032
- Table 57: Global Portable Transcutaneous Jaundice Meters Revenue million Forecast, by Application 2019 & 2032
- Table 58: Global Portable Transcutaneous Jaundice Meters Volume K Forecast, by Application 2019 & 2032
- Table 59: Global Portable Transcutaneous Jaundice Meters Revenue million Forecast, by Types 2019 & 2032
- Table 60: Global Portable Transcutaneous Jaundice Meters Volume K Forecast, by Types 2019 & 2032
- Table 61: Global Portable Transcutaneous Jaundice Meters Revenue million Forecast, by Country 2019 & 2032
- Table 62: Global Portable Transcutaneous Jaundice Meters Volume K Forecast, by Country 2019 & 2032
- Table 63: Turkey Portable Transcutaneous Jaundice Meters Revenue (million) Forecast, by Application 2019 & 2032
- Table 64: Turkey Portable Transcutaneous Jaundice Meters Volume (K) Forecast, by Application 2019 & 2032
- Table 65: Israel Portable Transcutaneous Jaundice Meters Revenue (million) Forecast, by Application 2019 & 2032
- Table 66: Israel Portable Transcutaneous Jaundice Meters Volume (K) Forecast, by Application 2019 & 2032
- Table 67: GCC Portable Transcutaneous Jaundice Meters Revenue (million) Forecast, by Application 2019 & 2032
- Table 68: GCC Portable Transcutaneous Jaundice Meters Volume (K) Forecast, by Application 2019 & 2032
- Table 69: North Africa Portable Transcutaneous Jaundice Meters Revenue (million) Forecast, by Application 2019 & 2032
- Table 70: North Africa Portable Transcutaneous Jaundice Meters Volume (K) Forecast, by Application 2019 & 2032
- Table 71: South Africa Portable Transcutaneous Jaundice Meters Revenue (million) Forecast, by Application 2019 & 2032
- Table 72: South Africa Portable Transcutaneous Jaundice Meters Volume (K) Forecast, by Application 2019 & 2032
- Table 73: Rest of Middle East & Africa Portable Transcutaneous Jaundice Meters Revenue (million) Forecast, by Application 2019 & 2032
- Table 74: Rest of Middle East & Africa Portable Transcutaneous Jaundice Meters Volume (K) Forecast, by Application 2019 & 2032
- Table 75: Global Portable Transcutaneous Jaundice Meters Revenue million Forecast, by Application 2019 & 2032
- Table 76: Global Portable Transcutaneous Jaundice Meters Volume K Forecast, by Application 2019 & 2032
- Table 77: Global Portable Transcutaneous Jaundice Meters Revenue million Forecast, by Types 2019 & 2032
- Table 78: Global Portable Transcutaneous Jaundice Meters Volume K Forecast, by Types 2019 & 2032
- Table 79: Global Portable Transcutaneous Jaundice Meters Revenue million Forecast, by Country 2019 & 2032
- Table 80: Global Portable Transcutaneous Jaundice Meters Volume K Forecast, by Country 2019 & 2032
- Table 81: China Portable Transcutaneous Jaundice Meters Revenue (million) Forecast, by Application 2019 & 2032
- Table 82: China Portable Transcutaneous Jaundice Meters Volume (K) Forecast, by Application 2019 & 2032
- Table 83: India Portable Transcutaneous Jaundice Meters Revenue (million) Forecast, by Application 2019 & 2032
- Table 84: India Portable Transcutaneous Jaundice Meters Volume (K) Forecast, by Application 2019 & 2032
- Table 85: Japan Portable Transcutaneous Jaundice Meters Revenue (million) Forecast, by Application 2019 & 2032
- Table 86: Japan Portable Transcutaneous Jaundice Meters Volume (K) Forecast, by Application 2019 & 2032
- Table 87: South Korea Portable Transcutaneous Jaundice Meters Revenue (million) Forecast, by Application 2019 & 2032
- Table 88: South Korea Portable Transcutaneous Jaundice Meters Volume (K) Forecast, by Application 2019 & 2032
- Table 89: ASEAN Portable Transcutaneous Jaundice Meters Revenue (million) Forecast, by Application 2019 & 2032
- Table 90: ASEAN Portable Transcutaneous Jaundice Meters Volume (K) Forecast, by Application 2019 & 2032
- Table 91: Oceania Portable Transcutaneous Jaundice Meters Revenue (million) Forecast, by Application 2019 & 2032
- Table 92: Oceania Portable Transcutaneous Jaundice Meters Volume (K) Forecast, by Application 2019 & 2032
- Table 93: Rest of Asia Pacific Portable Transcutaneous Jaundice Meters Revenue (million) Forecast, by Application 2019 & 2032
- Table 94: Rest of Asia Pacific Portable Transcutaneous Jaundice Meters Volume (K) Forecast, by Application 2019 & 2032
Frequently Asked Questions
1. What is the projected Compound Annual Growth Rate (CAGR) of the Portable Transcutaneous Jaundice Meters?
The projected CAGR is approximately 4%.
2. Which companies are prominent players in the Portable Transcutaneous Jaundice Meters?
Key companies in the market include Dräger, Delta Medical International, Philips, NEST360, Aegis Medicals, Natus Medical, Micro Lab, Heal Force, mbelec, Xuzhou Kejian Hi-tech, Refine Medical Technology, Zhengzhou Dison Instrument And Meter Co., Ltd..
3. What are the main segments of the Portable Transcutaneous Jaundice Meters?
The market segments include Application, Types.
4. Can you provide details about the market size?
The market size is estimated to be USD 269 million as of 2022.
5. What are some drivers contributing to market growth?
N/A
6. What are the notable trends driving market growth?
N/A
7. Are there any restraints impacting market growth?
N/A
8. Can you provide examples of recent developments in the market?
N/A
9. What pricing options are available for accessing the report?
Pricing options include single-user, multi-user, and enterprise licenses priced at USD 3350.00, USD 5025.00, and USD 6700.00 respectively.
10. Is the market size provided in terms of value or volume?
The market size is provided in terms of value, measured in million and volume, measured in K.
11. Are there any specific market keywords associated with the report?
Yes, the market keyword associated with the report is "Portable Transcutaneous Jaundice Meters," which aids in identifying and referencing the specific market segment covered.
12. How do I determine which pricing option suits my needs best?
The pricing options vary based on user requirements and access needs. Individual users may opt for single-user licenses, while businesses requiring broader access may choose multi-user or enterprise licenses for cost-effective access to the report.
13. Are there any additional resources or data provided in the Portable Transcutaneous Jaundice Meters report?
While the report offers comprehensive insights, it's advisable to review the specific contents or supplementary materials provided to ascertain if additional resources or data are available.
14. How can I stay updated on further developments or reports in the Portable Transcutaneous Jaundice Meters?
To stay informed about further developments, trends, and reports in the Portable Transcutaneous Jaundice Meters, consider subscribing to industry newsletters, following relevant companies and organizations, or regularly checking reputable industry news sources and publications.
Methodology
Step 1 - Identification of Relevant Samples Size from Population Database


Step 2 - Approaches for Defining Global Market Size (Value, Volume* & Price*)

Note*: In applicable scenarios
Step 3 - Data Sources
Primary Research
- Web Analytics
- Survey Reports
- Research Institute
- Latest Research Reports
- Opinion Leaders
Secondary Research
- Annual Reports
- White Paper
- Latest Press Release
- Industry Association
- Paid Database
- Investor Presentations

Step 4 - Data Triangulation
Involves using different sources of information in order to increase the validity of a study
These sources are likely to be stakeholders in a program - participants, other researchers, program staff, other community members, and so on.
Then we put all data in single framework & apply various statistical tools to find out the dynamic on the market.
During the analysis stage, feedback from the stakeholder groups would be compared to determine areas of agreement as well as areas of divergence


