
Key Insights
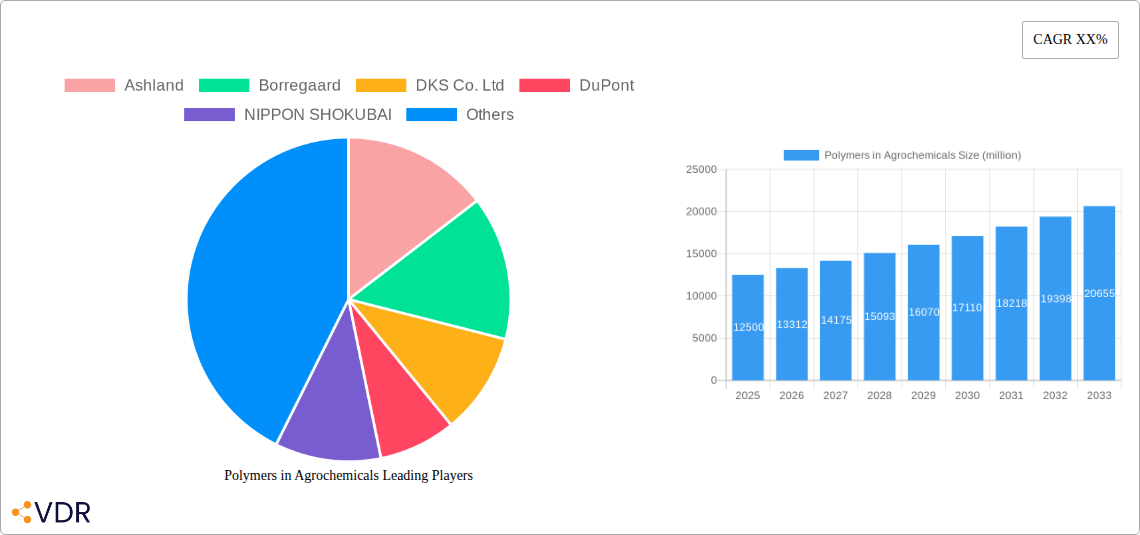
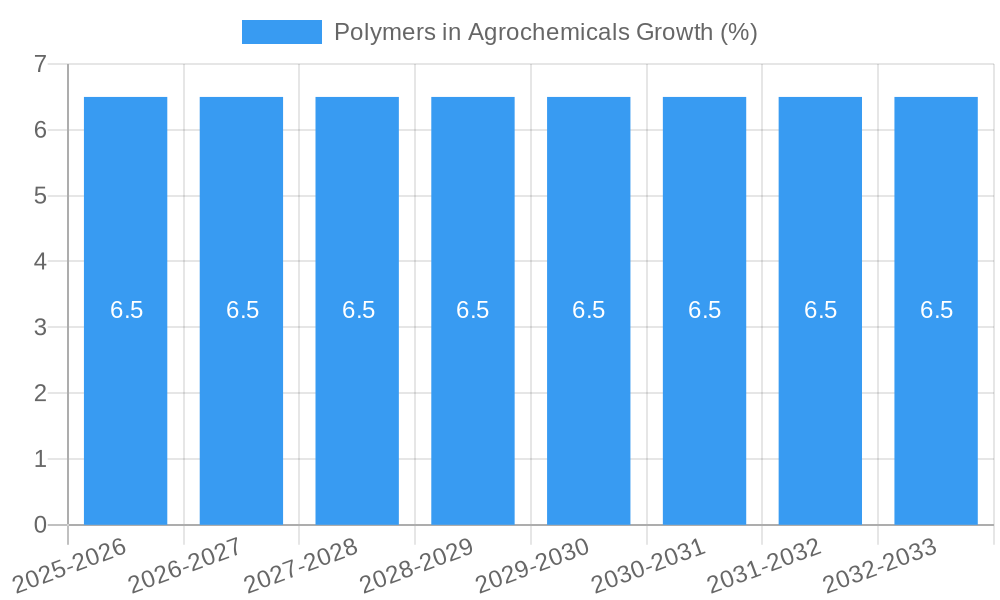
The global market for Polymers in Agrochemicals is poised for significant expansion, projected to reach approximately USD 12,500 million by 2025, and grow at a Compound Annual Growth Rate (CAGR) of around 6.5% over the forecast period. This robust growth is primarily driven by the increasing demand for enhanced crop yields, the need for efficient and targeted delivery of agrochemical formulations, and the rising adoption of sustainable agricultural practices. Polymers play a crucial role in improving the efficacy of pesticides, herbicides, and fertilizers through controlled release mechanisms, enhanced adhesion, and reduced environmental runoff. The Seed Coating segment, in particular, is a major contributor to market growth, offering protection to seeds, improving germination rates, and facilitating the precise application of beneficial microbes and nutrients. Soil Protection applications are also gaining traction, with polymers being utilized to improve soil structure, water retention, and nutrient availability, thereby contributing to improved soil health and reduced erosion.
Several key trends are shaping the Polymers in Agrochemicals landscape. The development of biodegradable and bio-based polymers is a significant focus, addressing environmental concerns associated with traditional synthetic polymers and aligning with the global push towards sustainable agriculture. Advanced formulation technologies, such as microencapsulation and nano-delivery systems, are enabling more precise and effective delivery of active ingredients, leading to reduced chemical usage and environmental impact. The market is also witnessing a rise in customized polymer solutions tailored to specific crop types, soil conditions, and climatic variations. However, the market faces certain restraints, including the high cost of some advanced polymer materials, stringent regulatory frameworks concerning the use of chemicals in agriculture, and the need for greater farmer education and adoption of new technologies. Despite these challenges, the continuous innovation in polymer science and the increasing awareness of its benefits in modern agriculture are expected to fuel sustained market growth.
Polymers in Agrochemicals Market Report: Unlocking Sustainable Agriculture's Future
This comprehensive report delves into the dynamic Polymers in Agrochemicals Market, a critical enabler of modern agricultural practices and sustainable food production. Explore the intricate market structure, growth trajectory, and key influencers shaping this essential sector. With a study period spanning 2019–2033, a base and estimated year of 2025, and a forecast period of 2025–2033, this report provides unparalleled insights into historical trends and future potential. Discover how advanced polymers are revolutionizing seed coatings, soil protection, and other vital agrochemical applications, driving efficiency, yield, and environmental stewardship.
Polymers in Agrochemicals Market Dynamics & Structure
The Polymers in Agrochemicals Market is characterized by a moderate to high concentration, with several key global players dominating production and innovation. Technological innovation remains a primary driver, particularly in the development of biodegradable and controlled-release polymer formulations that enhance active ingredient efficacy and reduce environmental impact. Regulatory frameworks, though evolving, are increasingly stringent, pushing for safer and more sustainable agrochemical solutions. Competitive product substitutes, primarily traditional inert ingredients, are gradually being phased out in favor of advanced polymer-based systems that offer superior performance. End-user demographics are shifting towards larger, more technologically adept agricultural enterprises seeking to optimize resource utilization and crop yields. Mergers and acquisitions (M&A) activity is present, driven by companies seeking to expand their product portfolios, gain market share, and secure advanced polymer technologies.
- Market Concentration: Dominated by a mix of large multinational chemical corporations and specialized polymer manufacturers.
- Technological Innovation Drivers: Focus on biodegradability, controlled release, encapsulation, and enhanced efficacy of agrochemical actives.
- Regulatory Frameworks: Increasing emphasis on environmental safety, reduced chemical runoff, and improved biodegradability of polymer components.
- Competitive Product Substitutes: Traditional inert ingredients and less advanced formulation techniques.
- End-User Demographics: Growing adoption by large-scale commercial farms and integrated agricultural management systems.
- M&A Trends: Strategic acquisitions to strengthen R&D capabilities and expand geographical reach.
Polymers in Agrochemicals Growth Trends & Insights
The Polymers in Agrochemicals Market is poised for significant expansion, driven by the global imperative for enhanced food security and sustainable agricultural practices. Market size is projected to experience a robust Compound Annual Growth Rate (CAGR) of XX% from 2025 to 2033, reaching an estimated value of $XX million by the end of the forecast period. Adoption rates for polymer-enhanced agrochemicals are accelerating as farmers recognize their benefits in improving nutrient use efficiency, pest control, and crop resilience. Technological disruptions, such as the development of smart polymer coatings that respond to environmental cues, are further fueling growth. Consumer behavior shifts towards organically grown produce and reduced pesticide residues are indirectly boosting the demand for advanced formulation technologies that enable precise and targeted delivery of agrochemicals. The parent market for polymers in agrochemicals, encompassing raw material production and downstream processing, is valued at approximately $XX million in the base year 2025, with the agrochemical application segment representing a substantial child market of $XX million, expected to grow at XX% CAGR.
Dominant Regions, Countries, or Segments in Polymers in Agrochemicals
The Seed Coating segment, within the Application category, is currently the dominant force driving growth in the Polymers in Agrochemicals Market. This segment is projected to maintain its lead throughout the forecast period, holding an estimated market share of XX% in 2025, valued at $XX million. The burgeoning demand for high-performance seed treatments that enhance germination rates, protect against early-stage pests and diseases, and improve seedling vigor is a primary catalyst. The implementation of advanced seed coating technologies, which utilize polymers like Polyvinylpyrrolidone (PVP) and its derivatives, Cellulose Ethers (CMC, HEC, HPMC, HMHEC, MC, HPC), and Ethacel (EC), allows for precise application of active ingredients, reducing the overall chemical load on the environment. Economic policies supporting precision agriculture and sustainable farming practices in key regions like North America and Europe are further stimulating the adoption of seed coating technologies. The presence of a strong R&D infrastructure and major agrochemical manufacturers in these regions also contributes to the segment's dominance.
- Dominant Segment: Seed Coating (Application)
- Key Drivers for Seed Coating Dominance:
- Increased demand for enhanced germination and seedling establishment.
- Precise delivery of active ingredients for pest and disease control.
- Reduction in overall agrochemical usage.
- Supportive economic policies for sustainable agriculture.
- Leading Regions: North America and Europe due to advanced agricultural practices and regulatory support.
- Key Polymer Types in Seed Coating: PVP and Derivates, CMC, HEC, HPMC.
- Market Share (2025): Seed Coating segment expected to capture XX% of the total market.
- Growth Potential: High, driven by continuous innovation in polymer functionalities for seed treatment.
Polymers in Agrochemicals Product Landscape
The product landscape of Polymers in Agrochemicals is marked by continuous innovation, focusing on enhancing the efficacy, safety, and environmental profile of agricultural formulations. Key product developments revolve around advanced encapsulation technologies that enable controlled release of active ingredients, thereby optimizing their delivery and minimizing environmental exposure. Polymers like PVP and its derivatives, carboxymethylcellulose (CMC), hydroxyethylcellulose (HEC), hydroxypropyl methylcellulose (HPMC), and others are instrumental in forming protective barriers around agrochemical actives. These innovations lead to extended efficacy, reduced application frequency, and improved crop protection. For instance, specialized HPMC grades are engineered for superior film-forming properties in seed coatings, while certain PVP derivatives offer enhanced dispersibility and suspension in foliar sprays. The unique selling propositions lie in their biodegradability, low toxicity, and ability to improve the performance of both conventional and biopesticides.
Key Drivers, Barriers & Challenges in Polymers in Agrochemicals
The Polymers in Agrochemicals Market is propelled by several key drivers. Technological advancements in polymer science, leading to biodegradable and controlled-release formulations, are paramount. The increasing global demand for food production, coupled with the need for sustainable agricultural practices, directly fuels market growth. Furthermore, stricter environmental regulations worldwide are incentivizing the adoption of safer and more eco-friendly agrochemical solutions.
- Key Drivers:
- Innovation in biodegradable and controlled-release polymer technologies.
- Growing global food demand and sustainable agriculture initiatives.
- Stringent environmental regulations promoting safer agrochemicals.
Conversely, the market faces significant barriers and challenges. High research and development costs associated with novel polymer formulations can hinder smaller players. Supply chain disruptions and the volatility of raw material prices can impact production costs and availability. Regulatory approval processes for new polymer-based agrochemicals can be lengthy and complex, delaying market entry. Lastly, the market faces intense competition from established conventional agrochemical formulations and the inertia of some traditional farming practices.
- Key Barriers & Challenges:
- High R&D investment and lengthy regulatory approval cycles.
- Supply chain volatility and fluctuating raw material prices (e.g., petrochemical derivatives).
- Competition from established conventional agrochemical products.
- Farmer adoption hesitancy due to cost or unfamiliarity.
Emerging Opportunities in Polymers in Agrochemicals
Emerging opportunities in the Polymers in Agrochemicals Market lie in the development of smart polymers that respond to specific environmental cues, such as soil moisture or pest presence, enabling highly targeted delivery of agrochemicals. The growing segment of biopesticides and biofertilizers presents a significant opportunity for polymer encapsulation technologies that enhance their stability and efficacy. Untapped markets in developing economies with increasing agricultural mechanization and a growing focus on crop yield improvement also offer substantial potential. Furthermore, the demand for polymers that can facilitate nutrient delivery and soil conditioning, contributing to soil health and carbon sequestration, is a nascent but promising area.
Growth Accelerators in the Polymers in Agrochemicals Industry
Growth accelerators in the Polymers in Agrochemicals Industry are primarily driven by ongoing technological breakthroughs in polymer science and engineering. The development of novel, cost-effective, and highly functional polymers that offer superior biodegradability and controlled-release properties will be a key catalyst. Strategic partnerships between polymer manufacturers and agrochemical companies are crucial for co-developing and commercializing innovative solutions. Market expansion strategies, particularly targeting regions with rapidly growing agricultural sectors and increasing adoption of modern farming techniques, will further propel growth. The integration of digital technologies and AI in precision agriculture will also create demand for smart polymer formulations that can optimize resource application.
Key Players Shaping the Polymers in Agrochemicals Market
- Ashland
- Borregaard
- DKS Co. Ltd
- DuPont
- NIPPON SHOKUBAI
- Dow Chemical Company
- SE Tylose GmbH & Co. KG
- Shin-Etsu
- Daicel Miraizu Ltd
- Lotte Fine Chemical Co.,Ltd
- Tai'an Ruitai
- Zhangzhou Huafu Chemical
- Shanghai Yuking Water Soluble Material
- Star-Tech Specialty Products Co.,Ltd.
- Jiaozuo Zhongwei Special Products Pharmaceutical
- Xuzhou Liyuan
Notable Milestones in Polymers in Agrochemicals Sector
- 2019: Increased research and development investment in biodegradable polymers for agricultural applications.
- 2020: Introduction of advanced encapsulated biopesticides using novel polymer matrices.
- 2021: Growing adoption of polymer-based seed coatings in major agricultural economies.
- 2022: Key companies focusing on sustainable sourcing of raw materials for polymer production.
- 2023: Launch of new polymer formulations designed for improved water retention in arid agricultural regions.
- 2024: Enhanced focus on circular economy principles in polymer production for agrochemicals.
In-Depth Polymers in Agrochemicals Market Outlook
The future outlook for the Polymers in Agrochemicals Market is exceptionally promising, driven by an intensifying global focus on sustainable agriculture and food security. Growth accelerators will stem from continued innovation in biodegradable polymers, smart delivery systems, and the increasing integration of these advanced materials with biopesticides and biofertilizers. Strategic alliances and the expansion into emerging agricultural economies will unlock significant market potential. The market is set to witness a paradigm shift towards highly efficient, environmentally responsible agrochemical solutions, solidifying the indispensable role of polymers in shaping the future of agriculture.
Polymers in Agrochemicals Segmentation
-
1. Application
- 1.1. Seed Coating
- 1.2. Soil Protection
- 1.3. Others
-
2. Types
- 2.1. PVP and Derivates
- 2.2. CMC
- 2.3. HEC
- 2.4. HPMC
- 2.5. HMHEC
- 2.6. MC
- 2.7. HPC
- 2.8. EC
- 2.9. Others
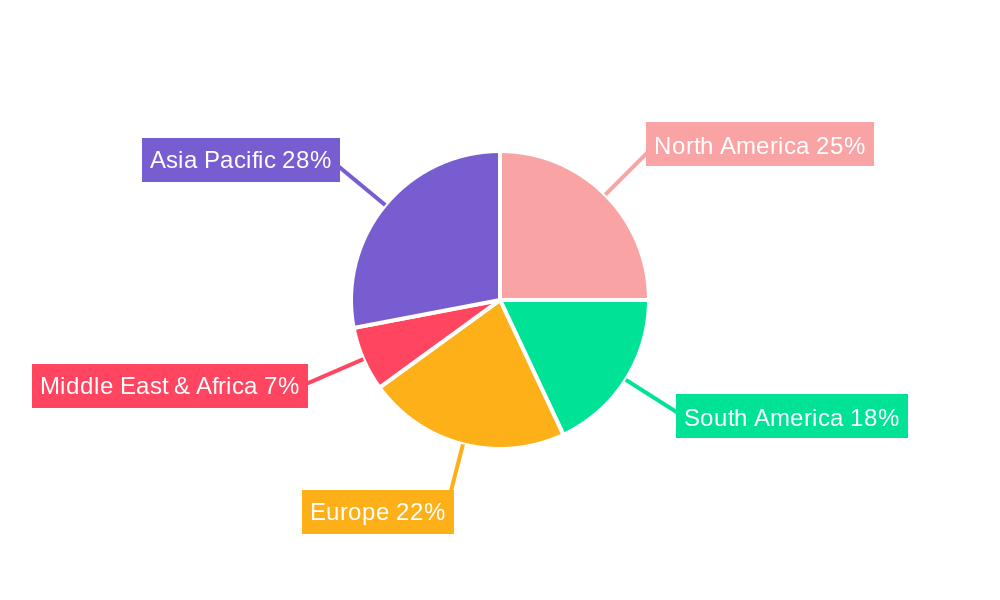
Polymers in Agrochemicals Segmentation By Geography
-
1. North America
- 1.1. United States
- 1.2. Canada
- 1.3. Mexico
-
2. South America
- 2.1. Brazil
- 2.2. Argentina
- 2.3. Rest of South America
-
3. Europe
- 3.1. United Kingdom
- 3.2. Germany
- 3.3. France
- 3.4. Italy
- 3.5. Spain
- 3.6. Russia
- 3.7. Benelux
- 3.8. Nordics
- 3.9. Rest of Europe
-
4. Middle East & Africa
- 4.1. Turkey
- 4.2. Israel
- 4.3. GCC
- 4.4. North Africa
- 4.5. South Africa
- 4.6. Rest of Middle East & Africa
-
5. Asia Pacific
- 5.1. China
- 5.2. India
- 5.3. Japan
- 5.4. South Korea
- 5.5. ASEAN
- 5.6. Oceania
- 5.7. Rest of Asia Pacific
Polymers in Agrochemicals REPORT HIGHLIGHTS
| Aspects | Details |
|---|---|
| Study Period | 2019-2033 |
| Base Year | 2024 |
| Estimated Year | 2025 |
| Forecast Period | 2025-2033 |
| Historical Period | 2019-2024 |
| Growth Rate | CAGR of XX% from 2019-2033 |
| Segmentation |
|
Table of Contents
- 1. Introduction
- 1.1. Research Scope
- 1.2. Market Segmentation
- 1.3. Research Methodology
- 1.4. Definitions and Assumptions
- 2. Executive Summary
- 2.1. Introduction
- 3. Market Dynamics
- 3.1. Introduction
- 3.2. Market Drivers
- 3.3. Market Restrains
- 3.4. Market Trends
- 4. Market Factor Analysis
- 4.1. Porters Five Forces
- 4.2. Supply/Value Chain
- 4.3. PESTEL analysis
- 4.4. Market Entropy
- 4.5. Patent/Trademark Analysis
- 5. Global Polymers in Agrochemicals Analysis, Insights and Forecast, 2019-2031
- 5.1. Market Analysis, Insights and Forecast - by Application
- 5.1.1. Seed Coating
- 5.1.2. Soil Protection
- 5.1.3. Others
- 5.2. Market Analysis, Insights and Forecast - by Types
- 5.2.1. PVP and Derivates
- 5.2.2. CMC
- 5.2.3. HEC
- 5.2.4. HPMC
- 5.2.5. HMHEC
- 5.2.6. MC
- 5.2.7. HPC
- 5.2.8. EC
- 5.2.9. Others
- 5.3. Market Analysis, Insights and Forecast - by Region
- 5.3.1. North America
- 5.3.2. South America
- 5.3.3. Europe
- 5.3.4. Middle East & Africa
- 5.3.5. Asia Pacific
- 5.1. Market Analysis, Insights and Forecast - by Application
- 6. North America Polymers in Agrochemicals Analysis, Insights and Forecast, 2019-2031
- 6.1. Market Analysis, Insights and Forecast - by Application
- 6.1.1. Seed Coating
- 6.1.2. Soil Protection
- 6.1.3. Others
- 6.2. Market Analysis, Insights and Forecast - by Types
- 6.2.1. PVP and Derivates
- 6.2.2. CMC
- 6.2.3. HEC
- 6.2.4. HPMC
- 6.2.5. HMHEC
- 6.2.6. MC
- 6.2.7. HPC
- 6.2.8. EC
- 6.2.9. Others
- 6.1. Market Analysis, Insights and Forecast - by Application
- 7. South America Polymers in Agrochemicals Analysis, Insights and Forecast, 2019-2031
- 7.1. Market Analysis, Insights and Forecast - by Application
- 7.1.1. Seed Coating
- 7.1.2. Soil Protection
- 7.1.3. Others
- 7.2. Market Analysis, Insights and Forecast - by Types
- 7.2.1. PVP and Derivates
- 7.2.2. CMC
- 7.2.3. HEC
- 7.2.4. HPMC
- 7.2.5. HMHEC
- 7.2.6. MC
- 7.2.7. HPC
- 7.2.8. EC
- 7.2.9. Others
- 7.1. Market Analysis, Insights and Forecast - by Application
- 8. Europe Polymers in Agrochemicals Analysis, Insights and Forecast, 2019-2031
- 8.1. Market Analysis, Insights and Forecast - by Application
- 8.1.1. Seed Coating
- 8.1.2. Soil Protection
- 8.1.3. Others
- 8.2. Market Analysis, Insights and Forecast - by Types
- 8.2.1. PVP and Derivates
- 8.2.2. CMC
- 8.2.3. HEC
- 8.2.4. HPMC
- 8.2.5. HMHEC
- 8.2.6. MC
- 8.2.7. HPC
- 8.2.8. EC
- 8.2.9. Others
- 8.1. Market Analysis, Insights and Forecast - by Application
- 9. Middle East & Africa Polymers in Agrochemicals Analysis, Insights and Forecast, 2019-2031
- 9.1. Market Analysis, Insights and Forecast - by Application
- 9.1.1. Seed Coating
- 9.1.2. Soil Protection
- 9.1.3. Others
- 9.2. Market Analysis, Insights and Forecast - by Types
- 9.2.1. PVP and Derivates
- 9.2.2. CMC
- 9.2.3. HEC
- 9.2.4. HPMC
- 9.2.5. HMHEC
- 9.2.6. MC
- 9.2.7. HPC
- 9.2.8. EC
- 9.2.9. Others
- 9.1. Market Analysis, Insights and Forecast - by Application
- 10. Asia Pacific Polymers in Agrochemicals Analysis, Insights and Forecast, 2019-2031
- 10.1. Market Analysis, Insights and Forecast - by Application
- 10.1.1. Seed Coating
- 10.1.2. Soil Protection
- 10.1.3. Others
- 10.2. Market Analysis, Insights and Forecast - by Types
- 10.2.1. PVP and Derivates
- 10.2.2. CMC
- 10.2.3. HEC
- 10.2.4. HPMC
- 10.2.5. HMHEC
- 10.2.6. MC
- 10.2.7. HPC
- 10.2.8. EC
- 10.2.9. Others
- 10.1. Market Analysis, Insights and Forecast - by Application
- 11. Competitive Analysis
- 11.1. Global Market Share Analysis 2024
- 11.2. Company Profiles
- 11.2.1 Ashland
- 11.2.1.1. Overview
- 11.2.1.2. Products
- 11.2.1.3. SWOT Analysis
- 11.2.1.4. Recent Developments
- 11.2.1.5. Financials (Based on Availability)
- 11.2.2 Borregaard
- 11.2.2.1. Overview
- 11.2.2.2. Products
- 11.2.2.3. SWOT Analysis
- 11.2.2.4. Recent Developments
- 11.2.2.5. Financials (Based on Availability)
- 11.2.3 DKS Co. Ltd
- 11.2.3.1. Overview
- 11.2.3.2. Products
- 11.2.3.3. SWOT Analysis
- 11.2.3.4. Recent Developments
- 11.2.3.5. Financials (Based on Availability)
- 11.2.4 DuPont
- 11.2.4.1. Overview
- 11.2.4.2. Products
- 11.2.4.3. SWOT Analysis
- 11.2.4.4. Recent Developments
- 11.2.4.5. Financials (Based on Availability)
- 11.2.5 NIPPON SHOKUBAI
- 11.2.5.1. Overview
- 11.2.5.2. Products
- 11.2.5.3. SWOT Analysis
- 11.2.5.4. Recent Developments
- 11.2.5.5. Financials (Based on Availability)
- 11.2.6 Dow Chemical Company
- 11.2.6.1. Overview
- 11.2.6.2. Products
- 11.2.6.3. SWOT Analysis
- 11.2.6.4. Recent Developments
- 11.2.6.5. Financials (Based on Availability)
- 11.2.7 SE Tylose GmbH & Co. KG
- 11.2.7.1. Overview
- 11.2.7.2. Products
- 11.2.7.3. SWOT Analysis
- 11.2.7.4. Recent Developments
- 11.2.7.5. Financials (Based on Availability)
- 11.2.8 Shin-Etsu
- 11.2.8.1. Overview
- 11.2.8.2. Products
- 11.2.8.3. SWOT Analysis
- 11.2.8.4. Recent Developments
- 11.2.8.5. Financials (Based on Availability)
- 11.2.9 Daicel Miraizu Ltd
- 11.2.9.1. Overview
- 11.2.9.2. Products
- 11.2.9.3. SWOT Analysis
- 11.2.9.4. Recent Developments
- 11.2.9.5. Financials (Based on Availability)
- 11.2.10 Lotte Fine Chemical Co.
- 11.2.10.1. Overview
- 11.2.10.2. Products
- 11.2.10.3. SWOT Analysis
- 11.2.10.4. Recent Developments
- 11.2.10.5. Financials (Based on Availability)
- 11.2.11 Ltd
- 11.2.11.1. Overview
- 11.2.11.2. Products
- 11.2.11.3. SWOT Analysis
- 11.2.11.4. Recent Developments
- 11.2.11.5. Financials (Based on Availability)
- 11.2.12 Tai'an Ruitai
- 11.2.12.1. Overview
- 11.2.12.2. Products
- 11.2.12.3. SWOT Analysis
- 11.2.12.4. Recent Developments
- 11.2.12.5. Financials (Based on Availability)
- 11.2.13 Zhangzhou Huafu Chemical
- 11.2.13.1. Overview
- 11.2.13.2. Products
- 11.2.13.3. SWOT Analysis
- 11.2.13.4. Recent Developments
- 11.2.13.5. Financials (Based on Availability)
- 11.2.14 Shanghai Yuking Water Soluble Material
- 11.2.14.1. Overview
- 11.2.14.2. Products
- 11.2.14.3. SWOT Analysis
- 11.2.14.4. Recent Developments
- 11.2.14.5. Financials (Based on Availability)
- 11.2.15 Star-Tech Specialty Products Co.
- 11.2.15.1. Overview
- 11.2.15.2. Products
- 11.2.15.3. SWOT Analysis
- 11.2.15.4. Recent Developments
- 11.2.15.5. Financials (Based on Availability)
- 11.2.16 Ltd.
- 11.2.16.1. Overview
- 11.2.16.2. Products
- 11.2.16.3. SWOT Analysis
- 11.2.16.4. Recent Developments
- 11.2.16.5. Financials (Based on Availability)
- 11.2.17 Jiaozuo Zhongwei Special Products Pharmaceutical
- 11.2.17.1. Overview
- 11.2.17.2. Products
- 11.2.17.3. SWOT Analysis
- 11.2.17.4. Recent Developments
- 11.2.17.5. Financials (Based on Availability)
- 11.2.18 Xuzhou Liyuan
- 11.2.18.1. Overview
- 11.2.18.2. Products
- 11.2.18.3. SWOT Analysis
- 11.2.18.4. Recent Developments
- 11.2.18.5. Financials (Based on Availability)
- 11.2.1 Ashland
List of Figures
- Figure 1: Global Polymers in Agrochemicals Revenue Breakdown (million, %) by Region 2024 & 2032
- Figure 2: Global Polymers in Agrochemicals Volume Breakdown (K, %) by Region 2024 & 2032
- Figure 3: North America Polymers in Agrochemicals Revenue (million), by Application 2024 & 2032
- Figure 4: North America Polymers in Agrochemicals Volume (K), by Application 2024 & 2032
- Figure 5: North America Polymers in Agrochemicals Revenue Share (%), by Application 2024 & 2032
- Figure 6: North America Polymers in Agrochemicals Volume Share (%), by Application 2024 & 2032
- Figure 7: North America Polymers in Agrochemicals Revenue (million), by Types 2024 & 2032
- Figure 8: North America Polymers in Agrochemicals Volume (K), by Types 2024 & 2032
- Figure 9: North America Polymers in Agrochemicals Revenue Share (%), by Types 2024 & 2032
- Figure 10: North America Polymers in Agrochemicals Volume Share (%), by Types 2024 & 2032
- Figure 11: North America Polymers in Agrochemicals Revenue (million), by Country 2024 & 2032
- Figure 12: North America Polymers in Agrochemicals Volume (K), by Country 2024 & 2032
- Figure 13: North America Polymers in Agrochemicals Revenue Share (%), by Country 2024 & 2032
- Figure 14: North America Polymers in Agrochemicals Volume Share (%), by Country 2024 & 2032
- Figure 15: South America Polymers in Agrochemicals Revenue (million), by Application 2024 & 2032
- Figure 16: South America Polymers in Agrochemicals Volume (K), by Application 2024 & 2032
- Figure 17: South America Polymers in Agrochemicals Revenue Share (%), by Application 2024 & 2032
- Figure 18: South America Polymers in Agrochemicals Volume Share (%), by Application 2024 & 2032
- Figure 19: South America Polymers in Agrochemicals Revenue (million), by Types 2024 & 2032
- Figure 20: South America Polymers in Agrochemicals Volume (K), by Types 2024 & 2032
- Figure 21: South America Polymers in Agrochemicals Revenue Share (%), by Types 2024 & 2032
- Figure 22: South America Polymers in Agrochemicals Volume Share (%), by Types 2024 & 2032
- Figure 23: South America Polymers in Agrochemicals Revenue (million), by Country 2024 & 2032
- Figure 24: South America Polymers in Agrochemicals Volume (K), by Country 2024 & 2032
- Figure 25: South America Polymers in Agrochemicals Revenue Share (%), by Country 2024 & 2032
- Figure 26: South America Polymers in Agrochemicals Volume Share (%), by Country 2024 & 2032
- Figure 27: Europe Polymers in Agrochemicals Revenue (million), by Application 2024 & 2032
- Figure 28: Europe Polymers in Agrochemicals Volume (K), by Application 2024 & 2032
- Figure 29: Europe Polymers in Agrochemicals Revenue Share (%), by Application 2024 & 2032
- Figure 30: Europe Polymers in Agrochemicals Volume Share (%), by Application 2024 & 2032
- Figure 31: Europe Polymers in Agrochemicals Revenue (million), by Types 2024 & 2032
- Figure 32: Europe Polymers in Agrochemicals Volume (K), by Types 2024 & 2032
- Figure 33: Europe Polymers in Agrochemicals Revenue Share (%), by Types 2024 & 2032
- Figure 34: Europe Polymers in Agrochemicals Volume Share (%), by Types 2024 & 2032
- Figure 35: Europe Polymers in Agrochemicals Revenue (million), by Country 2024 & 2032
- Figure 36: Europe Polymers in Agrochemicals Volume (K), by Country 2024 & 2032
- Figure 37: Europe Polymers in Agrochemicals Revenue Share (%), by Country 2024 & 2032
- Figure 38: Europe Polymers in Agrochemicals Volume Share (%), by Country 2024 & 2032
- Figure 39: Middle East & Africa Polymers in Agrochemicals Revenue (million), by Application 2024 & 2032
- Figure 40: Middle East & Africa Polymers in Agrochemicals Volume (K), by Application 2024 & 2032
- Figure 41: Middle East & Africa Polymers in Agrochemicals Revenue Share (%), by Application 2024 & 2032
- Figure 42: Middle East & Africa Polymers in Agrochemicals Volume Share (%), by Application 2024 & 2032
- Figure 43: Middle East & Africa Polymers in Agrochemicals Revenue (million), by Types 2024 & 2032
- Figure 44: Middle East & Africa Polymers in Agrochemicals Volume (K), by Types 2024 & 2032
- Figure 45: Middle East & Africa Polymers in Agrochemicals Revenue Share (%), by Types 2024 & 2032
- Figure 46: Middle East & Africa Polymers in Agrochemicals Volume Share (%), by Types 2024 & 2032
- Figure 47: Middle East & Africa Polymers in Agrochemicals Revenue (million), by Country 2024 & 2032
- Figure 48: Middle East & Africa Polymers in Agrochemicals Volume (K), by Country 2024 & 2032
- Figure 49: Middle East & Africa Polymers in Agrochemicals Revenue Share (%), by Country 2024 & 2032
- Figure 50: Middle East & Africa Polymers in Agrochemicals Volume Share (%), by Country 2024 & 2032
- Figure 51: Asia Pacific Polymers in Agrochemicals Revenue (million), by Application 2024 & 2032
- Figure 52: Asia Pacific Polymers in Agrochemicals Volume (K), by Application 2024 & 2032
- Figure 53: Asia Pacific Polymers in Agrochemicals Revenue Share (%), by Application 2024 & 2032
- Figure 54: Asia Pacific Polymers in Agrochemicals Volume Share (%), by Application 2024 & 2032
- Figure 55: Asia Pacific Polymers in Agrochemicals Revenue (million), by Types 2024 & 2032
- Figure 56: Asia Pacific Polymers in Agrochemicals Volume (K), by Types 2024 & 2032
- Figure 57: Asia Pacific Polymers in Agrochemicals Revenue Share (%), by Types 2024 & 2032
- Figure 58: Asia Pacific Polymers in Agrochemicals Volume Share (%), by Types 2024 & 2032
- Figure 59: Asia Pacific Polymers in Agrochemicals Revenue (million), by Country 2024 & 2032
- Figure 60: Asia Pacific Polymers in Agrochemicals Volume (K), by Country 2024 & 2032
- Figure 61: Asia Pacific Polymers in Agrochemicals Revenue Share (%), by Country 2024 & 2032
- Figure 62: Asia Pacific Polymers in Agrochemicals Volume Share (%), by Country 2024 & 2032
List of Tables
- Table 1: Global Polymers in Agrochemicals Revenue million Forecast, by Region 2019 & 2032
- Table 2: Global Polymers in Agrochemicals Volume K Forecast, by Region 2019 & 2032
- Table 3: Global Polymers in Agrochemicals Revenue million Forecast, by Application 2019 & 2032
- Table 4: Global Polymers in Agrochemicals Volume K Forecast, by Application 2019 & 2032
- Table 5: Global Polymers in Agrochemicals Revenue million Forecast, by Types 2019 & 2032
- Table 6: Global Polymers in Agrochemicals Volume K Forecast, by Types 2019 & 2032
- Table 7: Global Polymers in Agrochemicals Revenue million Forecast, by Region 2019 & 2032
- Table 8: Global Polymers in Agrochemicals Volume K Forecast, by Region 2019 & 2032
- Table 9: Global Polymers in Agrochemicals Revenue million Forecast, by Application 2019 & 2032
- Table 10: Global Polymers in Agrochemicals Volume K Forecast, by Application 2019 & 2032
- Table 11: Global Polymers in Agrochemicals Revenue million Forecast, by Types 2019 & 2032
- Table 12: Global Polymers in Agrochemicals Volume K Forecast, by Types 2019 & 2032
- Table 13: Global Polymers in Agrochemicals Revenue million Forecast, by Country 2019 & 2032
- Table 14: Global Polymers in Agrochemicals Volume K Forecast, by Country 2019 & 2032
- Table 15: United States Polymers in Agrochemicals Revenue (million) Forecast, by Application 2019 & 2032
- Table 16: United States Polymers in Agrochemicals Volume (K) Forecast, by Application 2019 & 2032
- Table 17: Canada Polymers in Agrochemicals Revenue (million) Forecast, by Application 2019 & 2032
- Table 18: Canada Polymers in Agrochemicals Volume (K) Forecast, by Application 2019 & 2032
- Table 19: Mexico Polymers in Agrochemicals Revenue (million) Forecast, by Application 2019 & 2032
- Table 20: Mexico Polymers in Agrochemicals Volume (K) Forecast, by Application 2019 & 2032
- Table 21: Global Polymers in Agrochemicals Revenue million Forecast, by Application 2019 & 2032
- Table 22: Global Polymers in Agrochemicals Volume K Forecast, by Application 2019 & 2032
- Table 23: Global Polymers in Agrochemicals Revenue million Forecast, by Types 2019 & 2032
- Table 24: Global Polymers in Agrochemicals Volume K Forecast, by Types 2019 & 2032
- Table 25: Global Polymers in Agrochemicals Revenue million Forecast, by Country 2019 & 2032
- Table 26: Global Polymers in Agrochemicals Volume K Forecast, by Country 2019 & 2032
- Table 27: Brazil Polymers in Agrochemicals Revenue (million) Forecast, by Application 2019 & 2032
- Table 28: Brazil Polymers in Agrochemicals Volume (K) Forecast, by Application 2019 & 2032
- Table 29: Argentina Polymers in Agrochemicals Revenue (million) Forecast, by Application 2019 & 2032
- Table 30: Argentina Polymers in Agrochemicals Volume (K) Forecast, by Application 2019 & 2032
- Table 31: Rest of South America Polymers in Agrochemicals Revenue (million) Forecast, by Application 2019 & 2032
- Table 32: Rest of South America Polymers in Agrochemicals Volume (K) Forecast, by Application 2019 & 2032
- Table 33: Global Polymers in Agrochemicals Revenue million Forecast, by Application 2019 & 2032
- Table 34: Global Polymers in Agrochemicals Volume K Forecast, by Application 2019 & 2032
- Table 35: Global Polymers in Agrochemicals Revenue million Forecast, by Types 2019 & 2032
- Table 36: Global Polymers in Agrochemicals Volume K Forecast, by Types 2019 & 2032
- Table 37: Global Polymers in Agrochemicals Revenue million Forecast, by Country 2019 & 2032
- Table 38: Global Polymers in Agrochemicals Volume K Forecast, by Country 2019 & 2032
- Table 39: United Kingdom Polymers in Agrochemicals Revenue (million) Forecast, by Application 2019 & 2032
- Table 40: United Kingdom Polymers in Agrochemicals Volume (K) Forecast, by Application 2019 & 2032
- Table 41: Germany Polymers in Agrochemicals Revenue (million) Forecast, by Application 2019 & 2032
- Table 42: Germany Polymers in Agrochemicals Volume (K) Forecast, by Application 2019 & 2032
- Table 43: France Polymers in Agrochemicals Revenue (million) Forecast, by Application 2019 & 2032
- Table 44: France Polymers in Agrochemicals Volume (K) Forecast, by Application 2019 & 2032
- Table 45: Italy Polymers in Agrochemicals Revenue (million) Forecast, by Application 2019 & 2032
- Table 46: Italy Polymers in Agrochemicals Volume (K) Forecast, by Application 2019 & 2032
- Table 47: Spain Polymers in Agrochemicals Revenue (million) Forecast, by Application 2019 & 2032
- Table 48: Spain Polymers in Agrochemicals Volume (K) Forecast, by Application 2019 & 2032
- Table 49: Russia Polymers in Agrochemicals Revenue (million) Forecast, by Application 2019 & 2032
- Table 50: Russia Polymers in Agrochemicals Volume (K) Forecast, by Application 2019 & 2032
- Table 51: Benelux Polymers in Agrochemicals Revenue (million) Forecast, by Application 2019 & 2032
- Table 52: Benelux Polymers in Agrochemicals Volume (K) Forecast, by Application 2019 & 2032
- Table 53: Nordics Polymers in Agrochemicals Revenue (million) Forecast, by Application 2019 & 2032
- Table 54: Nordics Polymers in Agrochemicals Volume (K) Forecast, by Application 2019 & 2032
- Table 55: Rest of Europe Polymers in Agrochemicals Revenue (million) Forecast, by Application 2019 & 2032
- Table 56: Rest of Europe Polymers in Agrochemicals Volume (K) Forecast, by Application 2019 & 2032
- Table 57: Global Polymers in Agrochemicals Revenue million Forecast, by Application 2019 & 2032
- Table 58: Global Polymers in Agrochemicals Volume K Forecast, by Application 2019 & 2032
- Table 59: Global Polymers in Agrochemicals Revenue million Forecast, by Types 2019 & 2032
- Table 60: Global Polymers in Agrochemicals Volume K Forecast, by Types 2019 & 2032
- Table 61: Global Polymers in Agrochemicals Revenue million Forecast, by Country 2019 & 2032
- Table 62: Global Polymers in Agrochemicals Volume K Forecast, by Country 2019 & 2032
- Table 63: Turkey Polymers in Agrochemicals Revenue (million) Forecast, by Application 2019 & 2032
- Table 64: Turkey Polymers in Agrochemicals Volume (K) Forecast, by Application 2019 & 2032
- Table 65: Israel Polymers in Agrochemicals Revenue (million) Forecast, by Application 2019 & 2032
- Table 66: Israel Polymers in Agrochemicals Volume (K) Forecast, by Application 2019 & 2032
- Table 67: GCC Polymers in Agrochemicals Revenue (million) Forecast, by Application 2019 & 2032
- Table 68: GCC Polymers in Agrochemicals Volume (K) Forecast, by Application 2019 & 2032
- Table 69: North Africa Polymers in Agrochemicals Revenue (million) Forecast, by Application 2019 & 2032
- Table 70: North Africa Polymers in Agrochemicals Volume (K) Forecast, by Application 2019 & 2032
- Table 71: South Africa Polymers in Agrochemicals Revenue (million) Forecast, by Application 2019 & 2032
- Table 72: South Africa Polymers in Agrochemicals Volume (K) Forecast, by Application 2019 & 2032
- Table 73: Rest of Middle East & Africa Polymers in Agrochemicals Revenue (million) Forecast, by Application 2019 & 2032
- Table 74: Rest of Middle East & Africa Polymers in Agrochemicals Volume (K) Forecast, by Application 2019 & 2032
- Table 75: Global Polymers in Agrochemicals Revenue million Forecast, by Application 2019 & 2032
- Table 76: Global Polymers in Agrochemicals Volume K Forecast, by Application 2019 & 2032
- Table 77: Global Polymers in Agrochemicals Revenue million Forecast, by Types 2019 & 2032
- Table 78: Global Polymers in Agrochemicals Volume K Forecast, by Types 2019 & 2032
- Table 79: Global Polymers in Agrochemicals Revenue million Forecast, by Country 2019 & 2032
- Table 80: Global Polymers in Agrochemicals Volume K Forecast, by Country 2019 & 2032
- Table 81: China Polymers in Agrochemicals Revenue (million) Forecast, by Application 2019 & 2032
- Table 82: China Polymers in Agrochemicals Volume (K) Forecast, by Application 2019 & 2032
- Table 83: India Polymers in Agrochemicals Revenue (million) Forecast, by Application 2019 & 2032
- Table 84: India Polymers in Agrochemicals Volume (K) Forecast, by Application 2019 & 2032
- Table 85: Japan Polymers in Agrochemicals Revenue (million) Forecast, by Application 2019 & 2032
- Table 86: Japan Polymers in Agrochemicals Volume (K) Forecast, by Application 2019 & 2032
- Table 87: South Korea Polymers in Agrochemicals Revenue (million) Forecast, by Application 2019 & 2032
- Table 88: South Korea Polymers in Agrochemicals Volume (K) Forecast, by Application 2019 & 2032
- Table 89: ASEAN Polymers in Agrochemicals Revenue (million) Forecast, by Application 2019 & 2032
- Table 90: ASEAN Polymers in Agrochemicals Volume (K) Forecast, by Application 2019 & 2032
- Table 91: Oceania Polymers in Agrochemicals Revenue (million) Forecast, by Application 2019 & 2032
- Table 92: Oceania Polymers in Agrochemicals Volume (K) Forecast, by Application 2019 & 2032
- Table 93: Rest of Asia Pacific Polymers in Agrochemicals Revenue (million) Forecast, by Application 2019 & 2032
- Table 94: Rest of Asia Pacific Polymers in Agrochemicals Volume (K) Forecast, by Application 2019 & 2032
Frequently Asked Questions
1. What is the projected Compound Annual Growth Rate (CAGR) of the Polymers in Agrochemicals?
The projected CAGR is approximately XX%.
2. Which companies are prominent players in the Polymers in Agrochemicals?
Key companies in the market include Ashland, Borregaard, DKS Co. Ltd, DuPont, NIPPON SHOKUBAI, Dow Chemical Company, SE Tylose GmbH & Co. KG, Shin-Etsu, Daicel Miraizu Ltd, Lotte Fine Chemical Co., Ltd, Tai'an Ruitai, Zhangzhou Huafu Chemical, Shanghai Yuking Water Soluble Material, Star-Tech Specialty Products Co., Ltd., Jiaozuo Zhongwei Special Products Pharmaceutical, Xuzhou Liyuan.
3. What are the main segments of the Polymers in Agrochemicals?
The market segments include Application, Types.
4. Can you provide details about the market size?
The market size is estimated to be USD XXX million as of 2022.
5. What are some drivers contributing to market growth?
N/A
6. What are the notable trends driving market growth?
N/A
7. Are there any restraints impacting market growth?
N/A
8. Can you provide examples of recent developments in the market?
N/A
9. What pricing options are available for accessing the report?
Pricing options include single-user, multi-user, and enterprise licenses priced at USD 4000.00, USD 6000.00, and USD 8000.00 respectively.
10. Is the market size provided in terms of value or volume?
The market size is provided in terms of value, measured in million and volume, measured in K.
11. Are there any specific market keywords associated with the report?
Yes, the market keyword associated with the report is "Polymers in Agrochemicals," which aids in identifying and referencing the specific market segment covered.
12. How do I determine which pricing option suits my needs best?
The pricing options vary based on user requirements and access needs. Individual users may opt for single-user licenses, while businesses requiring broader access may choose multi-user or enterprise licenses for cost-effective access to the report.
13. Are there any additional resources or data provided in the Polymers in Agrochemicals report?
While the report offers comprehensive insights, it's advisable to review the specific contents or supplementary materials provided to ascertain if additional resources or data are available.
14. How can I stay updated on further developments or reports in the Polymers in Agrochemicals?
To stay informed about further developments, trends, and reports in the Polymers in Agrochemicals, consider subscribing to industry newsletters, following relevant companies and organizations, or regularly checking reputable industry news sources and publications.
Methodology
Step 1 - Identification of Relevant Samples Size from Population Database


Step 2 - Approaches for Defining Global Market Size (Value, Volume* & Price*)

Note*: In applicable scenarios
Step 3 - Data Sources
Primary Research
- Web Analytics
- Survey Reports
- Research Institute
- Latest Research Reports
- Opinion Leaders
Secondary Research
- Annual Reports
- White Paper
- Latest Press Release
- Industry Association
- Paid Database
- Investor Presentations

Step 4 - Data Triangulation
Involves using different sources of information in order to increase the validity of a study
These sources are likely to be stakeholders in a program - participants, other researchers, program staff, other community members, and so on.
Then we put all data in single framework & apply various statistical tools to find out the dynamic on the market.
During the analysis stage, feedback from the stakeholder groups would be compared to determine areas of agreement as well as areas of divergence


