

Key Insights
The US liquid nematicide market, estimated at 356.6 million in 2025, is poised for significant expansion. This growth is propelled by escalating nematode infestations across vital agricultural zones such as the Midwest and Southeast. The increasing demand for enhanced crop yields and the widespread adoption of sustainable farming methodologies are key drivers. Liquid nematicides are the preferred formulation due to their user-friendly application and broad-spectrum efficacy against diverse nematode species. While organophosphate and carbamate segments currently lead, the bio-based nematicide sector is experiencing notable growth, driven by consumer preference for eco-friendly pest control. Leading entities, including Bayer CropScience AG, Syngenta International AG, and Corteva Agriscience, are actively investing in R&D to develop innovative, effective, and sustainable liquid nematicides. This competitive landscape fosters innovation, yet stringent regulations and environmental concerns surrounding chemical nematicides present market challenges.
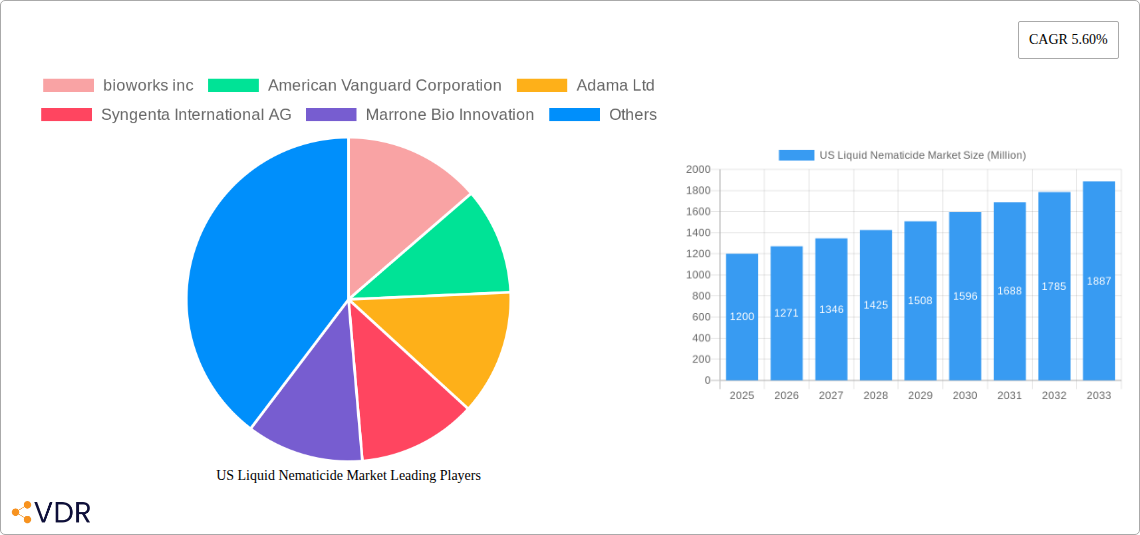
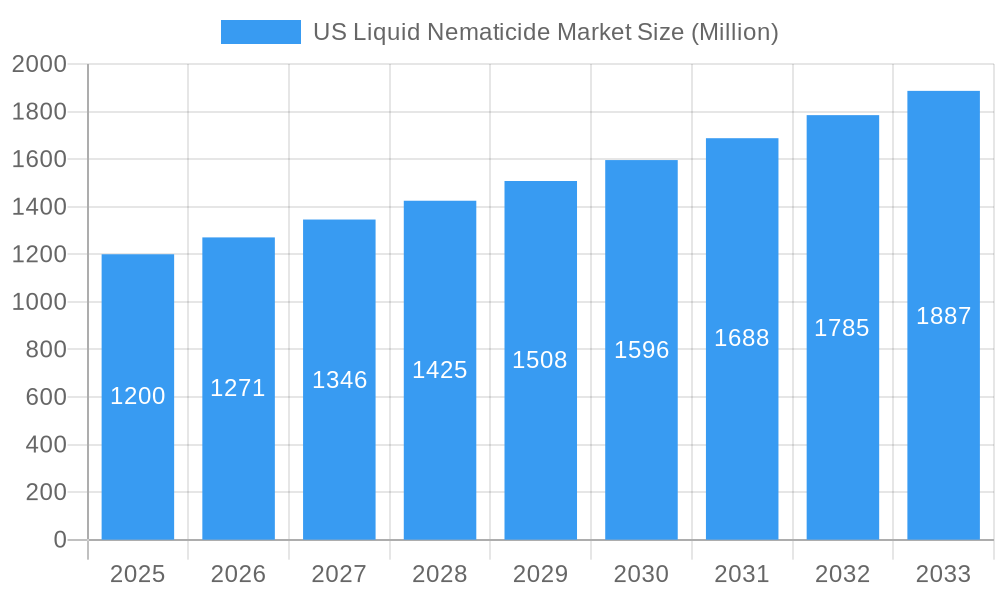
US Liquid Nematicide Market Market Size (In Million)
The market is projected to achieve a Compound Annual Growth Rate (CAGR) of 5.6% from 2025 to 2033. This upward trajectory is supported by expanding cultivation areas for nematode-vulnerable crops like grains & cereals, pulses & oilseeds, and commercial crops. The integration of advanced agricultural technologies, such as precision farming, enhances targeted nematicide application, optimizing effectiveness and minimizing environmental impact. Segmentation by application reveals a dominant demand from the grains & cereals sector, followed by pulses & oilseeds and commercial crops. Future market dynamics will be shaped by the successful launch of novel, environmentally conscious bio-based nematicides and supportive government initiatives for sustainable pest management.
US Liquid Nematicide Market Company Market Share
US Liquid Nematicide Market: A Comprehensive Report (2019-2033)
This comprehensive report provides a detailed analysis of the US liquid nematicide market, encompassing market dynamics, growth trends, dominant segments, and key players. The study period covers 2019-2033, with 2025 serving as the base and estimated year. The forecast period extends from 2025 to 2033, while the historical period analyzed is 2019-2024. The report offers valuable insights for industry professionals, investors, and stakeholders seeking to understand this dynamic market. The total market size in 2025 is estimated at XX Million units.
US Liquid Nematicide Market Dynamics & Structure
The US liquid nematicide market is characterized by moderate concentration, with key players like Syngenta International AG, Corteva Agriscience, Bayer CropScience AG, BASF SE, and Adama Ltd holding significant market share (collectively estimated at 65% in 2025). Technological innovation, driven by the need for more effective and environmentally friendly nematicides, is a crucial market driver. Stringent regulatory frameworks, particularly concerning the use of certain chemical types, pose significant challenges. Bio-based nematicides represent a growing segment, driven by increasing consumer demand for sustainable agricultural practices. The market also faces competition from alternative pest management techniques.
- Market Concentration: Moderately concentrated, with top 5 players holding 65% market share in 2025.
- Technological Innovation: Focus on bio-based nematicides and reduced environmental impact.
- Regulatory Framework: Stringent regulations impacting chemical nematicide usage.
- Competitive Substitutes: Biological control methods and integrated pest management strategies.
- M&A Activity: Moderate M&A activity observed in the past five years, with approximately xx deals recorded, primarily focused on expanding product portfolios and geographical reach.
US Liquid Nematicide Market Growth Trends & Insights
The US liquid nematicide market experienced a compound annual growth rate (CAGR) of xx% during the historical period (2019-2024), reaching XX Million units in 2025. Growth is primarily fueled by the increasing prevalence of nematode infestations in key agricultural regions and rising demand for high-yielding crops. The adoption of advanced nematicide formulations, particularly liquid formulations, is also driving market expansion. Shifting consumer preferences towards organic and sustainably produced food are positively impacting the bio-based nematicide segment, projected to grow at a CAGR of xx% during the forecast period. Technological disruptions, such as the development of targeted nematicides, are further expected to enhance market growth. Market penetration of liquid nematicides is currently at xx%, with significant growth potential in underpenetrated regions.
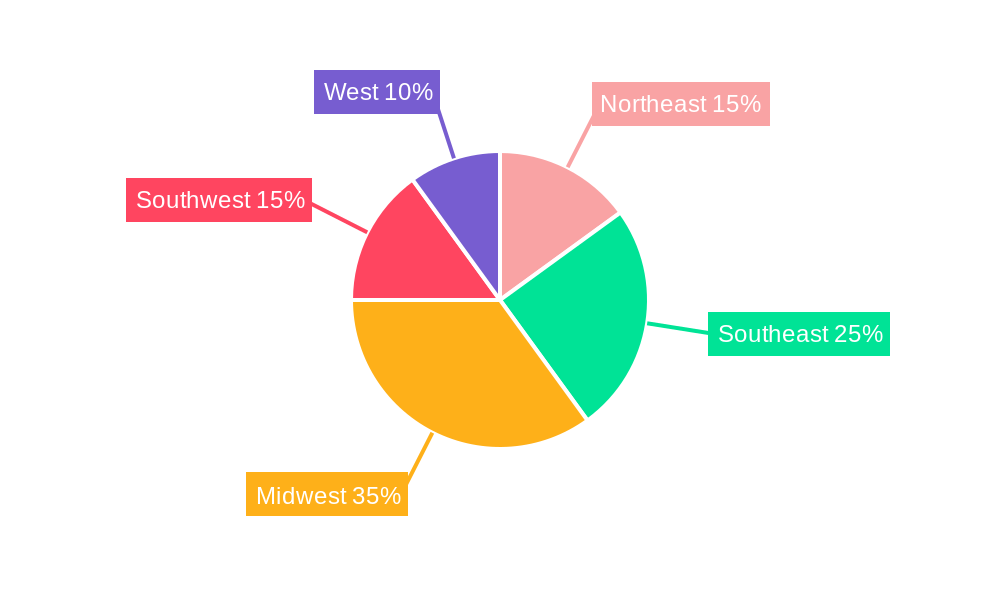
Dominant Regions, Countries, or Segments in US Liquid Nematicide Market
The largest segment within the US liquid nematicide market is the Liquid formulation segment, accounting for approximately 70% of the total market value in 2025. Within application types, Fruits & Vegetables represent the largest end-use sector, followed by Grains & Cereals. The Chemical Type segment dominated by Organophosphates and subsequently Halogen Compounds and Other Fumigants, reflecting the existing market trends. California, Florida, and other major agricultural states are leading regional markets.
- Key Growth Drivers: Rising demand for high-yielding crops, increasing nematode infestations, adoption of advanced formulations.
- Dominant Regions: California, Florida, and other major agricultural states.
- Dominant Segments: Liquid formulations, Fruits & Vegetables application type, Organophosphate chemical type.
- Growth Potential: Significant potential for bio-based nematicide adoption and expansion into underpenetrated regions.
US Liquid Nematicide Market Product Landscape
The US liquid nematicide market offers a diverse range of products catering to various crop types and pest control needs. Recent innovations include formulations with improved efficacy, reduced environmental impact, and targeted delivery systems. Manufacturers are focusing on developing nematicides with enhanced compatibility with other crop protection products. The key selling propositions are improved efficacy, reduced environmental impact and improved crop yields.
Key Drivers, Barriers & Challenges in US Liquid Nematicide Market
Key Drivers: Rising agricultural production, increasing pest infestations, growing demand for high-yield crops, government initiatives to support sustainable agricultural practices.
Key Barriers & Challenges: Stringent environmental regulations, high cost of development and registration of new products, emergence of resistant nematode populations, competition from other pest control methods, concerns about potential health and environmental impacts. The development and registration of new nematicides are facing significant delays due to the stringent regulatory requirements. This has led to the limited introduction of innovative products which impacts market growth.
Emerging Opportunities in US Liquid Nematicide Market
Growing demand for organic and sustainable agricultural practices presents significant opportunities for bio-based nematicides. The development of innovative formulations, such as nanoformulations and targeted delivery systems, represents a significant area for growth. Untapped markets in specialty crops and organic farming represent considerable potential for market expansion.
Growth Accelerators in the US Liquid Nematicide Market Industry
Technological advancements in nematicide development, strategic partnerships between chemical companies and agricultural technology providers, and the expansion into emerging markets will accelerate market growth in the forecast period. Investments in research and development focused on developing novel nematicides with improved efficacy and reduced environmental impact are crucial for long-term market expansion.
Key Players Shaping the US Liquid Nematicide Market Market
- bioworks inc
- American Vanguard Corporation
- Adama Ltd
- Syngenta International AG
- Marrone Bio Innovations
- Corteva Agriscience
- Bayer CropScience AG
- Nufarm Ltd
- BASF SE
Notable Milestones in US Liquid Nematicide Market Sector
- 2021: Launch of a new bio-based nematicide by Marrone Bio Innovations.
- 2022: Syngenta International AG announced a major investment in nematicide R&D.
- 2023: Acquisition of a smaller nematicide producer by Adama Ltd. (Further details on specific dates and events will be provided in the full report.)
In-Depth US Liquid Nematicide Market Market Outlook
The US liquid nematicide market is poised for significant growth over the next decade, driven by technological advancements, rising demand for sustainable agriculture, and increasing pest pressure. Strategic partnerships, investments in R&D, and expansion into new markets will further drive market expansion. The bio-based segment is expected to witness particularly strong growth, offering significant opportunities for innovation and market leadership.
US Liquid Nematicide Market Segmentation
- 1. Production Analysis
- 2. Consumption Analysis
- 3. Import Market Analysis (Value & Volume)
- 4. Export Market Analysis (Value & Volume)
- 5. Price Trend Analysis
US Liquid Nematicide Market Segmentation By Geography
-
1. North America
- 1.1. United States
- 1.2. Canada
- 1.3. Mexico
-
2. South America
- 2.1. Brazil
- 2.2. Argentina
- 2.3. Rest of South America
-
3. Europe
- 3.1. United Kingdom
- 3.2. Germany
- 3.3. France
- 3.4. Italy
- 3.5. Spain
- 3.6. Russia
- 3.7. Benelux
- 3.8. Nordics
- 3.9. Rest of Europe
-
4. Middle East & Africa
- 4.1. Turkey
- 4.2. Israel
- 4.3. GCC
- 4.4. North Africa
- 4.5. South Africa
- 4.6. Rest of Middle East & Africa
-
5. Asia Pacific
- 5.1. China
- 5.2. India
- 5.3. Japan
- 5.4. South Korea
- 5.5. ASEAN
- 5.6. Oceania
- 5.7. Rest of Asia Pacific
US Liquid Nematicide Market Regional Market Share
Geographic Coverage of US Liquid Nematicide Market
US Liquid Nematicide Market REPORT HIGHLIGHTS
| Aspects | Details |
|---|---|
| Study Period | 2020-2034 |
| Base Year | 2025 |
| Estimated Year | 2026 |
| Forecast Period | 2026-2034 |
| Historical Period | 2020-2025 |
| Growth Rate | CAGR of 5.6% from 2020-2034 |
| Segmentation |
|
Table of Contents
- 1. Introduction
- 1.1. Research Scope
- 1.2. Market Segmentation
- 1.3. Research Objective
- 1.4. Definitions and Assumptions
- 2. Executive Summary
- 2.1. Market Snapshot
- 3. Market Dynamics
- 3.1. Market Drivers
- 3.2. Market Restrains
- 3.3. Market Trends
- 3.4. Market Opportunities
- 4. Market Factor Analysis
- 4.1. Porters Five Forces
- 4.1.1. Bargaining Power of Suppliers
- 4.1.2. Bargaining Power of Buyers
- 4.1.3. Threat of New Entrants
- 4.1.4. Threat of Substitutes
- 4.1.5. Competitive Rivalry
- 4.2. PESTEL analysis
- 4.3. BCG Analysis
- 4.3.1. Stars (High Growth, High Market Share)
- 4.3.2. Cash Cows (Low Growth, High Market Share)
- 4.3.3. Question Mark (High Growth, Low Market Share)
- 4.3.4. Dogs (Low Growth, Low Market Share)
- 4.4. Ansoff Matrix Analysis
- 4.5. Supply Chain Analysis
- 4.6. Regulatory Landscape
- 4.7. Current Market Potential and Opportunity Assessment (TAM–SAM–SOM Framework)
- 4.8. VDR Analyst Note
- 4.1. Porters Five Forces
- 5. Market Analysis, Insights and Forecast 2021-2033
- 5.1. Market Analysis, Insights and Forecast - by Production Analysis
- 5.2. Market Analysis, Insights and Forecast - by Consumption Analysis
- 5.3. Market Analysis, Insights and Forecast - by Import Market Analysis (Value & Volume)
- 5.4. Market Analysis, Insights and Forecast - by Export Market Analysis (Value & Volume)
- 5.5. Market Analysis, Insights and Forecast - by Price Trend Analysis
- 5.6. Market Analysis, Insights and Forecast - by Region
- 5.6.1. North America
- 5.6.2. South America
- 5.6.3. Europe
- 5.6.4. Middle East & Africa
- 5.6.5. Asia Pacific
- 6. Global US Liquid Nematicide Market Analysis, Insights and Forecast, 2021-2033
- 6.1. Market Analysis, Insights and Forecast - by Production Analysis
- 6.2. Market Analysis, Insights and Forecast - by Consumption Analysis
- 6.3. Market Analysis, Insights and Forecast - by Import Market Analysis (Value & Volume)
- 6.4. Market Analysis, Insights and Forecast - by Export Market Analysis (Value & Volume)
- 6.5. Market Analysis, Insights and Forecast - by Price Trend Analysis
- 7. North America US Liquid Nematicide Market Analysis, Insights and Forecast, 2021-2033
- 7.1. Market Analysis, Insights and Forecast - by Production Analysis
- 7.2. Market Analysis, Insights and Forecast - by Consumption Analysis
- 7.3. Market Analysis, Insights and Forecast - by Import Market Analysis (Value & Volume)
- 7.4. Market Analysis, Insights and Forecast - by Export Market Analysis (Value & Volume)
- 7.5. Market Analysis, Insights and Forecast - by Price Trend Analysis
- 8. South America US Liquid Nematicide Market Analysis, Insights and Forecast, 2021-2033
- 8.1. Market Analysis, Insights and Forecast - by Production Analysis
- 8.2. Market Analysis, Insights and Forecast - by Consumption Analysis
- 8.3. Market Analysis, Insights and Forecast - by Import Market Analysis (Value & Volume)
- 8.4. Market Analysis, Insights and Forecast - by Export Market Analysis (Value & Volume)
- 8.5. Market Analysis, Insights and Forecast - by Price Trend Analysis
- 9. Europe US Liquid Nematicide Market Analysis, Insights and Forecast, 2021-2033
- 9.1. Market Analysis, Insights and Forecast - by Production Analysis
- 9.2. Market Analysis, Insights and Forecast - by Consumption Analysis
- 9.3. Market Analysis, Insights and Forecast - by Import Market Analysis (Value & Volume)
- 9.4. Market Analysis, Insights and Forecast - by Export Market Analysis (Value & Volume)
- 9.5. Market Analysis, Insights and Forecast - by Price Trend Analysis
- 10. Middle East & Africa US Liquid Nematicide Market Analysis, Insights and Forecast, 2021-2033
- 10.1. Market Analysis, Insights and Forecast - by Production Analysis
- 10.2. Market Analysis, Insights and Forecast - by Consumption Analysis
- 10.3. Market Analysis, Insights and Forecast - by Import Market Analysis (Value & Volume)
- 10.4. Market Analysis, Insights and Forecast - by Export Market Analysis (Value & Volume)
- 10.5. Market Analysis, Insights and Forecast - by Price Trend Analysis
- 11. Asia Pacific US Liquid Nematicide Market Analysis, Insights and Forecast, 2021-2033
- 11.1. Market Analysis, Insights and Forecast - by Production Analysis
- 11.2. Market Analysis, Insights and Forecast - by Consumption Analysis
- 11.3. Market Analysis, Insights and Forecast - by Import Market Analysis (Value & Volume)
- 11.4. Market Analysis, Insights and Forecast - by Export Market Analysis (Value & Volume)
- 11.5. Market Analysis, Insights and Forecast - by Price Trend Analysis
- 12. Competitive Analysis
- 12.1. Company Profiles
- 12.1.1 bioworks inc
- 12.1.1.1. Company Overview
- 12.1.1.2. Products
- 12.1.1.3. Company Financials
- 12.1.1.4. SWOT Analysis
- 12.1.2 American Vanguard Corporation
- 12.1.2.1. Company Overview
- 12.1.2.2. Products
- 12.1.2.3. Company Financials
- 12.1.2.4. SWOT Analysis
- 12.1.3 Adama Ltd
- 12.1.3.1. Company Overview
- 12.1.3.2. Products
- 12.1.3.3. Company Financials
- 12.1.3.4. SWOT Analysis
- 12.1.4 Syngenta International AG
- 12.1.4.1. Company Overview
- 12.1.4.2. Products
- 12.1.4.3. Company Financials
- 12.1.4.4. SWOT Analysis
- 12.1.5 Marrone Bio Innovation
- 12.1.5.1. Company Overview
- 12.1.5.2. Products
- 12.1.5.3. Company Financials
- 12.1.5.4. SWOT Analysis
- 12.1.6 Corteva Agriscience
- 12.1.6.1. Company Overview
- 12.1.6.2. Products
- 12.1.6.3. Company Financials
- 12.1.6.4. SWOT Analysis
- 12.1.7 Bayer CropScience AG
- 12.1.7.1. Company Overview
- 12.1.7.2. Products
- 12.1.7.3. Company Financials
- 12.1.7.4. SWOT Analysis
- 12.1.8 Nufarm Ltd
- 12.1.8.1. Company Overview
- 12.1.8.2. Products
- 12.1.8.3. Company Financials
- 12.1.8.4. SWOT Analysis
- 12.1.9 BASF SE
- 12.1.9.1. Company Overview
- 12.1.9.2. Products
- 12.1.9.3. Company Financials
- 12.1.9.4. SWOT Analysis
- 12.1.1 bioworks inc
- 12.2. Market Entropy
- 12.2.1 Company's Key Areas Served
- 12.2.2 Recent Developments
- 12.3. Company Market Share Analysis 2025
- 12.3.1 Top 5 Companies Market Share Analysis
- 12.3.2 Top 3 Companies Market Share Analysis
- 12.4. List of Potential Customers
- 13. Research Methodology
List of Figures
- Figure 1: Global US Liquid Nematicide Market Revenue Breakdown (million, %) by Region 2025 & 2033
- Figure 2: North America US Liquid Nematicide Market Revenue (million), by Production Analysis 2025 & 2033
- Figure 3: North America US Liquid Nematicide Market Revenue Share (%), by Production Analysis 2025 & 2033
- Figure 4: North America US Liquid Nematicide Market Revenue (million), by Consumption Analysis 2025 & 2033
- Figure 5: North America US Liquid Nematicide Market Revenue Share (%), by Consumption Analysis 2025 & 2033
- Figure 6: North America US Liquid Nematicide Market Revenue (million), by Import Market Analysis (Value & Volume) 2025 & 2033
- Figure 7: North America US Liquid Nematicide Market Revenue Share (%), by Import Market Analysis (Value & Volume) 2025 & 2033
- Figure 8: North America US Liquid Nematicide Market Revenue (million), by Export Market Analysis (Value & Volume) 2025 & 2033
- Figure 9: North America US Liquid Nematicide Market Revenue Share (%), by Export Market Analysis (Value & Volume) 2025 & 2033
- Figure 10: North America US Liquid Nematicide Market Revenue (million), by Price Trend Analysis 2025 & 2033
- Figure 11: North America US Liquid Nematicide Market Revenue Share (%), by Price Trend Analysis 2025 & 2033
- Figure 12: North America US Liquid Nematicide Market Revenue (million), by Country 2025 & 2033
- Figure 13: North America US Liquid Nematicide Market Revenue Share (%), by Country 2025 & 2033
- Figure 14: South America US Liquid Nematicide Market Revenue (million), by Production Analysis 2025 & 2033
- Figure 15: South America US Liquid Nematicide Market Revenue Share (%), by Production Analysis 2025 & 2033
- Figure 16: South America US Liquid Nematicide Market Revenue (million), by Consumption Analysis 2025 & 2033
- Figure 17: South America US Liquid Nematicide Market Revenue Share (%), by Consumption Analysis 2025 & 2033
- Figure 18: South America US Liquid Nematicide Market Revenue (million), by Import Market Analysis (Value & Volume) 2025 & 2033
- Figure 19: South America US Liquid Nematicide Market Revenue Share (%), by Import Market Analysis (Value & Volume) 2025 & 2033
- Figure 20: South America US Liquid Nematicide Market Revenue (million), by Export Market Analysis (Value & Volume) 2025 & 2033
- Figure 21: South America US Liquid Nematicide Market Revenue Share (%), by Export Market Analysis (Value & Volume) 2025 & 2033
- Figure 22: South America US Liquid Nematicide Market Revenue (million), by Price Trend Analysis 2025 & 2033
- Figure 23: South America US Liquid Nematicide Market Revenue Share (%), by Price Trend Analysis 2025 & 2033
- Figure 24: South America US Liquid Nematicide Market Revenue (million), by Country 2025 & 2033
- Figure 25: South America US Liquid Nematicide Market Revenue Share (%), by Country 2025 & 2033
- Figure 26: Europe US Liquid Nematicide Market Revenue (million), by Production Analysis 2025 & 2033
- Figure 27: Europe US Liquid Nematicide Market Revenue Share (%), by Production Analysis 2025 & 2033
- Figure 28: Europe US Liquid Nematicide Market Revenue (million), by Consumption Analysis 2025 & 2033
- Figure 29: Europe US Liquid Nematicide Market Revenue Share (%), by Consumption Analysis 2025 & 2033
- Figure 30: Europe US Liquid Nematicide Market Revenue (million), by Import Market Analysis (Value & Volume) 2025 & 2033
- Figure 31: Europe US Liquid Nematicide Market Revenue Share (%), by Import Market Analysis (Value & Volume) 2025 & 2033
- Figure 32: Europe US Liquid Nematicide Market Revenue (million), by Export Market Analysis (Value & Volume) 2025 & 2033
- Figure 33: Europe US Liquid Nematicide Market Revenue Share (%), by Export Market Analysis (Value & Volume) 2025 & 2033
- Figure 34: Europe US Liquid Nematicide Market Revenue (million), by Price Trend Analysis 2025 & 2033
- Figure 35: Europe US Liquid Nematicide Market Revenue Share (%), by Price Trend Analysis 2025 & 2033
- Figure 36: Europe US Liquid Nematicide Market Revenue (million), by Country 2025 & 2033
- Figure 37: Europe US Liquid Nematicide Market Revenue Share (%), by Country 2025 & 2033
- Figure 38: Middle East & Africa US Liquid Nematicide Market Revenue (million), by Production Analysis 2025 & 2033
- Figure 39: Middle East & Africa US Liquid Nematicide Market Revenue Share (%), by Production Analysis 2025 & 2033
- Figure 40: Middle East & Africa US Liquid Nematicide Market Revenue (million), by Consumption Analysis 2025 & 2033
- Figure 41: Middle East & Africa US Liquid Nematicide Market Revenue Share (%), by Consumption Analysis 2025 & 2033
- Figure 42: Middle East & Africa US Liquid Nematicide Market Revenue (million), by Import Market Analysis (Value & Volume) 2025 & 2033
- Figure 43: Middle East & Africa US Liquid Nematicide Market Revenue Share (%), by Import Market Analysis (Value & Volume) 2025 & 2033
- Figure 44: Middle East & Africa US Liquid Nematicide Market Revenue (million), by Export Market Analysis (Value & Volume) 2025 & 2033
- Figure 45: Middle East & Africa US Liquid Nematicide Market Revenue Share (%), by Export Market Analysis (Value & Volume) 2025 & 2033
- Figure 46: Middle East & Africa US Liquid Nematicide Market Revenue (million), by Price Trend Analysis 2025 & 2033
- Figure 47: Middle East & Africa US Liquid Nematicide Market Revenue Share (%), by Price Trend Analysis 2025 & 2033
- Figure 48: Middle East & Africa US Liquid Nematicide Market Revenue (million), by Country 2025 & 2033
- Figure 49: Middle East & Africa US Liquid Nematicide Market Revenue Share (%), by Country 2025 & 2033
- Figure 50: Asia Pacific US Liquid Nematicide Market Revenue (million), by Production Analysis 2025 & 2033
- Figure 51: Asia Pacific US Liquid Nematicide Market Revenue Share (%), by Production Analysis 2025 & 2033
- Figure 52: Asia Pacific US Liquid Nematicide Market Revenue (million), by Consumption Analysis 2025 & 2033
- Figure 53: Asia Pacific US Liquid Nematicide Market Revenue Share (%), by Consumption Analysis 2025 & 2033
- Figure 54: Asia Pacific US Liquid Nematicide Market Revenue (million), by Import Market Analysis (Value & Volume) 2025 & 2033
- Figure 55: Asia Pacific US Liquid Nematicide Market Revenue Share (%), by Import Market Analysis (Value & Volume) 2025 & 2033
- Figure 56: Asia Pacific US Liquid Nematicide Market Revenue (million), by Export Market Analysis (Value & Volume) 2025 & 2033
- Figure 57: Asia Pacific US Liquid Nematicide Market Revenue Share (%), by Export Market Analysis (Value & Volume) 2025 & 2033
- Figure 58: Asia Pacific US Liquid Nematicide Market Revenue (million), by Price Trend Analysis 2025 & 2033
- Figure 59: Asia Pacific US Liquid Nematicide Market Revenue Share (%), by Price Trend Analysis 2025 & 2033
- Figure 60: Asia Pacific US Liquid Nematicide Market Revenue (million), by Country 2025 & 2033
- Figure 61: Asia Pacific US Liquid Nematicide Market Revenue Share (%), by Country 2025 & 2033
List of Tables
- Table 1: Global US Liquid Nematicide Market Revenue million Forecast, by Production Analysis 2020 & 2033
- Table 2: Global US Liquid Nematicide Market Revenue million Forecast, by Consumption Analysis 2020 & 2033
- Table 3: Global US Liquid Nematicide Market Revenue million Forecast, by Import Market Analysis (Value & Volume) 2020 & 2033
- Table 4: Global US Liquid Nematicide Market Revenue million Forecast, by Export Market Analysis (Value & Volume) 2020 & 2033
- Table 5: Global US Liquid Nematicide Market Revenue million Forecast, by Price Trend Analysis 2020 & 2033
- Table 6: Global US Liquid Nematicide Market Revenue million Forecast, by Region 2020 & 2033
- Table 7: Global US Liquid Nematicide Market Revenue million Forecast, by Production Analysis 2020 & 2033
- Table 8: Global US Liquid Nematicide Market Revenue million Forecast, by Consumption Analysis 2020 & 2033
- Table 9: Global US Liquid Nematicide Market Revenue million Forecast, by Import Market Analysis (Value & Volume) 2020 & 2033
- Table 10: Global US Liquid Nematicide Market Revenue million Forecast, by Export Market Analysis (Value & Volume) 2020 & 2033
- Table 11: Global US Liquid Nematicide Market Revenue million Forecast, by Price Trend Analysis 2020 & 2033
- Table 12: Global US Liquid Nematicide Market Revenue million Forecast, by Country 2020 & 2033
- Table 13: United States US Liquid Nematicide Market Revenue (million) Forecast, by Application 2020 & 2033
- Table 14: Canada US Liquid Nematicide Market Revenue (million) Forecast, by Application 2020 & 2033
- Table 15: Mexico US Liquid Nematicide Market Revenue (million) Forecast, by Application 2020 & 2033
- Table 16: Global US Liquid Nematicide Market Revenue million Forecast, by Production Analysis 2020 & 2033
- Table 17: Global US Liquid Nematicide Market Revenue million Forecast, by Consumption Analysis 2020 & 2033
- Table 18: Global US Liquid Nematicide Market Revenue million Forecast, by Import Market Analysis (Value & Volume) 2020 & 2033
- Table 19: Global US Liquid Nematicide Market Revenue million Forecast, by Export Market Analysis (Value & Volume) 2020 & 2033
- Table 20: Global US Liquid Nematicide Market Revenue million Forecast, by Price Trend Analysis 2020 & 2033
- Table 21: Global US Liquid Nematicide Market Revenue million Forecast, by Country 2020 & 2033
- Table 22: Brazil US Liquid Nematicide Market Revenue (million) Forecast, by Application 2020 & 2033
- Table 23: Argentina US Liquid Nematicide Market Revenue (million) Forecast, by Application 2020 & 2033
- Table 24: Rest of South America US Liquid Nematicide Market Revenue (million) Forecast, by Application 2020 & 2033
- Table 25: Global US Liquid Nematicide Market Revenue million Forecast, by Production Analysis 2020 & 2033
- Table 26: Global US Liquid Nematicide Market Revenue million Forecast, by Consumption Analysis 2020 & 2033
- Table 27: Global US Liquid Nematicide Market Revenue million Forecast, by Import Market Analysis (Value & Volume) 2020 & 2033
- Table 28: Global US Liquid Nematicide Market Revenue million Forecast, by Export Market Analysis (Value & Volume) 2020 & 2033
- Table 29: Global US Liquid Nematicide Market Revenue million Forecast, by Price Trend Analysis 2020 & 2033
- Table 30: Global US Liquid Nematicide Market Revenue million Forecast, by Country 2020 & 2033
- Table 31: United Kingdom US Liquid Nematicide Market Revenue (million) Forecast, by Application 2020 & 2033
- Table 32: Germany US Liquid Nematicide Market Revenue (million) Forecast, by Application 2020 & 2033
- Table 33: France US Liquid Nematicide Market Revenue (million) Forecast, by Application 2020 & 2033
- Table 34: Italy US Liquid Nematicide Market Revenue (million) Forecast, by Application 2020 & 2033
- Table 35: Spain US Liquid Nematicide Market Revenue (million) Forecast, by Application 2020 & 2033
- Table 36: Russia US Liquid Nematicide Market Revenue (million) Forecast, by Application 2020 & 2033
- Table 37: Benelux US Liquid Nematicide Market Revenue (million) Forecast, by Application 2020 & 2033
- Table 38: Nordics US Liquid Nematicide Market Revenue (million) Forecast, by Application 2020 & 2033
- Table 39: Rest of Europe US Liquid Nematicide Market Revenue (million) Forecast, by Application 2020 & 2033
- Table 40: Global US Liquid Nematicide Market Revenue million Forecast, by Production Analysis 2020 & 2033
- Table 41: Global US Liquid Nematicide Market Revenue million Forecast, by Consumption Analysis 2020 & 2033
- Table 42: Global US Liquid Nematicide Market Revenue million Forecast, by Import Market Analysis (Value & Volume) 2020 & 2033
- Table 43: Global US Liquid Nematicide Market Revenue million Forecast, by Export Market Analysis (Value & Volume) 2020 & 2033
- Table 44: Global US Liquid Nematicide Market Revenue million Forecast, by Price Trend Analysis 2020 & 2033
- Table 45: Global US Liquid Nematicide Market Revenue million Forecast, by Country 2020 & 2033
- Table 46: Turkey US Liquid Nematicide Market Revenue (million) Forecast, by Application 2020 & 2033
- Table 47: Israel US Liquid Nematicide Market Revenue (million) Forecast, by Application 2020 & 2033
- Table 48: GCC US Liquid Nematicide Market Revenue (million) Forecast, by Application 2020 & 2033
- Table 49: North Africa US Liquid Nematicide Market Revenue (million) Forecast, by Application 2020 & 2033
- Table 50: South Africa US Liquid Nematicide Market Revenue (million) Forecast, by Application 2020 & 2033
- Table 51: Rest of Middle East & Africa US Liquid Nematicide Market Revenue (million) Forecast, by Application 2020 & 2033
- Table 52: Global US Liquid Nematicide Market Revenue million Forecast, by Production Analysis 2020 & 2033
- Table 53: Global US Liquid Nematicide Market Revenue million Forecast, by Consumption Analysis 2020 & 2033
- Table 54: Global US Liquid Nematicide Market Revenue million Forecast, by Import Market Analysis (Value & Volume) 2020 & 2033
- Table 55: Global US Liquid Nematicide Market Revenue million Forecast, by Export Market Analysis (Value & Volume) 2020 & 2033
- Table 56: Global US Liquid Nematicide Market Revenue million Forecast, by Price Trend Analysis 2020 & 2033
- Table 57: Global US Liquid Nematicide Market Revenue million Forecast, by Country 2020 & 2033
- Table 58: China US Liquid Nematicide Market Revenue (million) Forecast, by Application 2020 & 2033
- Table 59: India US Liquid Nematicide Market Revenue (million) Forecast, by Application 2020 & 2033
- Table 60: Japan US Liquid Nematicide Market Revenue (million) Forecast, by Application 2020 & 2033
- Table 61: South Korea US Liquid Nematicide Market Revenue (million) Forecast, by Application 2020 & 2033
- Table 62: ASEAN US Liquid Nematicide Market Revenue (million) Forecast, by Application 2020 & 2033
- Table 63: Oceania US Liquid Nematicide Market Revenue (million) Forecast, by Application 2020 & 2033
- Table 64: Rest of Asia Pacific US Liquid Nematicide Market Revenue (million) Forecast, by Application 2020 & 2033
Frequently Asked Questions
1. What is the projected Compound Annual Growth Rate (CAGR) of the US Liquid Nematicide Market?
The projected CAGR is approximately 5.6%.
2. Which companies are prominent players in the US Liquid Nematicide Market?
Key companies in the market include bioworks inc, American Vanguard Corporation, Adama Ltd, Syngenta International AG, Marrone Bio Innovation, Corteva Agriscience, Bayer CropScience AG, Nufarm Ltd, BASF SE.
3. What are the main segments of the US Liquid Nematicide Market?
The market segments include Production Analysis, Consumption Analysis, Import Market Analysis (Value & Volume), Export Market Analysis (Value & Volume), Price Trend Analysis.
4. Can you provide details about the market size?
The market size is estimated to be USD 356.6 million as of 2022.
5. What are some drivers contributing to market growth?
Seed Treatment As A Solution To Enhance Yield; Growing Awareness For Seed Treatment Among The Farmers; Rising Trend Of Organic Farming.
6. What are the notable trends driving market growth?
Increase Nematode Management in Vegetable crops.
7. Are there any restraints impacting market growth?
Limitations Across Farm-Level Seed Treatment; Rising Environmental Concerns.
8. Can you provide examples of recent developments in the market?
N/A
9. What pricing options are available for accessing the report?
Pricing options include single-user, multi-user, and enterprise licenses priced at USD 3800, USD 4500, and USD 5800 respectively.
10. Is the market size provided in terms of value or volume?
The market size is provided in terms of value, measured in million.
11. Are there any specific market keywords associated with the report?
Yes, the market keyword associated with the report is "US Liquid Nematicide Market," which aids in identifying and referencing the specific market segment covered.
12. How do I determine which pricing option suits my needs best?
The pricing options vary based on user requirements and access needs. Individual users may opt for single-user licenses, while businesses requiring broader access may choose multi-user or enterprise licenses for cost-effective access to the report.
13. Are there any additional resources or data provided in the US Liquid Nematicide Market report?
While the report offers comprehensive insights, it's advisable to review the specific contents or supplementary materials provided to ascertain if additional resources or data are available.
14. How can I stay updated on further developments or reports in the US Liquid Nematicide Market?
To stay informed about further developments, trends, and reports in the US Liquid Nematicide Market, consider subscribing to industry newsletters, following relevant companies and organizations, or regularly checking reputable industry news sources and publications.
Methodology
Step 1 - Identification of Relevant Samples Size from Population Database


Step 2 - Approaches for Defining Global Market Size (Value, Volume* & Price*)

Note*: In applicable scenarios
Step 3 - Data Sources
Primary Research
- Web Analytics
- Survey Reports
- Research Institute
- Latest Research Reports
- Opinion Leaders
Secondary Research
- Annual Reports
- White Paper
- Latest Press Release
- Industry Association
- Paid Database
- Investor Presentations

Step 4 - Data Triangulation
Involves using different sources of information in order to increase the validity of a study
These sources are likely to be stakeholders in a program - participants, other researchers, program staff, other community members, and so on.
Then we put all data in single framework & apply various statistical tools to find out the dynamic on the market.
During the analysis stage, feedback from the stakeholder groups would be compared to determine areas of agreement as well as areas of divergence